Q BankQuestion BankDocsDocuments

C4.1.7—Population growth curves

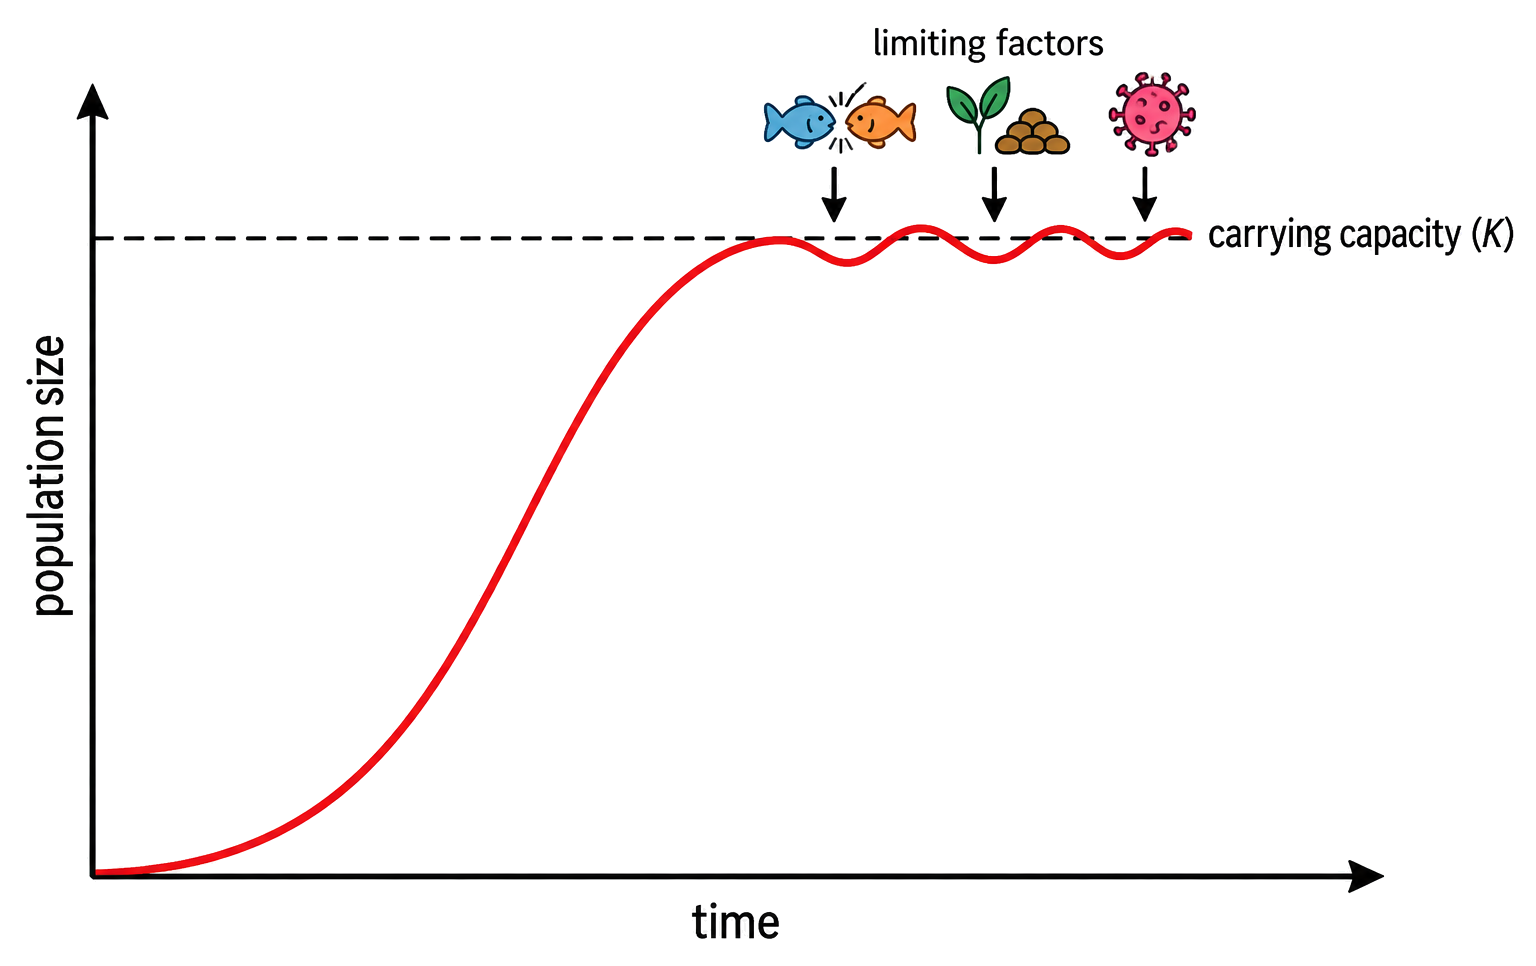
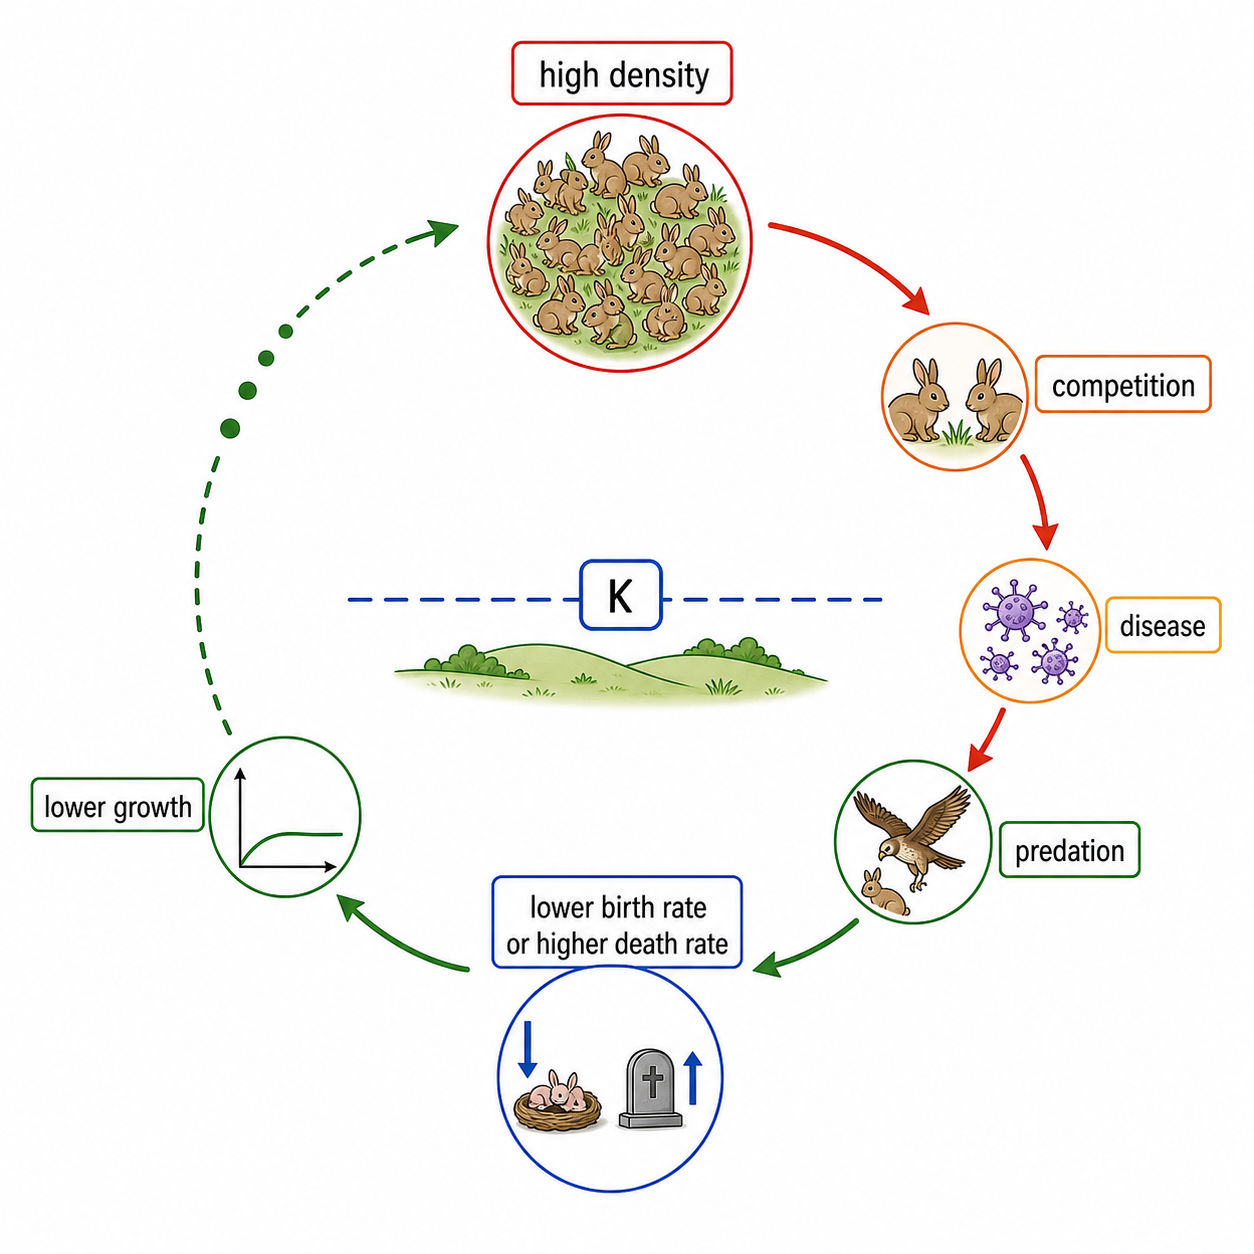
Population growth curves explains how ecological evidence links organisms, resources and interactions to population size, distribution or community structure in a habitat.

Syllabus
First assessment 2025
Objective
C4.1.7
Level
HL

Exam analysis

Chance of appearing8%of analysed past papers
Latest appearanceNovember 2023
Most common paperPaper3
Typical marks1–3

Common command terms

  • Draw
  • Identify
  • Label
  • Outline
  • State
  • Explain
  • Discuss
  • Suggest
  • Compare

Scoring notes

Common mistake
Confusing a population with a community or with all organisms in an ecosystem.

Recent exam appearances

November 2023Paper3 ["HL"] · TZ218(b)[ 2 ]C4.1.7—Population growth curves
November 2023Paper3 ["HL"] · TZ218(a)[ 2 ]C4.1.7—Population growth curves
May 2023Paper3 ["HL"] · TZ219(a)[ 3 ]C4.1.7—Population growth curves
May 2019Paper3 ["HL"] · TZ216(a)[ 3 ]C4.1.7—Population growth curves
May 2018Paper3 ["HL"] · TZ117(a)(i)[ 1 ]C4.1.7—Population growth curves
Practice this objective

Coverage 2012–2023 · Updated 16 Jul 2026

Concept essentials

  • Population growth curves must be linked to the correct ecological unit, method or species interaction.
  • The evidence for population growth curves depends on measurable abundance, distribution, survival or resource patterns.
  • Population growth curves is clearest when cause, ecological process and population outcome are kept distinct.
  • Field or graph evidence for population growth curves needs biological interpretation, not values alone.
ConceptIB Biology HL