EduNinja

A-Level CAIE Chemistry AS8.2 Temperature, rate and activation energyQuestion Bank

[Maximum number: 1]

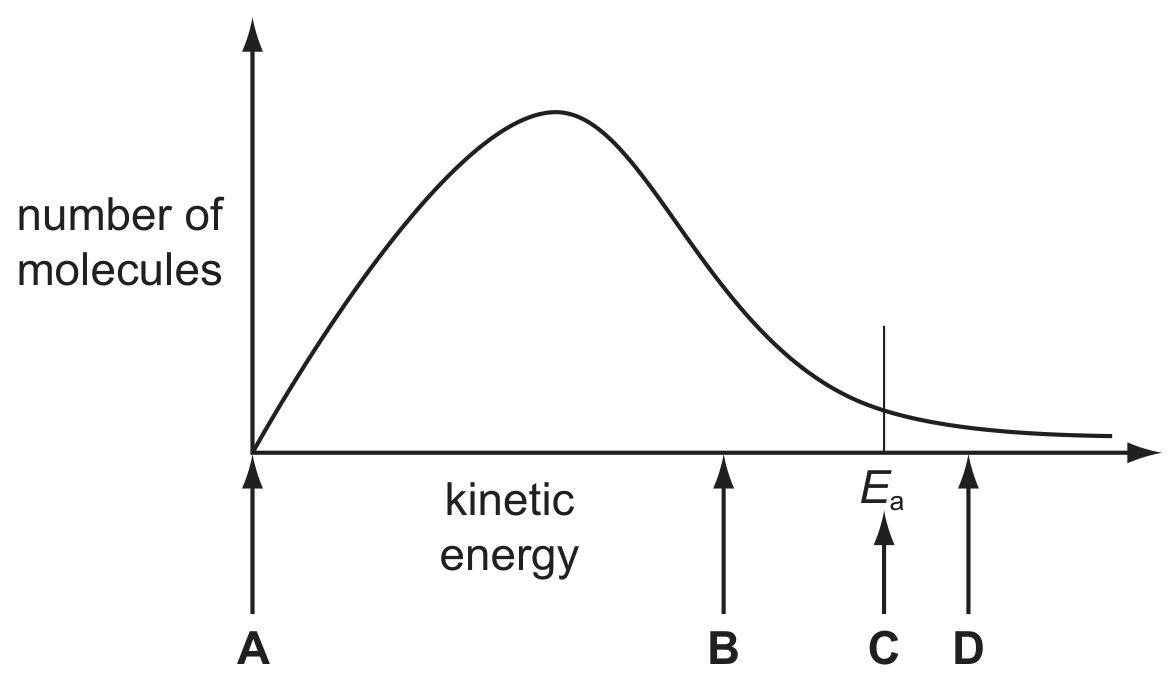
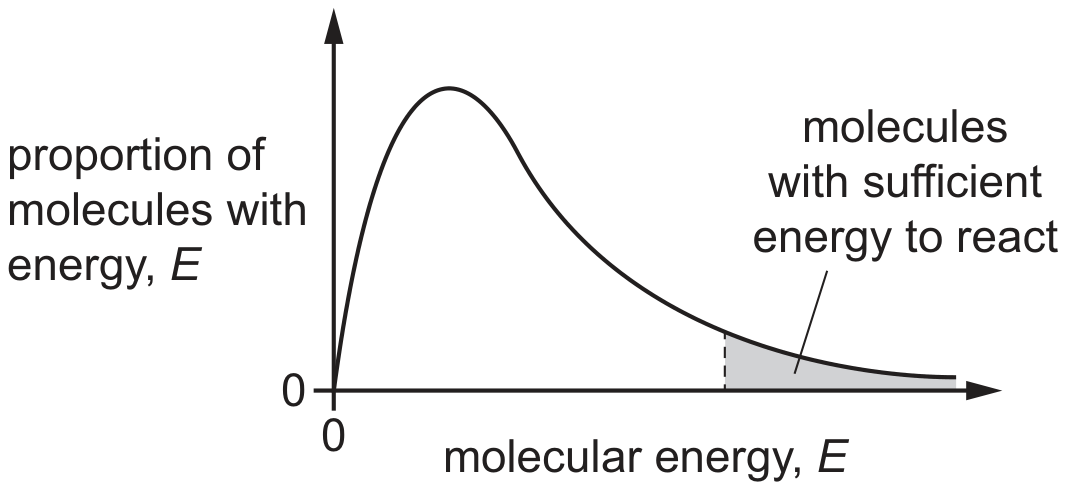
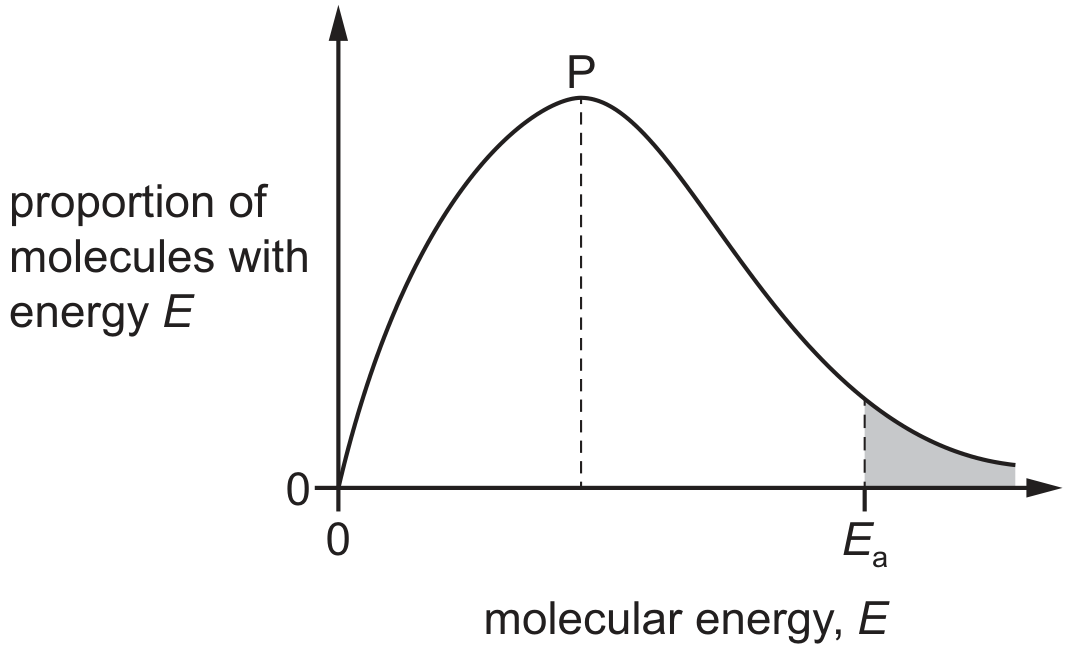
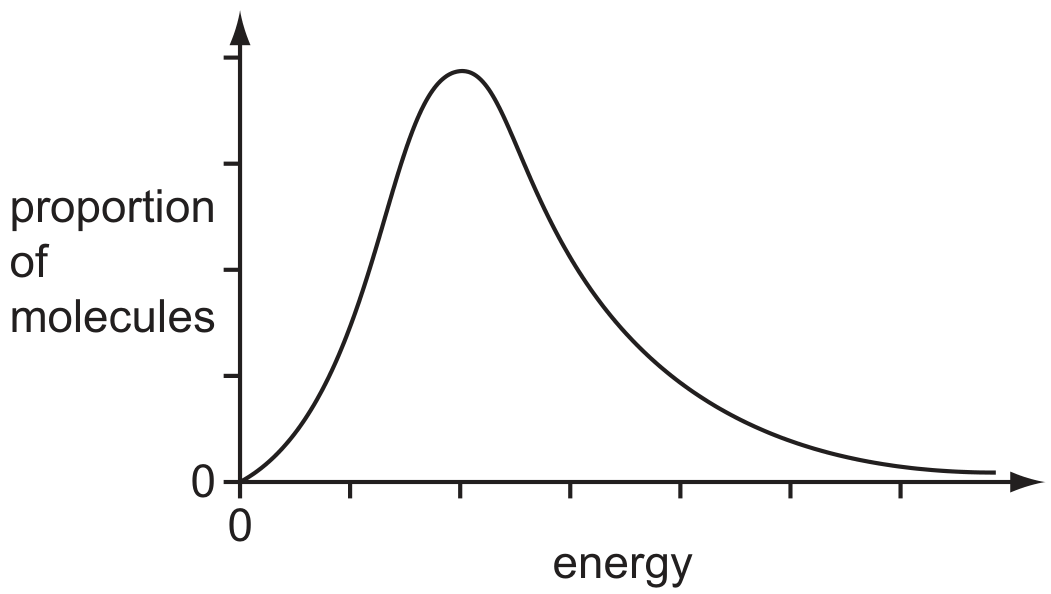
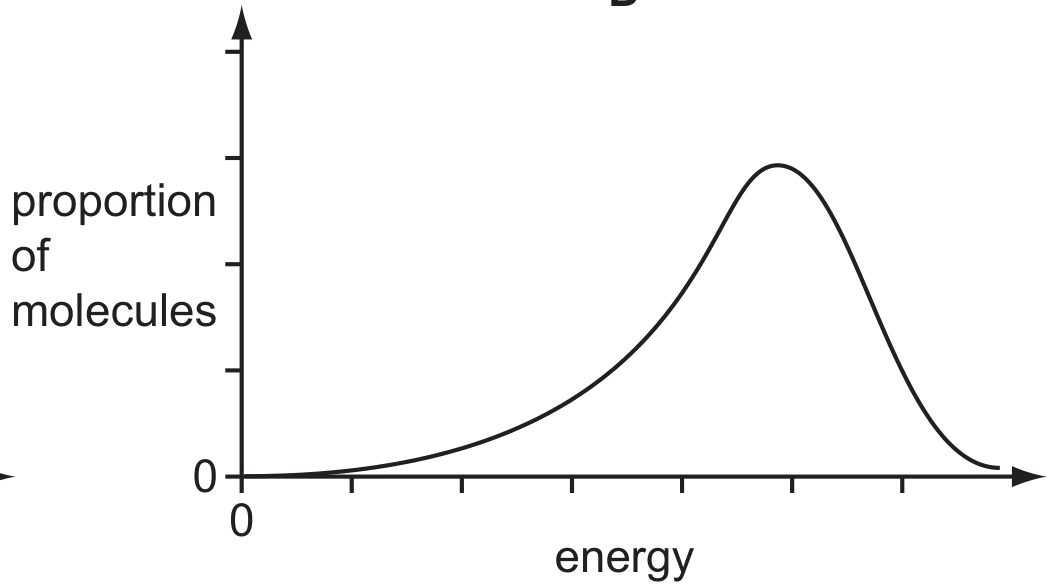
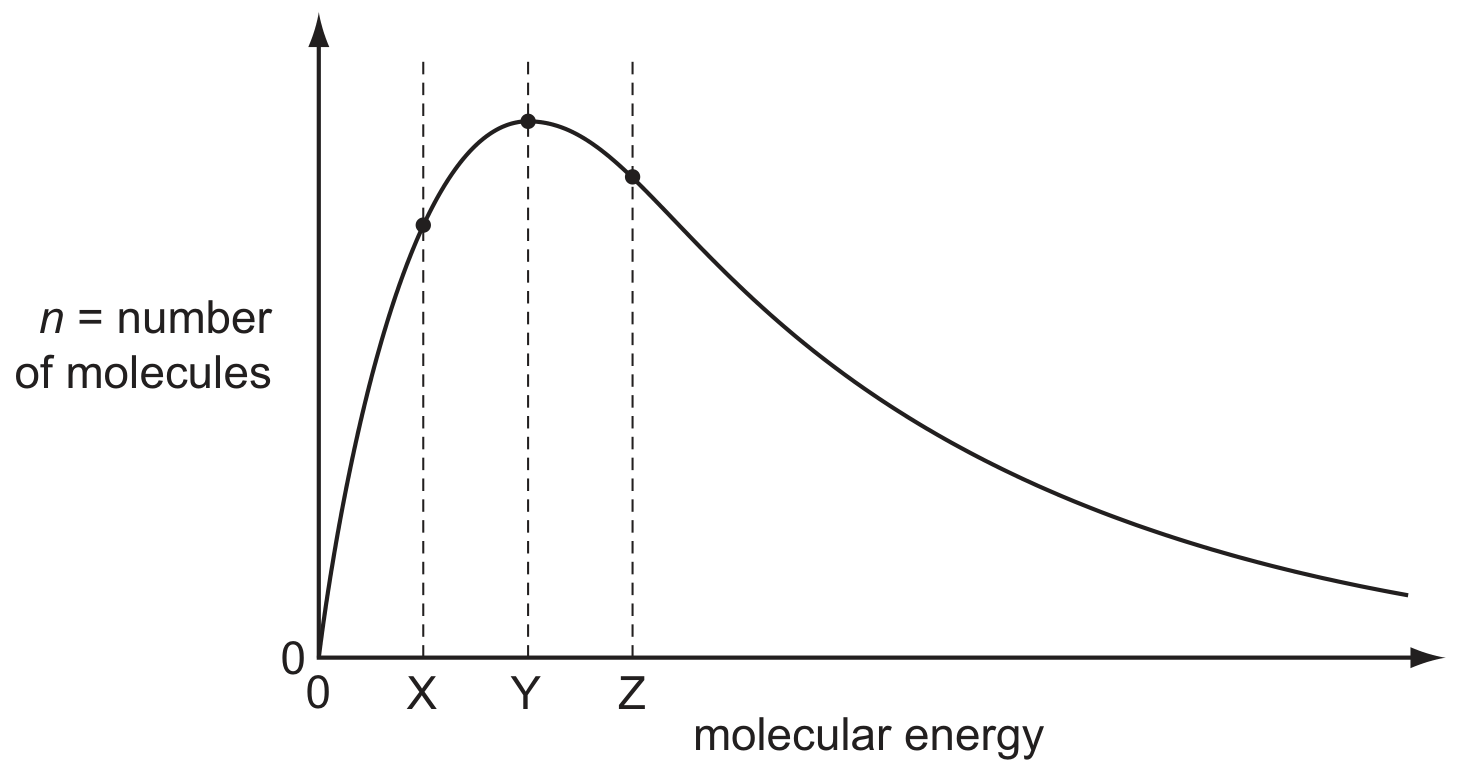
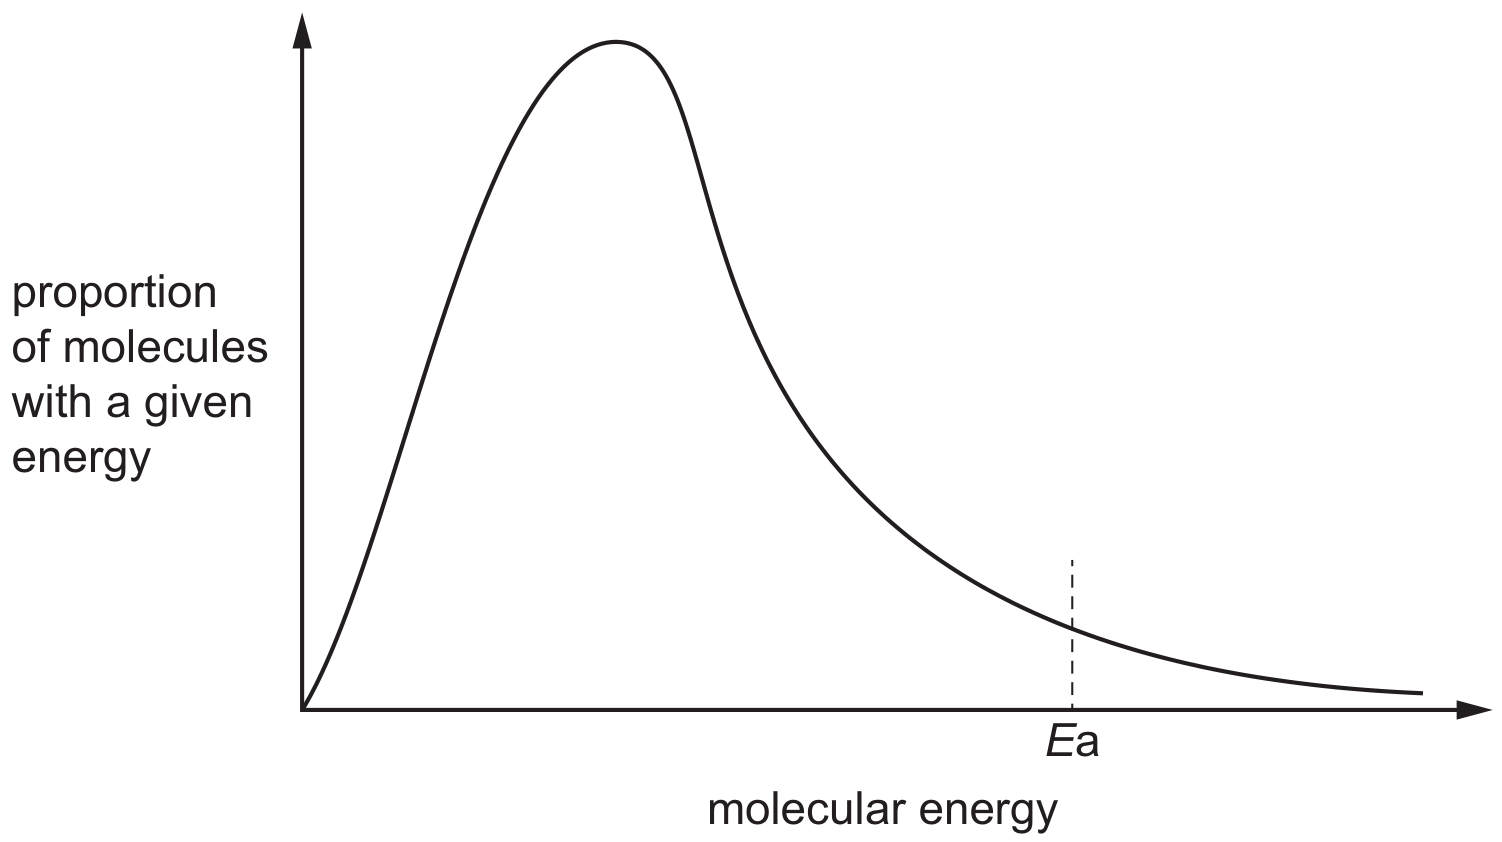
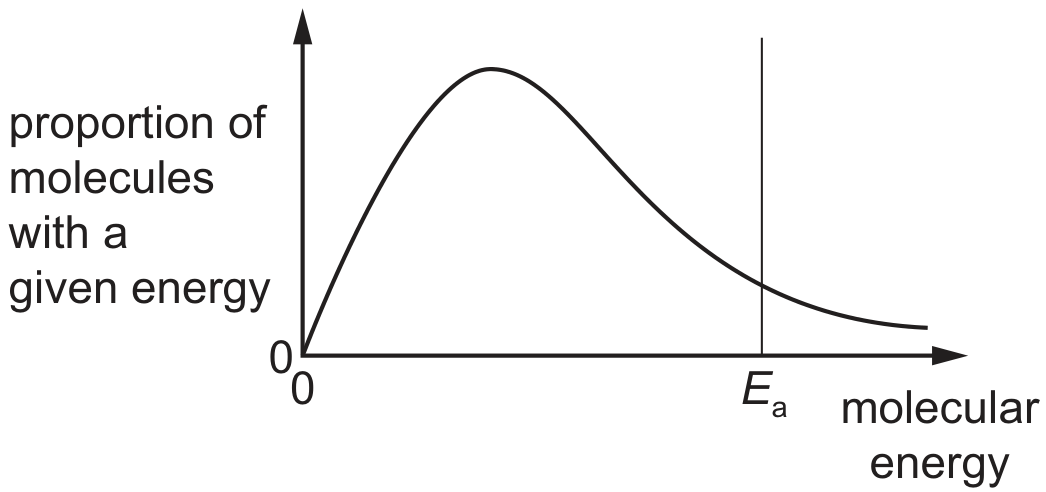
The diagram below represents, for a given temperature, the Boltzmann distribution of the kinetic energy of the molecules in a mixture of two gases that react slowly together.

The activation energy for the reaction, EaE_{\mathrm{a}}, is marked.
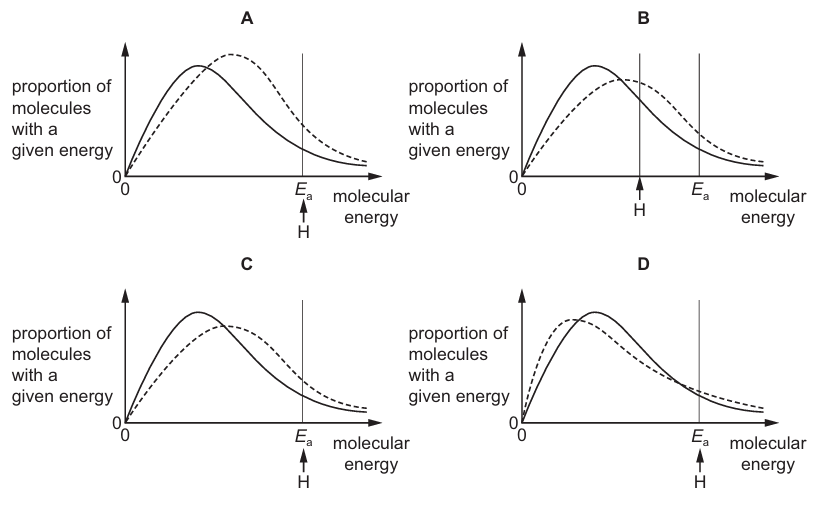
When the reaction is catalysed, the rate of reaction increases a little.
What will be the position of EaE_{\mathrm{a}} for the catalysed reaction?

Question image
[Maximum number: 1]

The Boltzmann distribution of molecular energies in a sample of aqueous hydrogen peroxide at room temperature is shown.

Question image

Which diagram shows the Boltzmann distribution of molecular energies of aqueous hydrogen peroxide maintained at room temperature when a catalyst, manganese(IV) oxide, is added?

A
Question image
B
Question image
C
Question image
D
Question image
[Maximum number: 1]

The diagram shows a Boltzmann distribution of the energies of gaseous molecules and the activation energies, EaE_{\mathrm{a}}, of a reaction with and without a catalyst.

Question image

Which statement about this distribution curve is correct?

A

If the temperature of the gas is increased, the maximum of the curve becomes higher.

B

If the temperature of the gas is increased, the maximum of the curve moves to the left.

C

The fraction of molecules that react in the presence of a catalyst is shown by

D

The fraction of molecules that react in the absence of a catalyst is shown by N

[Maximum number: 1]

The diagram shows the Boltzmann distribution of energies in a gas. The gas undergoes a reaction with an activation energy, EaE_{a}. The peak of the distribution is labelled P.

Question image

If the same reaction is carried out in the presence of a catalyst, which statement is correct?

A

The peak P is at a lower height and the position of EaE_{\mathrm{a}} moves to the left.

B

The peak P is at a lower height and the position of EaE_{\mathrm{a}} moves to the right.

C

The peak P remains at the same height and the position of EaE_{\mathrm{a}} moves to the left.

D

The peak P remains at the same height and the position of EaE_{\mathrm{a}} moves to the right.

[Maximum number: 1]

The molecular energy distribution curve represents the variation in energy of the molecules of a gas at room temperature.

Question image

Which curve applies for the same gas at a lower temperature?

A
Question image
B
Question image
C
Question image
D
Question image
[Maximum number: 1]

The Boltzmann distribution is shown for a sample of gas at an initial temperature, T1T_{1}.

Question image

The sample of gas was heated to temperature, T2T_{2}.
What is the correct distribution for the higher temperature, T2T_{2} ?

A
Question image
B
Question image
C
Question image
D
Question image
[Maximum number: 1]

The Boltzmann distribution for a gas at constant temperature is shown below.

Question image

If the temperature of the gas is reduced by 10C10^{\circ} \mathrm{C} the graph changes shape.
What happens to the values of n for the molecular energies X, Y and Z ?

X

Y

Z

higher

lower

higher

higher

lower

lower

lower

higher

lower

lower

lower

lower

[Maximum number: 5]

The rate of chemical reactions is affected by changes in temperature and pressure.

(a)
(i)

Draw a curve on the axes to show the Boltzmann distribution of energy of particles in a sample of gaseous krypton atoms at a given temperature.

Label the curve T1 and label the axes.

Question image
[ 2 ]
(ii)

On the diagram in (a)(i), draw a second curve to show the distribution of energies of the krypton atoms at a higher temperature.

Label the second curve T2.

[ 1 ]
(b)

Krypton reacts with fluorine in the presence of ultraviolet light to make krypton difluoride, KrF2( g)\mathrm{KrF}_{2}(\mathrm{~g}).

Kr( g)+F2( g)KrF2( g)\mathrm{Kr}(\mathrm{~g})+\mathrm{F}_{2}(\mathrm{~g}) \rightarrow \mathrm{KrF}_{2}(\mathrm{~g})

activation energy for the reaction, Ea=+385 kJ mol1E_{\mathrm{a}}=+385 \mathrm{~kJ} \mathrm{~mol}^{-1}
enthalpy change of formation of KrF2,ΔHf=+60.2 kJ mol1\mathrm{KrF}_{2}, \Delta H_{\mathrm{f}}=+60.2 \mathrm{~kJ} \mathrm{~mol}^{-1}

[ 2 ]
(i)

Explain, in terms of activation energy, EaE_{\mathrm{a}}, and the collision of particles, how an increase in temperature affects the rate of a chemical reaction.

[ 2 ]
[Maximum number: 5]

Ammonia, NH3\mathrm{NH}_{3}, is manufactured from nitrogen and hydrogen by the Haber process.

N2( g)+3H2( g)2NH3( g)ΔH=92 kJ mol1\mathrm{N}_{2}(\mathrm{~g})+3 \mathrm{H}_{2}(\mathrm{~g}) \rightleftharpoons 2 \mathrm{NH}_{3}(\mathrm{~g}) \quad \Delta H=-92 \mathrm{~kJ} \mathrm{~mol}^{-1}
(a)

The Haber process is usually carried out at a temperature of approximately 400C400^{\circ} \mathrm{C} in the presence of a catalyst. Changing the temperature affects both the rate of production of ammonia and the yield of ammonia.

The Boltzmann distribution for a mixture of nitrogen and hydrogen at 400C400^{\circ} \mathrm{C} is shown. Ea represents the activation energy for the reaction.

Question image
[ 5 ]
(i)

Using the same axes, sketch a second curve to indicate the Boltzmann distribution at a higher temperature.

[ 2 ]
(ii)

With reference to the Boltzmann distribution, state and explain the effect of increasing temperature on the rate of production of ammonia.

[ 3 ]
[Maximum number: 1]

The diagram represents, for a given temperature, the Boltzmann distribution of the kinetic energies of the molecules in a mixture of two gases that react together. The activation energy for the reaction, EaE_{\mathrm{a}}, is marked.

Question image

The dotted curves below show the Boltzmann distribution for the same reaction at a higher temperature. On these diagrams, H represents the activation energy at the higher temperature.

Which diagram is correct?

D

D

0 selected