IB Physics SL Mathematics
Review IB Physics mathematics through SI units, dimensional checks, graph gradients and areas, uncertainty propagation and significant-figure decisions.
- Syllabus
- First assessment 2025
- Topic
- S1.3
- Level
- SL
Review IB Physics mathematics through SI units, dimensional checks, graph gradients and areas, uncertainty propagation and significant-figure decisions.
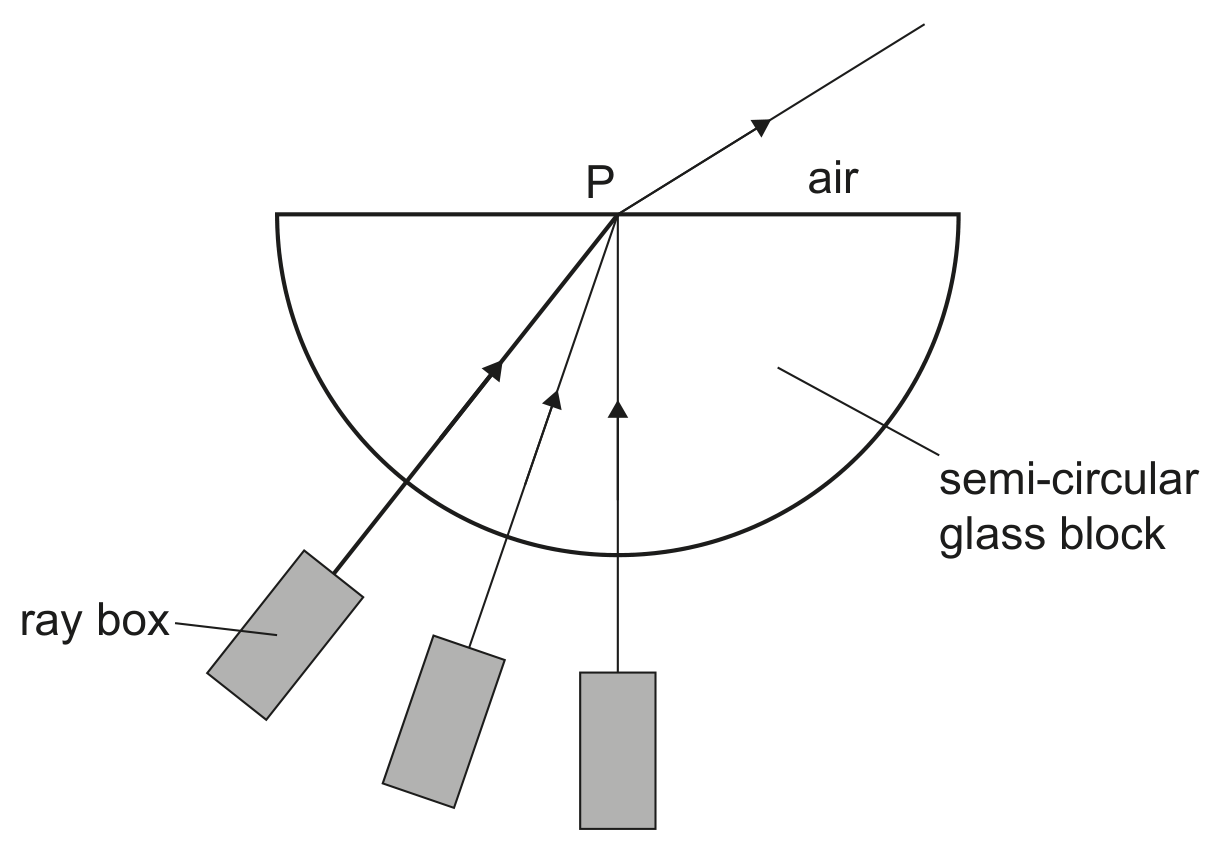
A group of students is investigating refraction in a semi-circular glass block.
Light from a ray box enters the curved side of the block. The light passes through the block and leaves, refracted, at P .
The students vary the position of the ray box to obtain data to determine the refractive index of the glass. They use a protractor to collect values for the angles of incidence and refraction at P and record them on a table.
Complete the table.
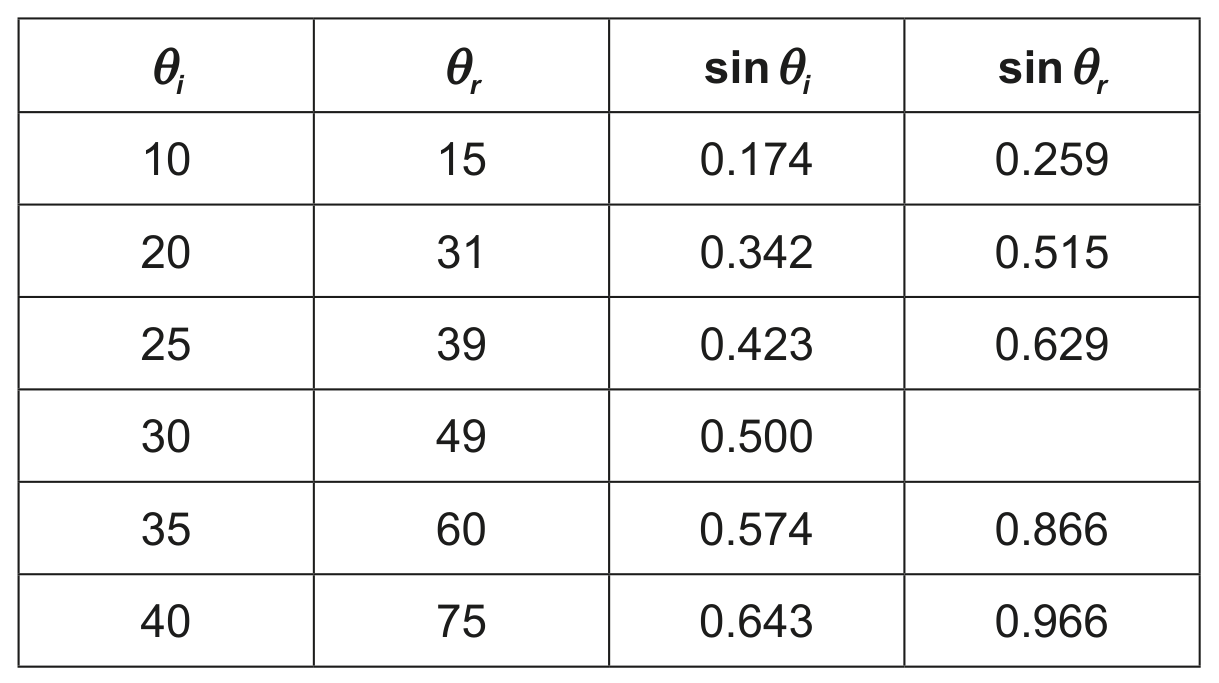
They plot a graph of the variation with the sine of of the sine of .
They add uncertainty bars for for the first and last data point and draw the best-fit line.
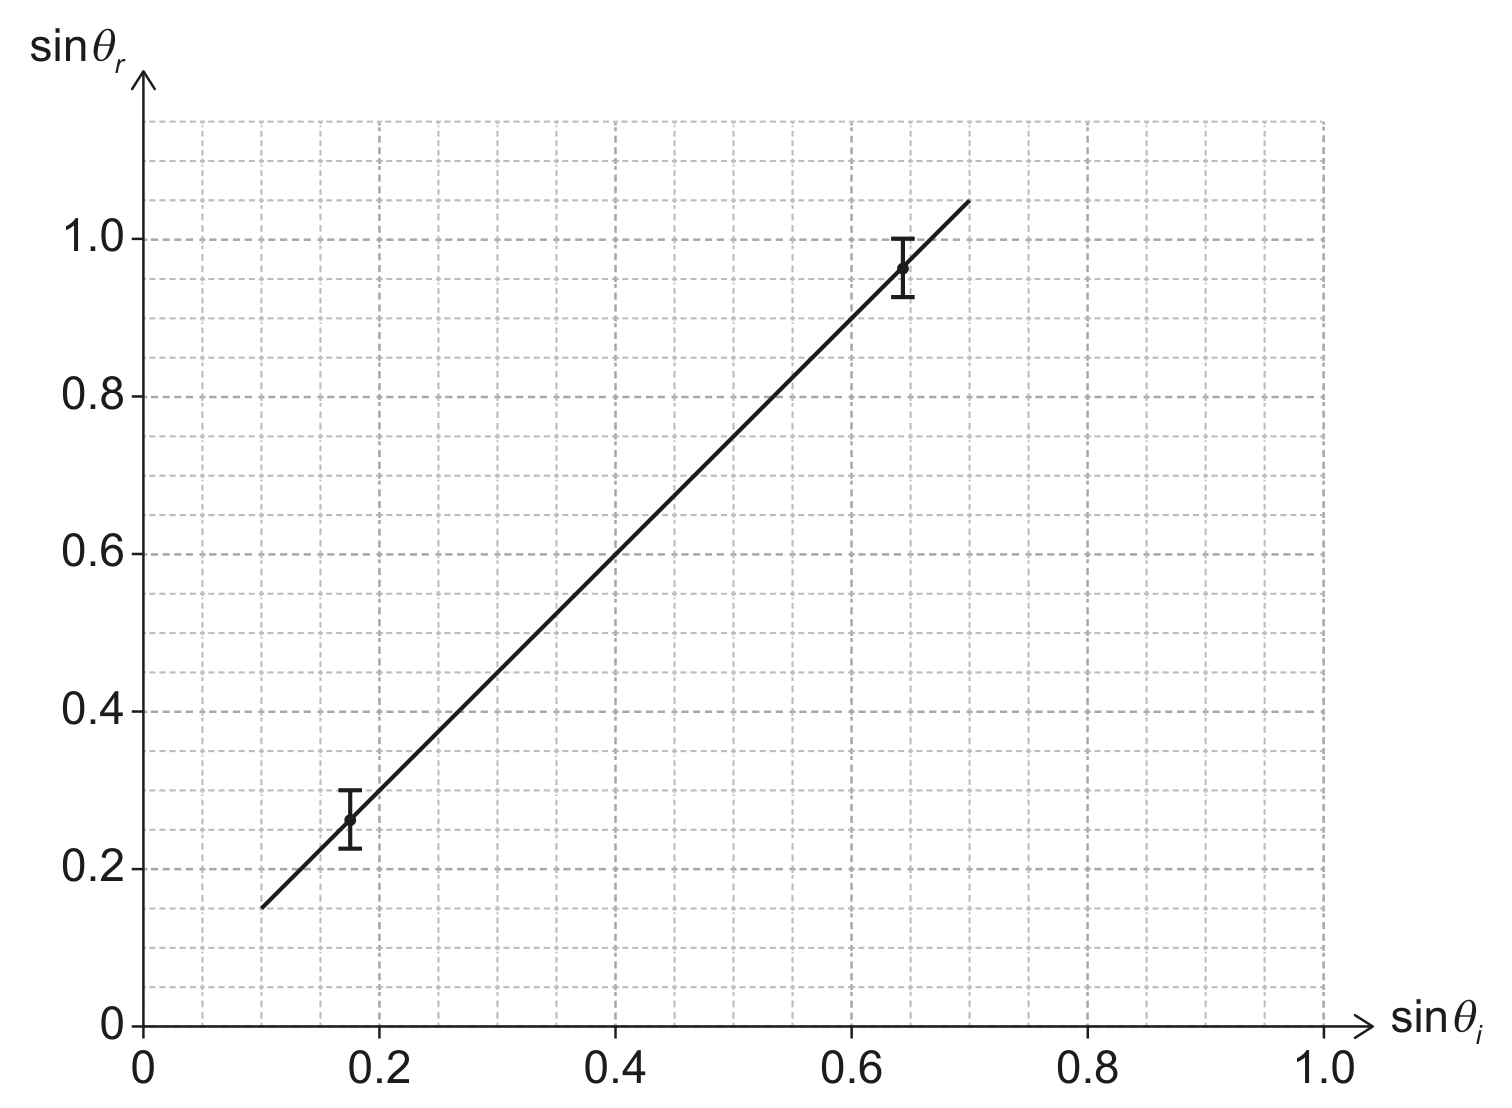
Determine the gradient of the students' best-fit line.
Draw on the students' graph the line of maximum gradient.
A glider is an aircraft with no engine. To be launched, a glider is uniformly accelerated from rest by a cable pulled by a motor that exerts a horizontal force on the glider throughout the launch.
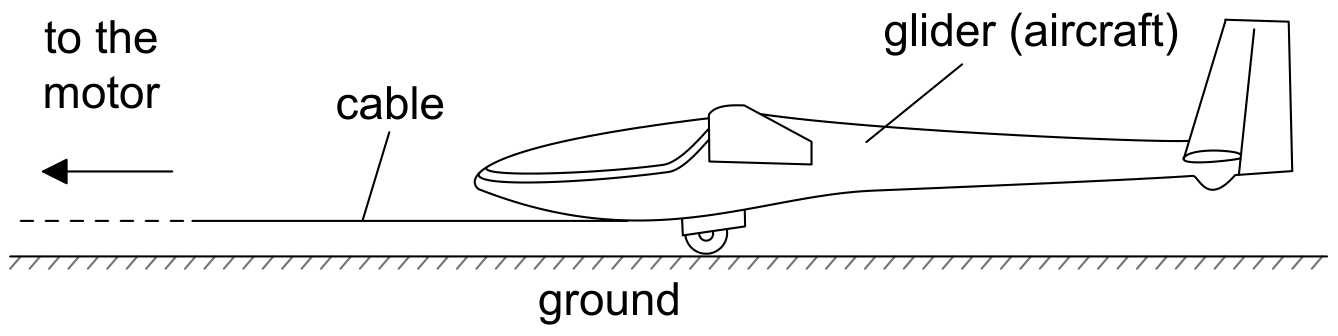
At a particular instant in the flight the glider is losing 1.00 m of vertical height for every 6.00 m that it goes forward horizontally. At this instant, the horizontal speed of the glider is . Calculate the velocity of the glider. Give your answer to an appropriate number of significant figures.
A group of students uses pressurized air to move a piston that forces a nail into a block of wood. A gauge is used to measure the pressure P of compressed air above atmospheric pressure. The nail enters the wood perpendicular to its surface.
The students use a ruler to measure the length of the nail which remains above the surface of the wood as shown. The depth of the nail inside the wood is d. All necessary length measurements are recorded using a ruler with uncertainty .
The students systematically increase the pressure and calculate d.
State the absolute uncertainty of d.
The students suggest the following relationship between d and P :
where k is a constant.
To verify the relationship, the variation of d with is plotted.
One data point is missing.
The percentage uncertainty in P is . Determine the uncertainty for when and draw the uncertainty bar for this data point on the graph.
The SI units of k can be expressed as . Determine the values of x and y.