IB Physics SL S1.3.5 Graphing
Practise constructing and linearising graphs, representing uncertainty and extracting gradients, intercepts, extrema or areas to determine physical quantities.
- Syllabus
- First assessment 2025
- Objective
- S1.3.5
- Level
- SL
Practise constructing and linearising graphs, representing uncertainty and extracting gradients, intercepts, extrema or areas to determine physical quantities.
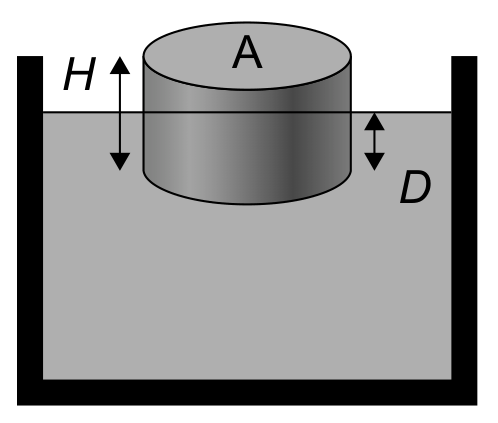
A cylindrical cork of height H and cross-sectional area A is floating stationary in water. Its depth below the water surface is D.
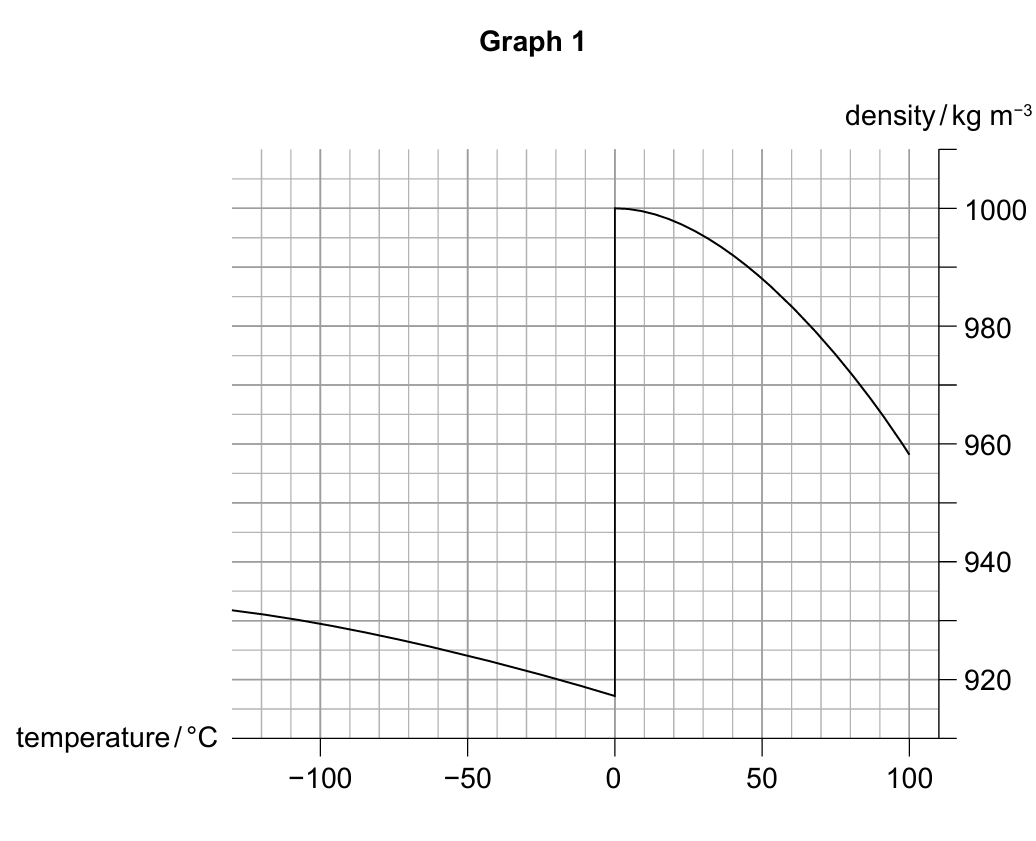
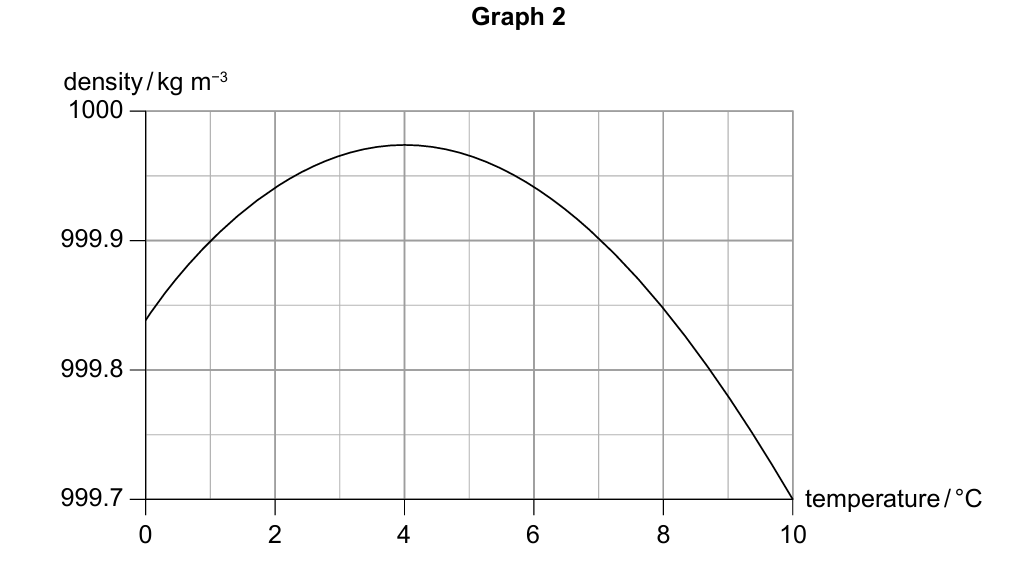
Identify the temperature at which water has its maximum density.