EduNinja

IGCSE Math B10 Statistics and probabilityTopic Practice

10 Statistics and probability

Edexcel IGCSE Math B 10 Statistics and probability question practice helps you revise this syllabus point with the course map in view. Use this page to focus on one topic, check the style of questions available, and connect each attempt back to the knowledge area it is testing.

EduNinja keeps Math B practice aligned to Edexcel, so you can move from topic review into exam-style question bank work without losing the syllabus structure. Start with a small set, mark the weak steps, then return to nearby topic links when a definition, graph, calculation, or explanation needs repair.

Question 1

[Maximum number: 2]

Bananas, sugar cane and fish are the exports of a small country.
In 2017 the total value of its exports was $ 3690000
A pie chart was drawn for the values of the different exports in 2017 and the angle in the pie chart for bananas was 48.648.6^{\circ}

Calculate the value of the bananas exported in 2017
$
Question 1

[Maximum number: 6]
Table

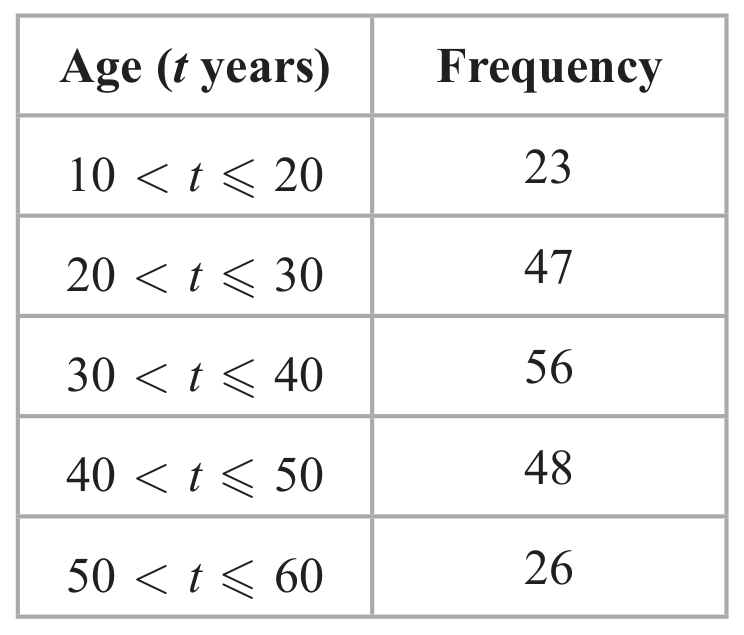
Malcolm is investigating the ages of the 200 members of a theatre company.
The table below gives information about the age group of each member of the company.

Malcolm is going to draw a pie chart for this information.

Question 1(a)

(a)

Calculate the size, in degrees, of the angle of the sector in the pie chart for those members of the company whose age group is 40<t5040<t \leqslant 50

[ 2 ]

Question 1(b)

(b)

Calculate an estimate for the mean age, to the nearest year, of the members of the theatre company.

[ 4 ]

Question 1

[Maximum number: 6]

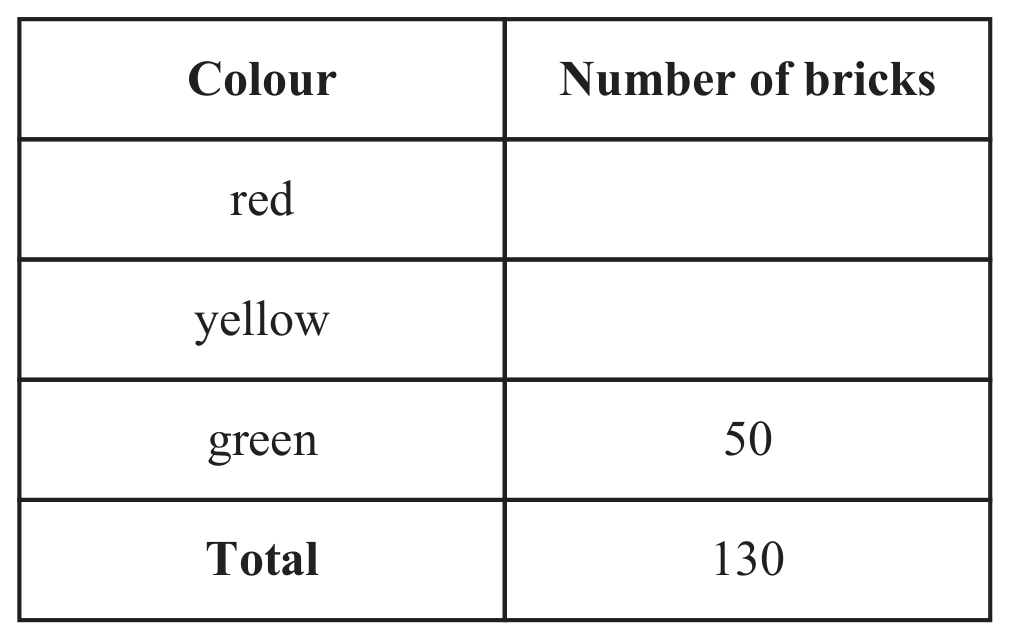
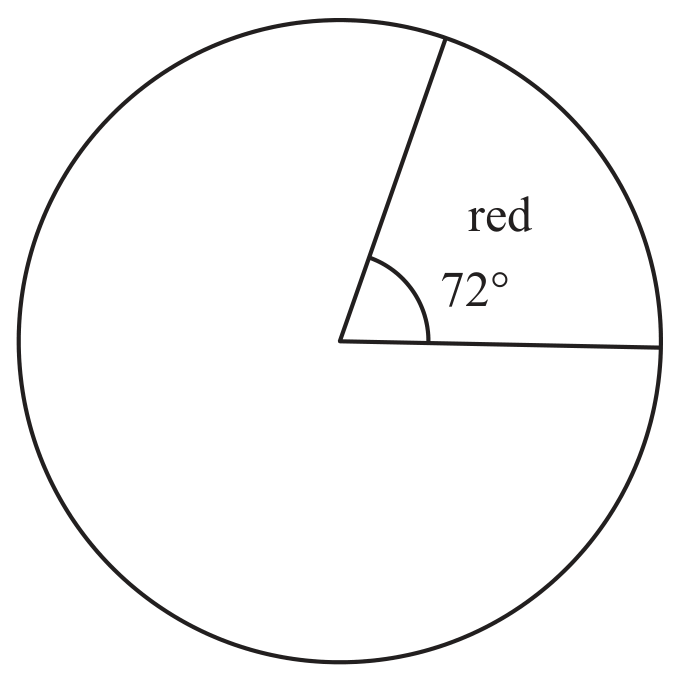
A bag contains red bricks, yellow bricks and green bricks only.
The incomplete table and an incomplete pie chart give information about the colours of the bricks in the bag.

Table
Question image
Question image

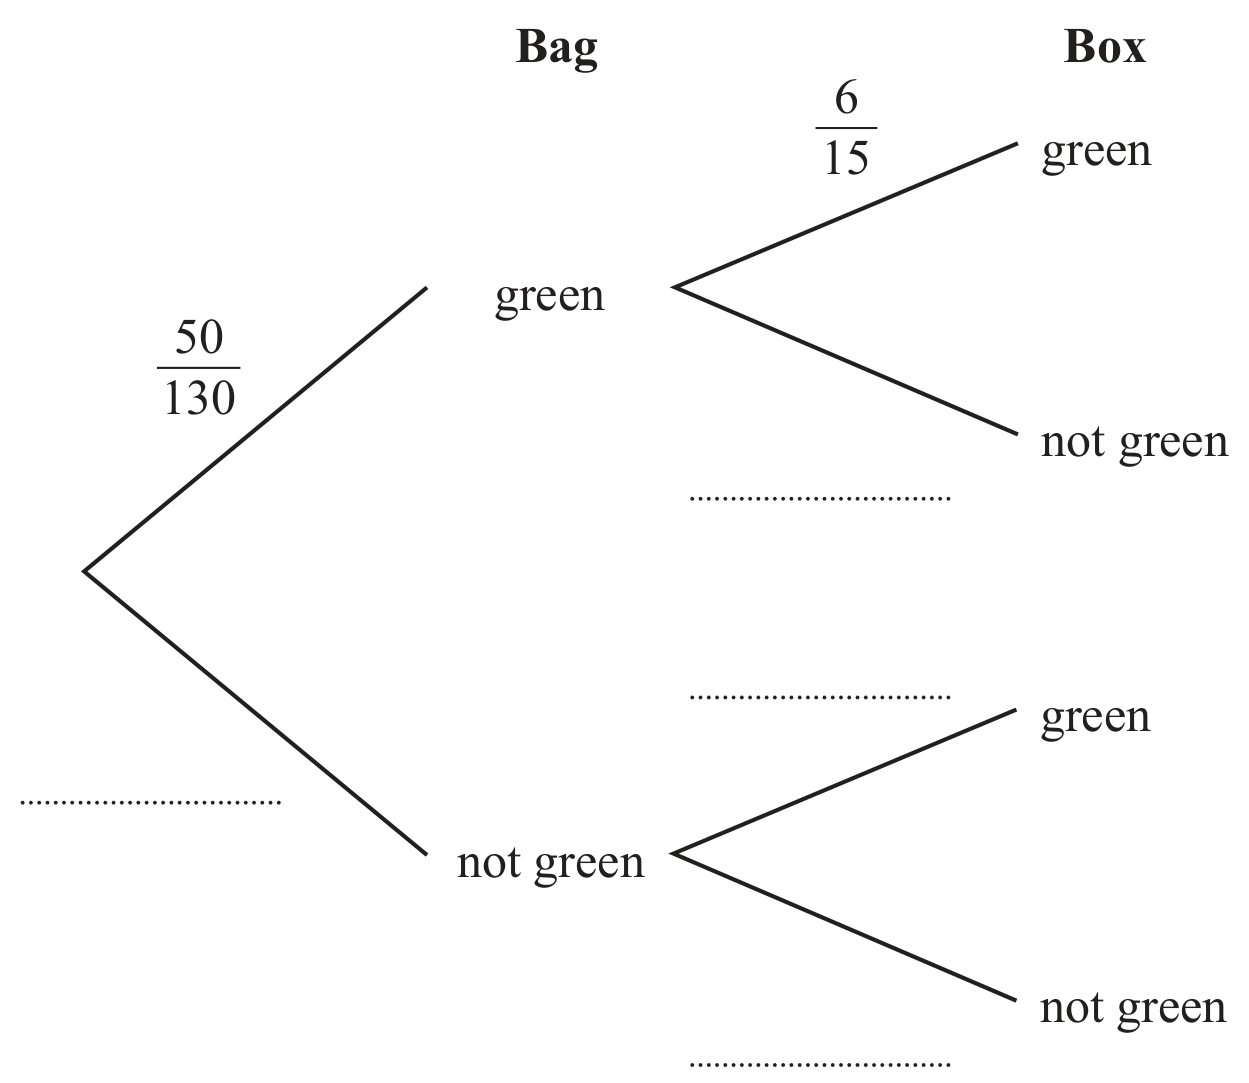
A box contains 9 red bricks and 6 green bricks only.
Asha takes a brick from the bag and a brick from the box.

Question 1(a)

(a)

Find the number of red bricks.

[ 2 ]

Question 1(b)

(b)

Complete the tree diagram.

[ 2 ]

Question 1(c)

(c)

Calculate the probability that exactly one of the bricks is green.

[ 2 ]

Question 1

Question image

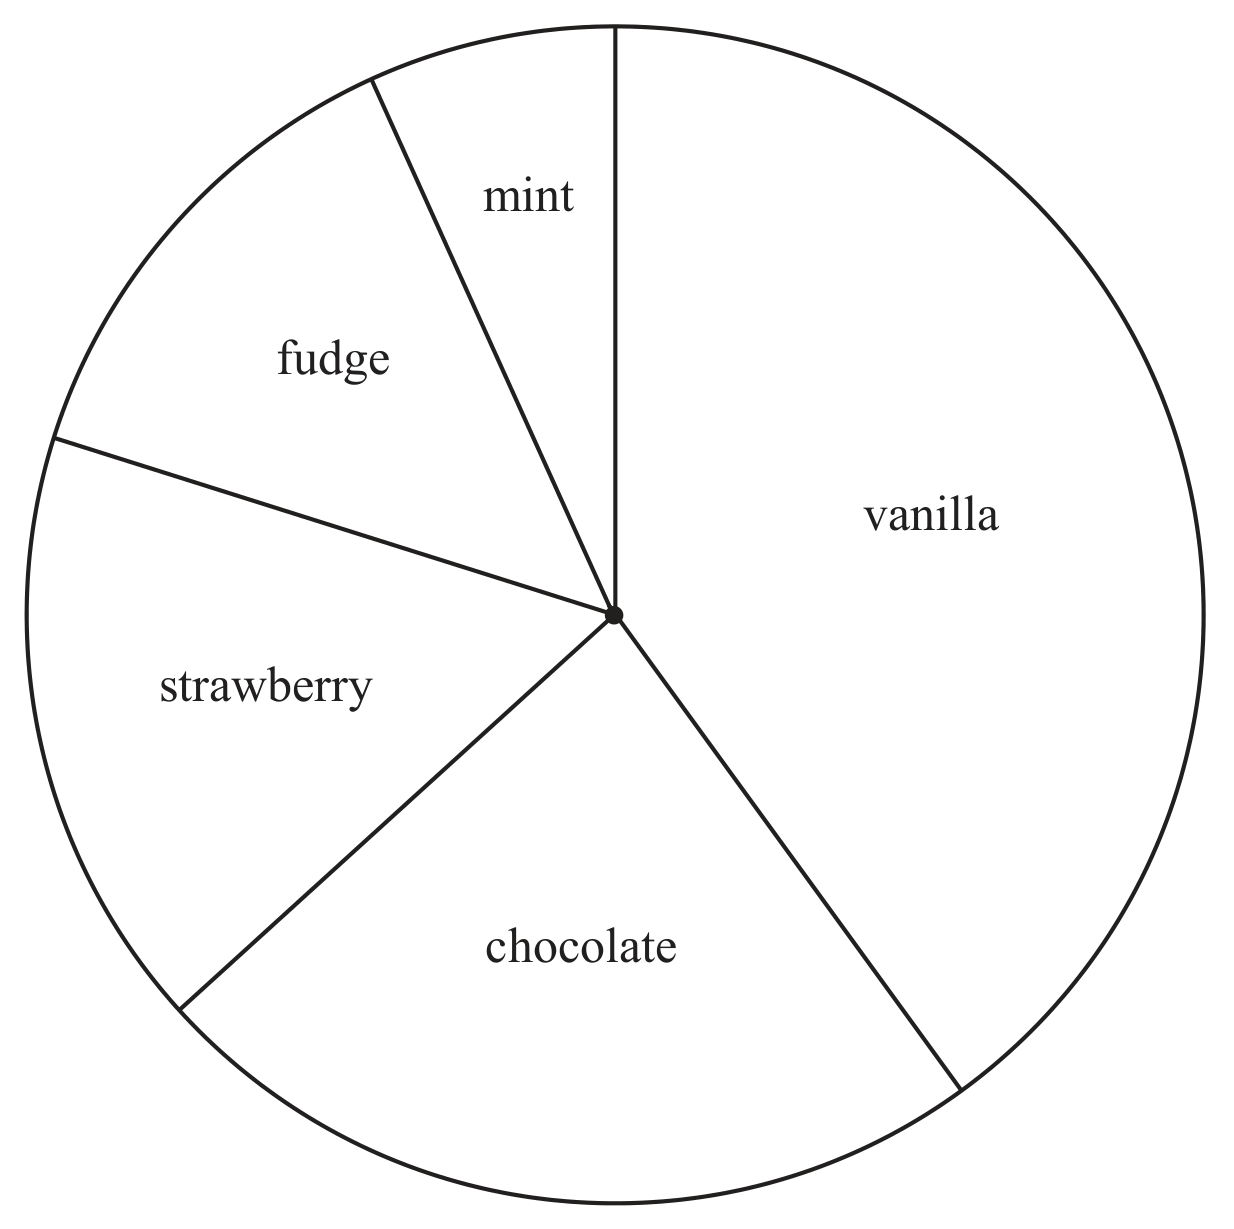
Charles asks each of the students in his class which flavour of ice cream they prefer.
There are 30 students in his class.
He uses the information he collects to draw this accurate pie chart.
Find how many of the 30 students prefer chocolate ice cream.

Question 2

On Monday, 150 students were asked how they got to school that morning.
Yuen is going to draw a pie chart for the results.
Given that 27 students said they got to school by bus on Monday, calculate the size, in degrees, of the angle of the sector in the pie chart for bus.

Question 2

Here are the numbers of items that the last 9 people who visited a shop bought.

61132024141120\begin{array}{lllllllll} 6 & 1 & 13 & 20 & 2 & 4 & 14 & 11 & 20 \end{array}

Find the median of these numbers of items.

Question 3

Here are four numbers written in order of size.
w,7,x,24w,\quad 7,\quad x,\quad 24
The range of the four numbers is 18.
The median of the four numbers is 10.
Find the value of w and the value of x.

Question 5

John is going to draw a bar chart for the number of red apples and the number of green apples on the trees in his garden.

The height of the bar in the bar chart for the 28 green apples is 7 cm .
There are 50 red apples on the trees in John's garden.
Calculate the height of the bar in the bar chart for the red apples.

Question 4

Each time Arhan plays a game of chess, the probability that he does not win is 0.64 Arhan plays 75 games of chess.

Calculate an estimate for the number of games he wins.

Question 3(d)

[Maximum number: 2]
Question image

E={2,3,4,5,6,7,8,9,10}\mathscr E=\{2,3,4,5,6,7,8,9,10\}P={prime numbers}P=\{\text{prime numbers}\}E={even numbers}E=\{\text{even numbers}\}F={factors of 36}F=\{\text{factors of }36\}

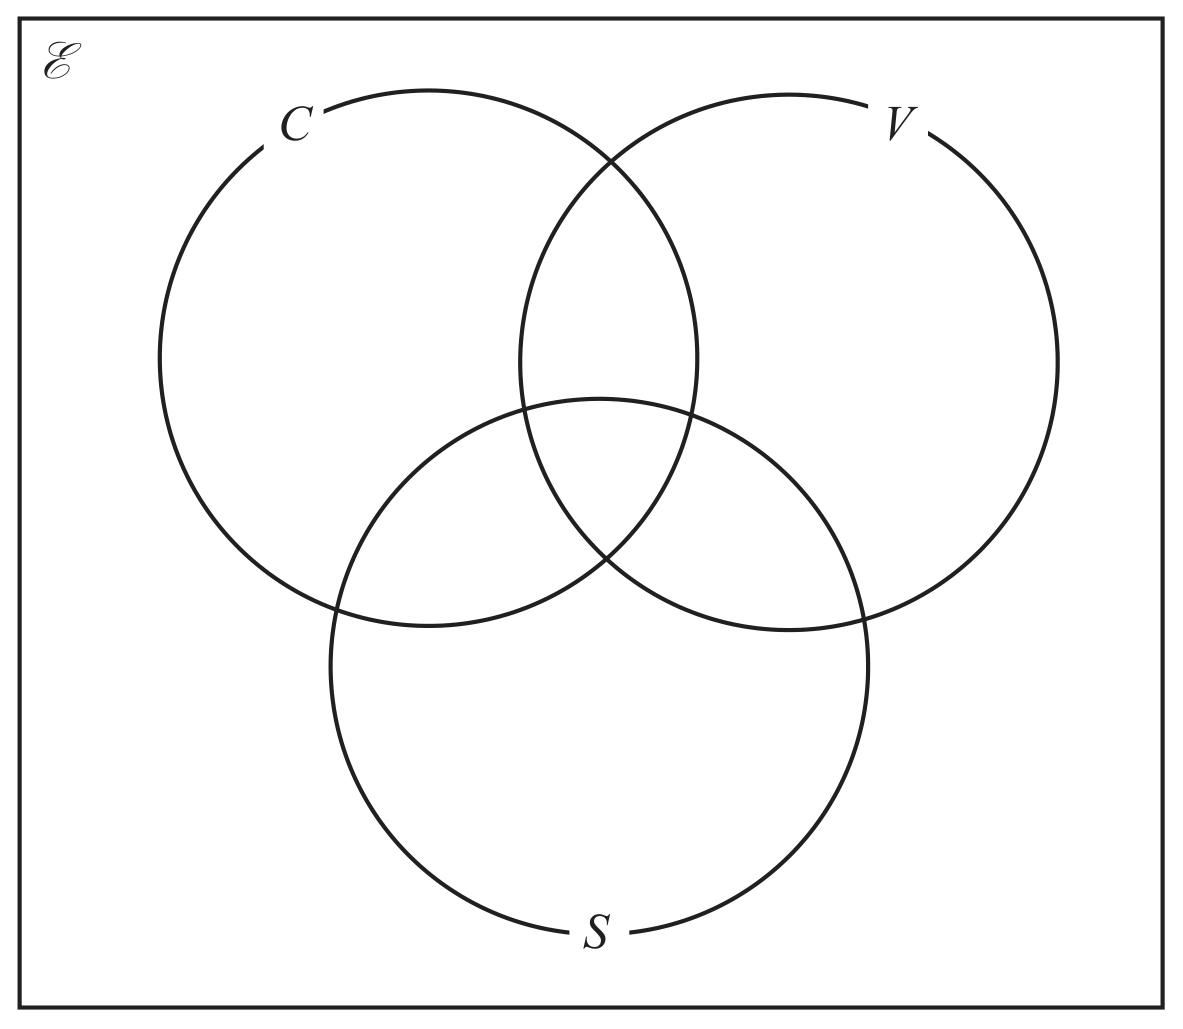
70 children were asked which flavours of ice cream they like from chocolate (C), vanilla (V) and strawberry (S).
5 children like chocolate and vanilla and strawberry.
15 like strawberry only.
12 like chocolate only.
8 like none of the flavours.
6 like strawberry and vanilla.
11 like chocolate and vanilla.
21 like strawberry.
35 like vanilla.

One of the 70 children is chosen at random.
Given that this child likes vanilla, find the probability that this child also likes chocolate.

0 selected