EduNinja

IGCSE Math B10.E Probability languageTopic Practice

10.E Probability language

Understand the language and basic concepts of probability To include the probability scale, sample spaces, relative frequency, probabilities and complements

Question 3

[Maximum number: 2]
Question image

A college has 220 students.
All students study at least one of Biology, Chemistry or Drama.

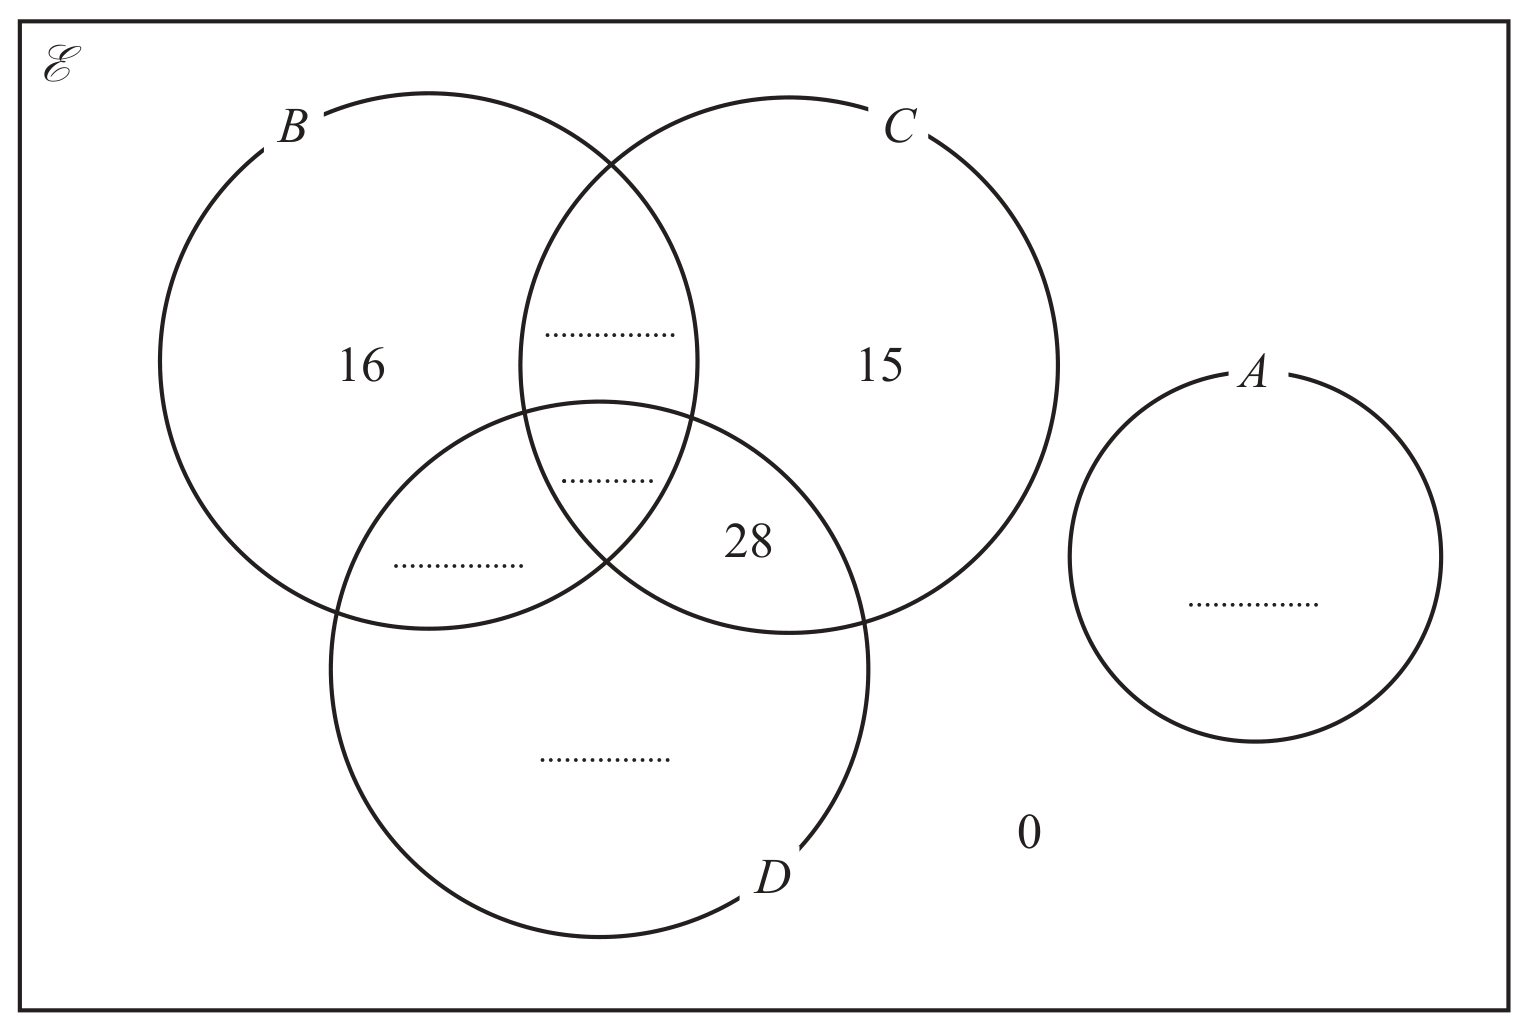
n(A)=58\mathrm n(A)=58, n(BCD)=x\mathrm n(B\cap C\cap D)=x, n(BD)=48\mathrm n(B\cap D)=48, n(BCD)=35\mathrm n(B\cap C\cap D')=35, and n((BC)D)=20\mathrm n((B\cup C)'\cap D)=20.

The incomplete Venn diagram shows some of this information.

Question 3(c)

(a)

One of the 220 students is chosen at random.
Write down the probability that the student studies Biology but does not study Chemistry or Drama.

[ 1 ]

Question 3(d)

(b)

One of the 220 students is chosen at random.
Write down the probability that the student studies Chemistry but does not study Biology.

[ 1 ]
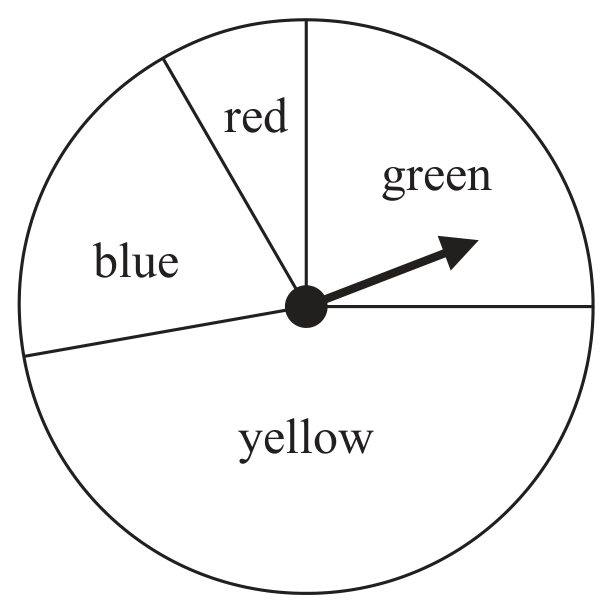
Question 11

The diagram shows a biased spinner with four colours blue, red, green and yellow.
When the spinner is spun once
- the probability it lands on blue is twice the probability it lands on red
- the probability it lands on yellow is three times the probability it lands on blue
- the probability it lands on green is 0.25

Find the probability the spinner lands on yellow.

Diagram NOT accurately drawn

Diagram NOT accurately drawn

Question 10

[Maximum number: 3]

Jason has a fair 6 -sided dice, with faces numbered 1, 2, 3, 4, 5 and 6 He rolls the dice two times and records the number that the dice lands on each time.

Jason's score is the sum of the two numbers that he records.
Find the probability that Jason's score is 6

Question 10(a)

[Maximum number: 1]

The probability that Charlie arrives late to school is 0.35.

Write down the probability that Charlie does not arrive late to school.

Question 5

[Maximum number: 2]
Figure 1

Figure 1

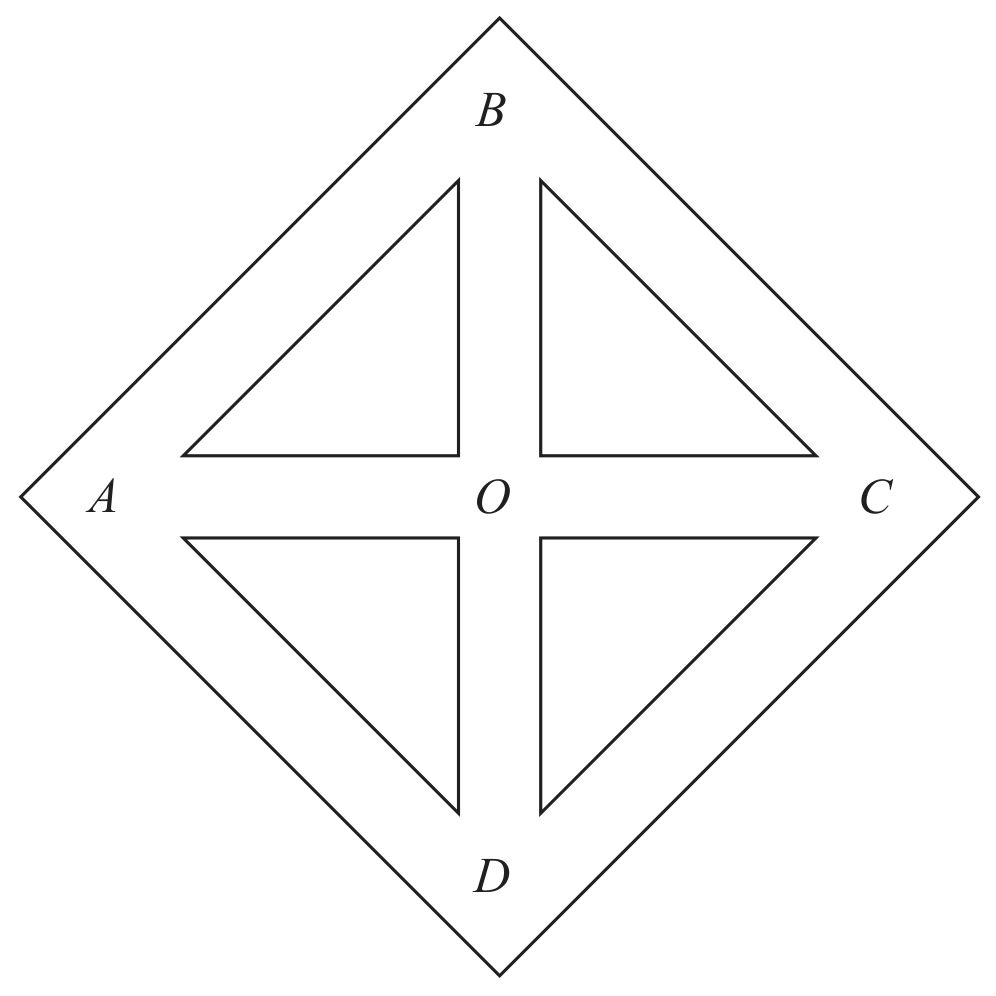
Figure 1 shows a maze for a mouse. Inside the maze there are 5 junctions, labelled A, B, C, D and O. When in the maze, the mouse can move in the maze by going directly from junction to junction through a tunnel joining the two junctions, as shown in Figure 1.

When the mouse is at one of the junctions, the mouse leaves the junction by choosing a tunnel at random. The mouse is equally likely to choose any tunnel leading from that junction, including the tunnel the mouse used to enter that junction.

Once the mouse has started to move along a tunnel, the mouse cannot turn around inside the tunnel and go back along the tunnel.

The mouse is placed in the maze at junction A.

Question 5(a)

(a)

Write down the probability that the mouse will move directly to junction O.

[ 1 ]

Question 5(b)

(b)

The mouse is at junction O.

Write down the probability that the mouse will move directly to junction C.

[ 1 ]

Question 19(a)

[Maximum number: 1]

A biased dice has six faces numbered 2,4,6,8,10 and 12.
The table below shows information about the probability that, when the dice is thrown once, it will land on each of the numbers.

Table

The dice is thrown once.

Calculate the probability that the number the dice lands on is less than 7.

Question 6(c)

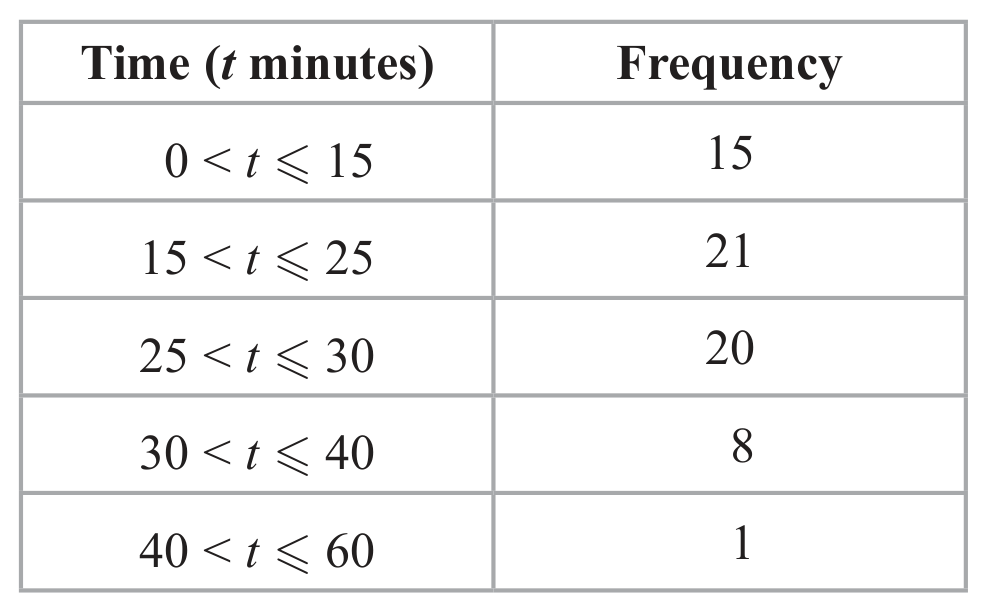
The table gives information about the time, in minutes, spent in a supermarket by 65 customers.

Table

One of the 65 customers is chosen at random.
Calculate the probability that the customer spent more than 30 minutes in the supermarket.

Question 6(a)

[Maximum number: 1]

A spinner has three sections: red, blue and yellow.

The probability that the spinner lands on red is 0.6.
The probability that the spinner lands on blue is equal to the probability that the spinner lands on yellow.

A bag contains red, green and blue counters in the ratio 2:1:1.
There are n counters in the bag.

Find the probability that the spinner does not land on red.

Question 14(b)

[Maximum number: 3]

A bag contains red pens, blue pens, black pens, green pens and purple pens.
A pen is selected at random from the bag.
The table gives information about the probability of the colour of the pen that is selected.

Table

Tisam draws a pie chart to show the information about the number of pens of each colour in the bag. The size of the angle of the sector representing green pens is 50.450.4^\circ.

Calculate the value of y.

Question 7(c)

[Maximum number: 4]
Table

The table gives information about the times taken, in minutes, by 160 runners to complete a race.

Question image

One of these runners is to be chosen at random.

Calculate an estimate of the probability that this runner took between 18 minutes and 34 minutes to complete the race.

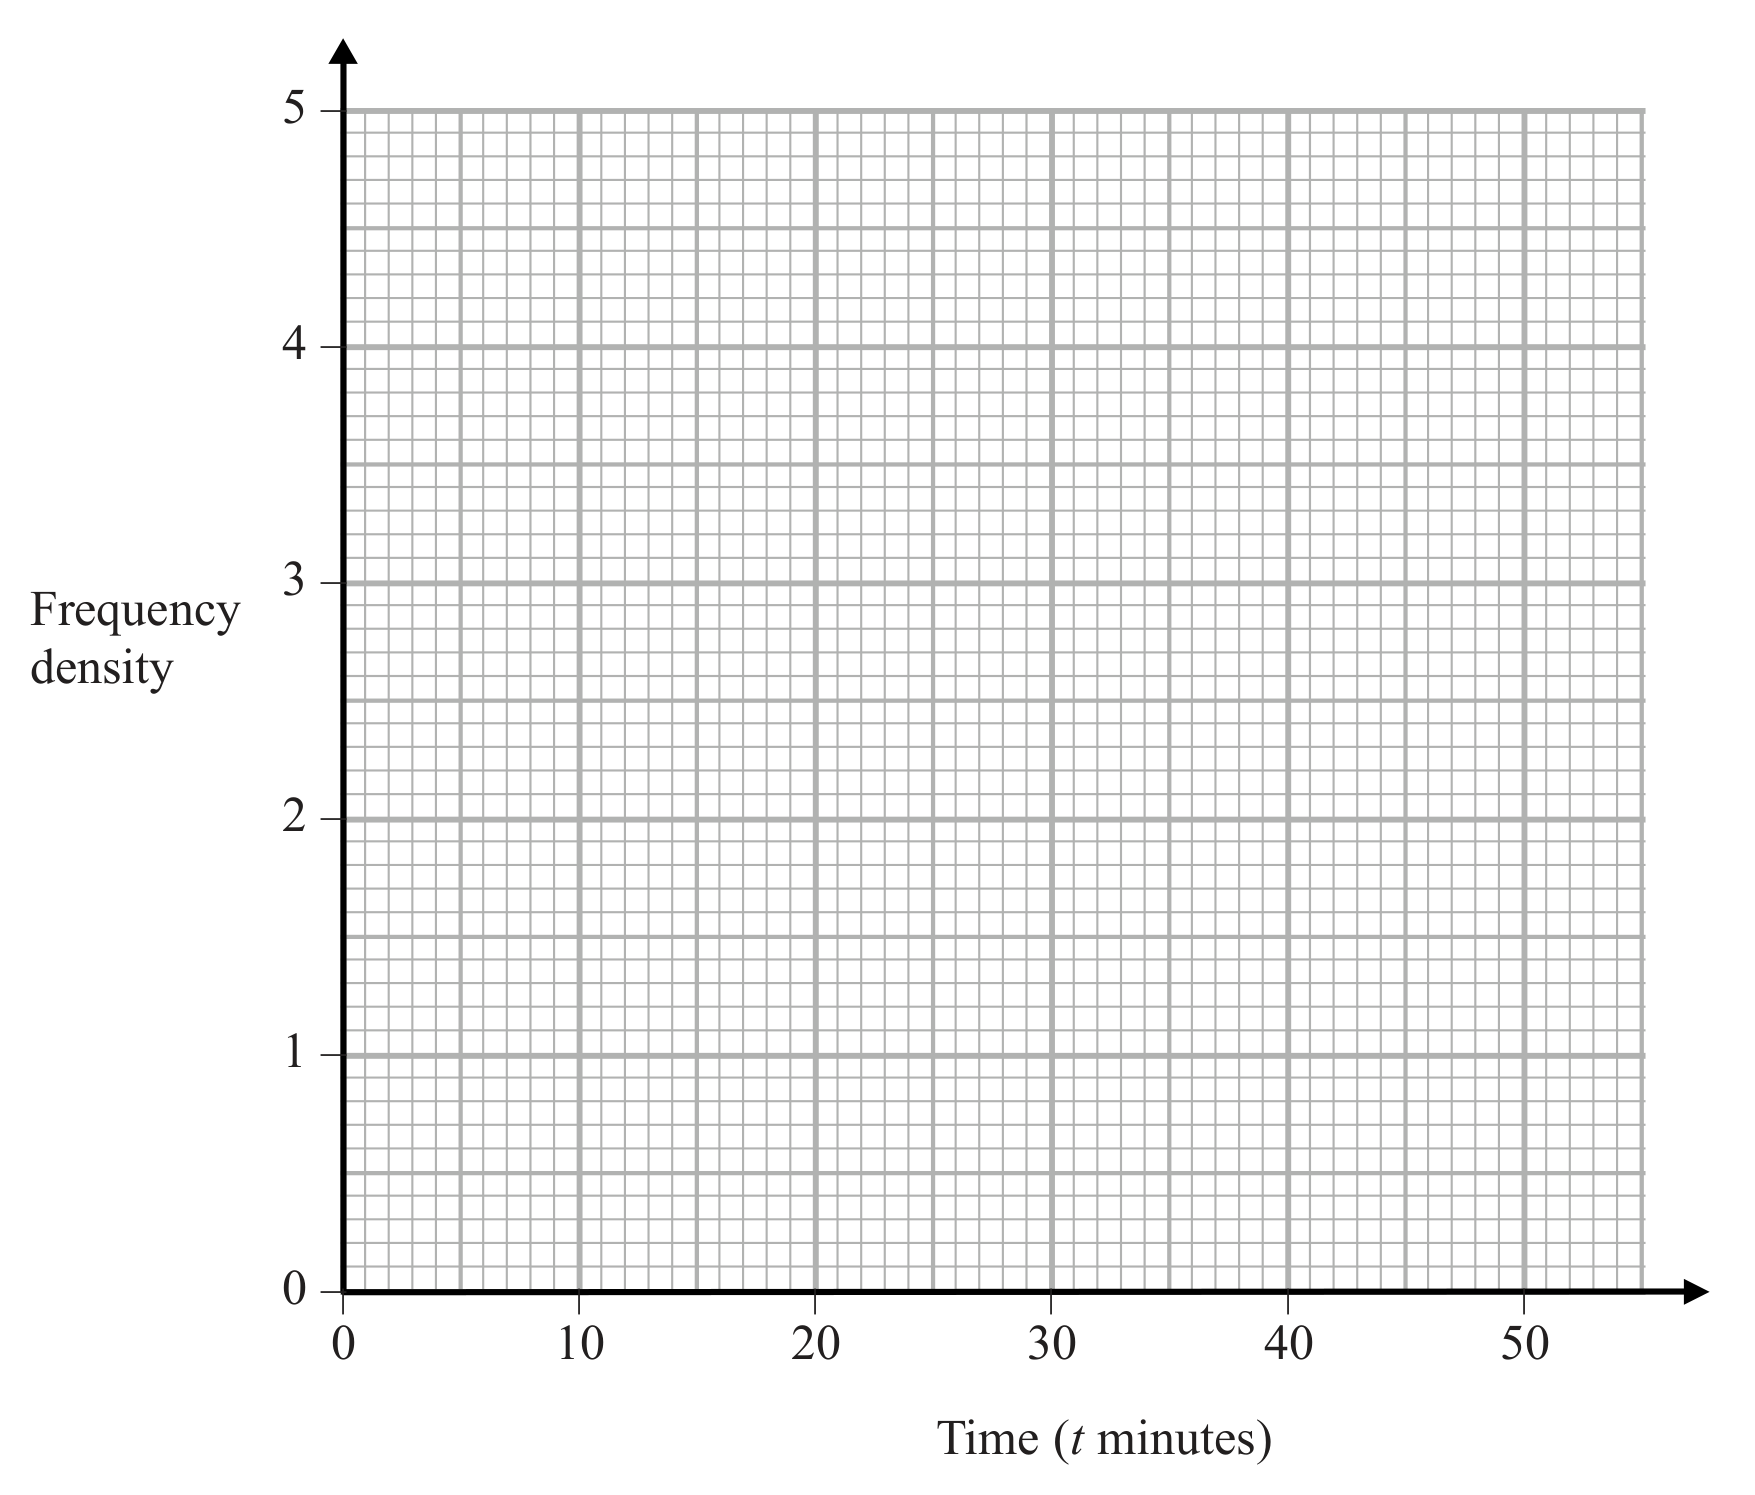
Only use this grid if you need to redraw your histogram.

0 selected