EduNinja

IGCSE Math B10.A Graphical representation of dataTopic Practice

10.A Graphical representation of data

Graphical representation of numerical data To include bar charts, pie charts and histograms Cumulative frequency graphs are excluded

Question 1

[Maximum number: 2]

Bananas, sugar cane and fish are the exports of a small country.
In 2017 the total value of its exports was $ 3690000
A pie chart was drawn for the values of the different exports in 2017 and the angle in the pie chart for bananas was 48.648.6^{\circ}

Calculate the value of the bananas exported in 2017
$
Question 1(a)

[Maximum number: 2]
Table

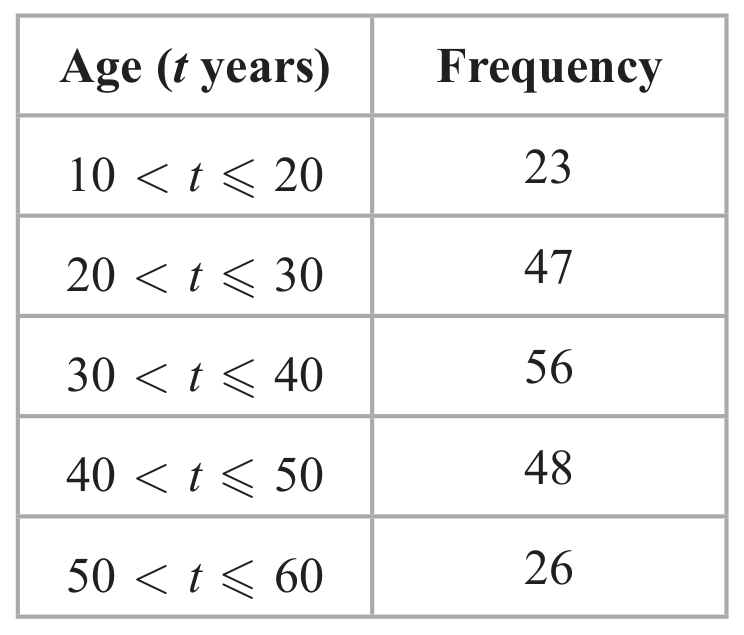
Malcolm is investigating the ages of the 200 members of a theatre company.
The table below gives information about the age group of each member of the company.

Malcolm is going to draw a pie chart for this information.

Calculate the size, in degrees, of the angle of the sector in the pie chart for those members of the company whose age group is 40<t5040<t \leqslant 50

Question 1(a)

[Maximum number: 2]

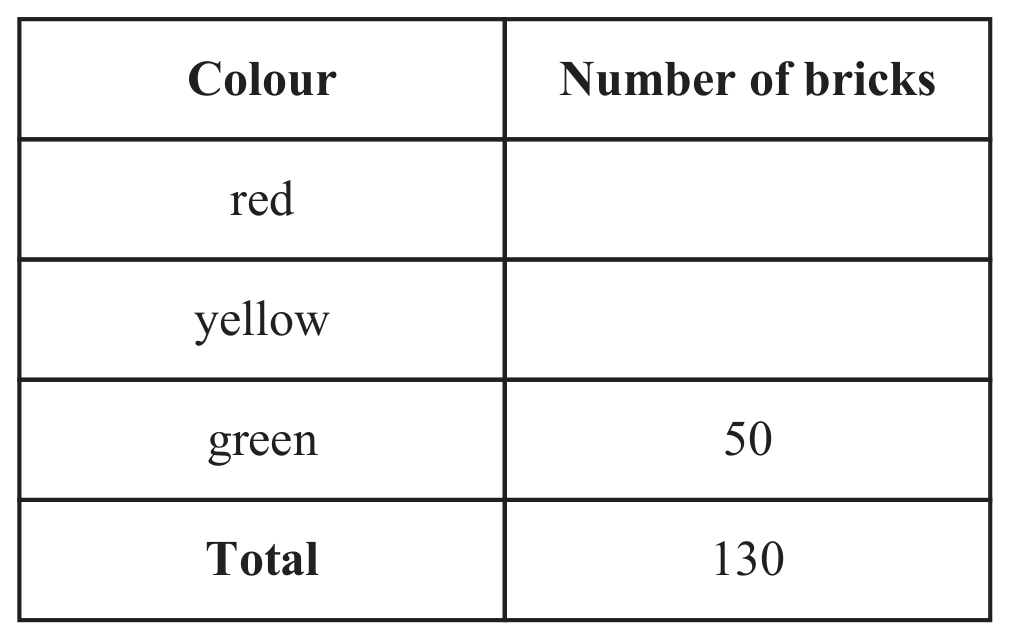
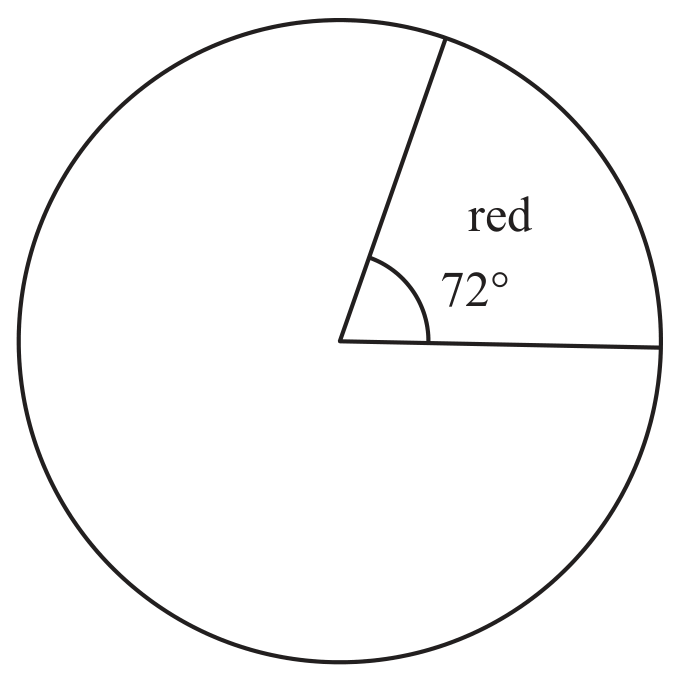
A bag contains red bricks, yellow bricks and green bricks only.
The incomplete table and an incomplete pie chart give information about the colours of the bricks in the bag.

Table
Question image
Question image

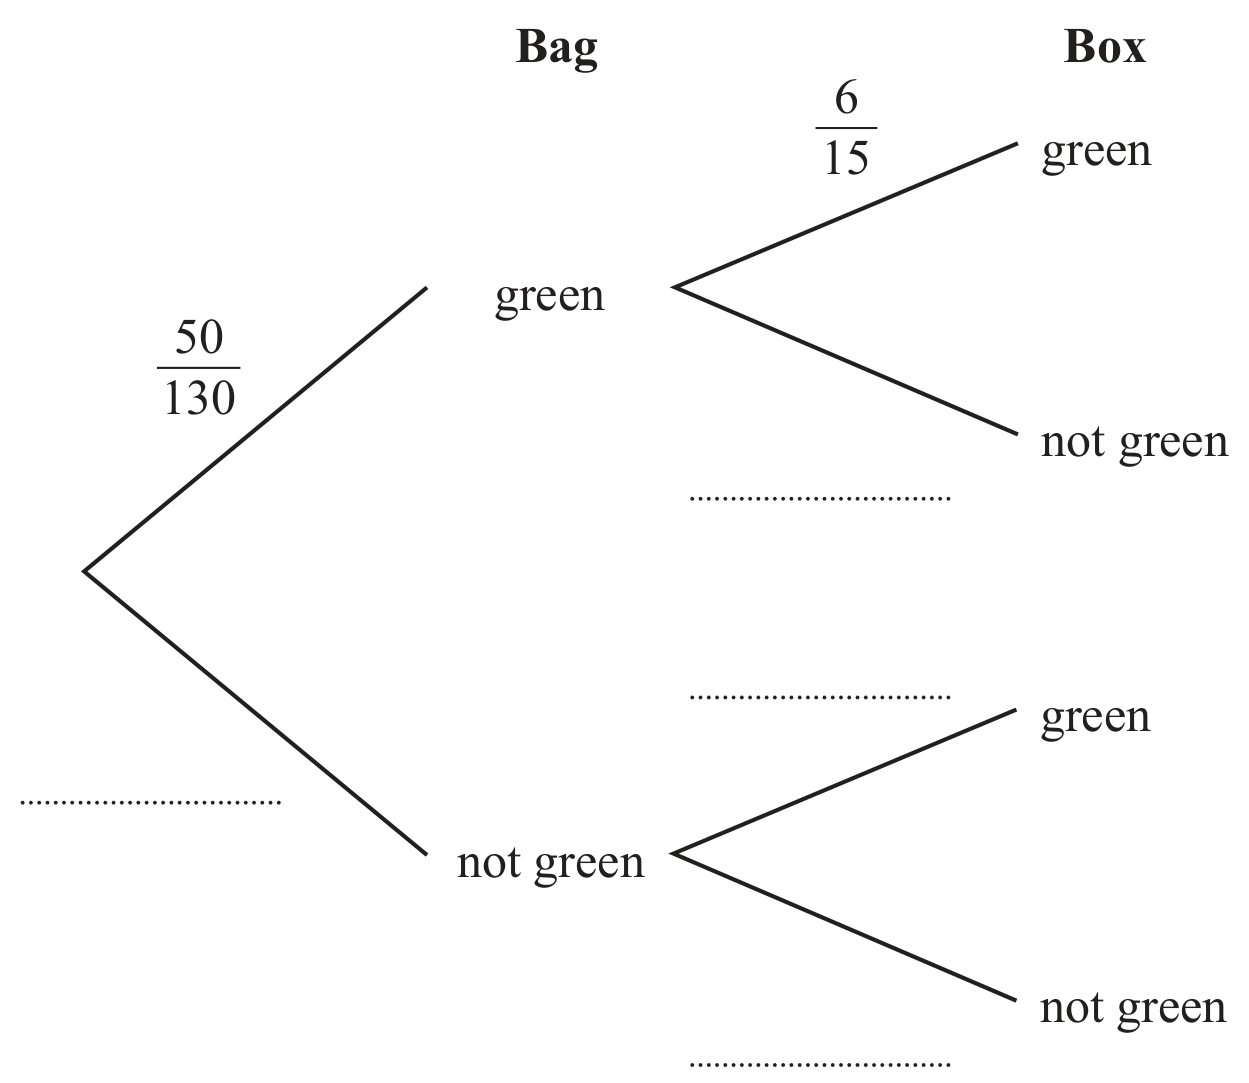
A box contains 9 red bricks and 6 green bricks only.
Asha takes a brick from the bag and a brick from the box.

Find the number of red bricks.

Question 1

Question image

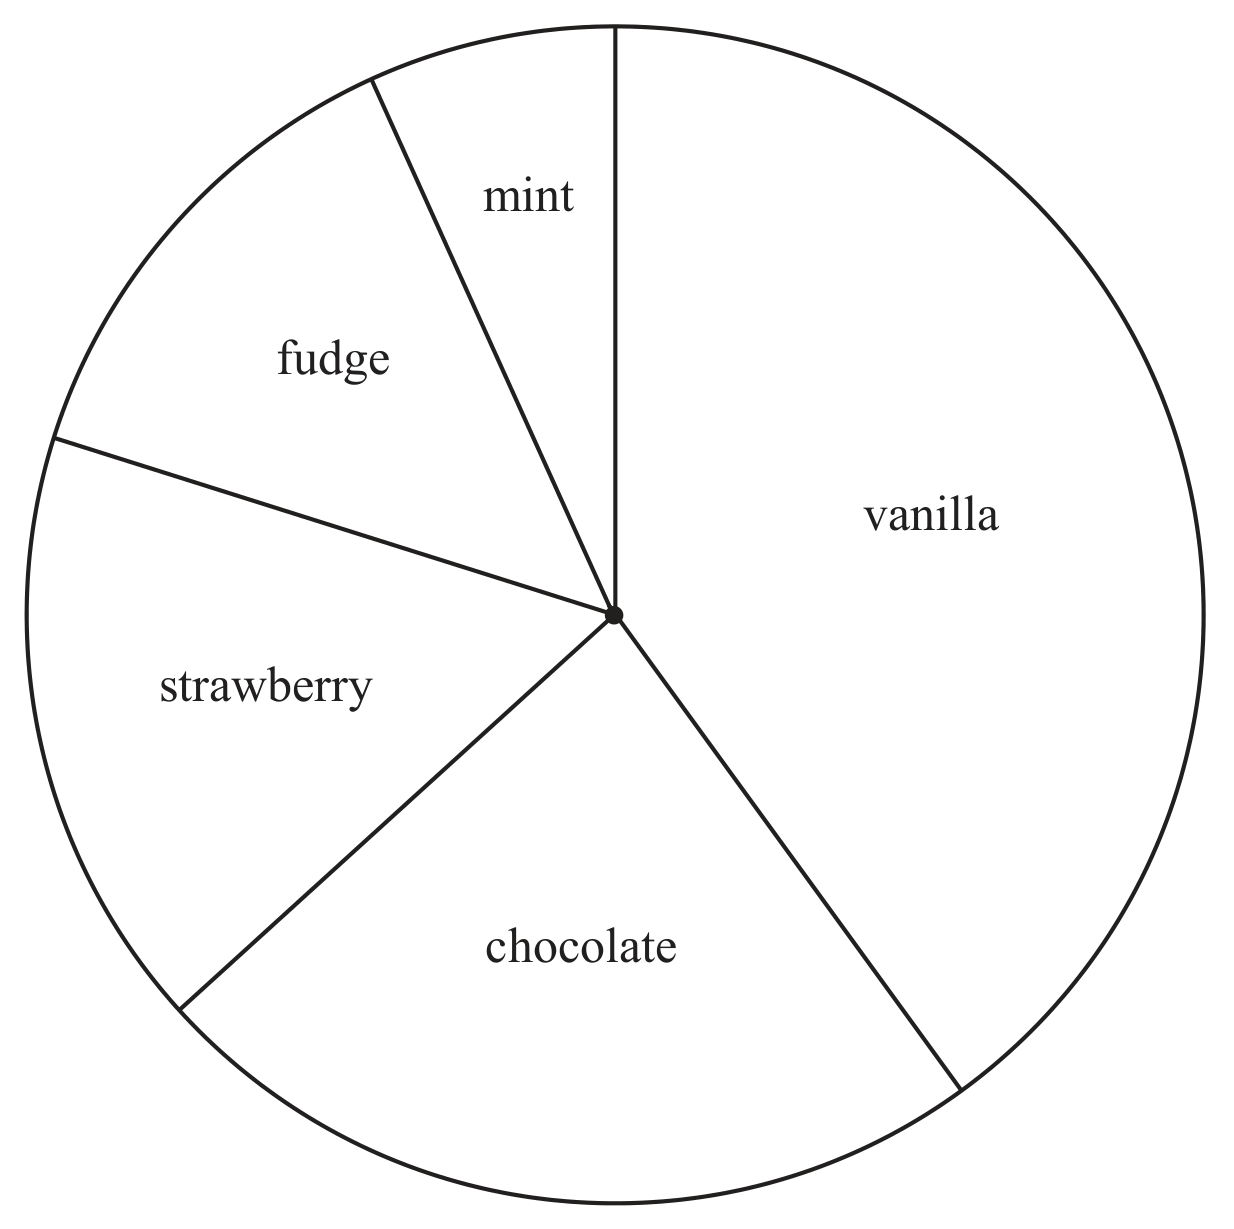
Charles asks each of the students in his class which flavour of ice cream they prefer.
There are 30 students in his class.
He uses the information he collects to draw this accurate pie chart.
Find how many of the 30 students prefer chocolate ice cream.

Question 2

On Monday, 150 students were asked how they got to school that morning.
Yuen is going to draw a pie chart for the results.
Given that 27 students said they got to school by bus on Monday, calculate the size, in degrees, of the angle of the sector in the pie chart for bus.

Question 5

John is going to draw a bar chart for the number of red apples and the number of green apples on the trees in his garden.

The height of the bar in the bar chart for the 28 green apples is 7 cm .
There are 50 red apples on the trees in John's garden.
Calculate the height of the bar in the bar chart for the red apples.

Question 3(a)

[Maximum number: 2]

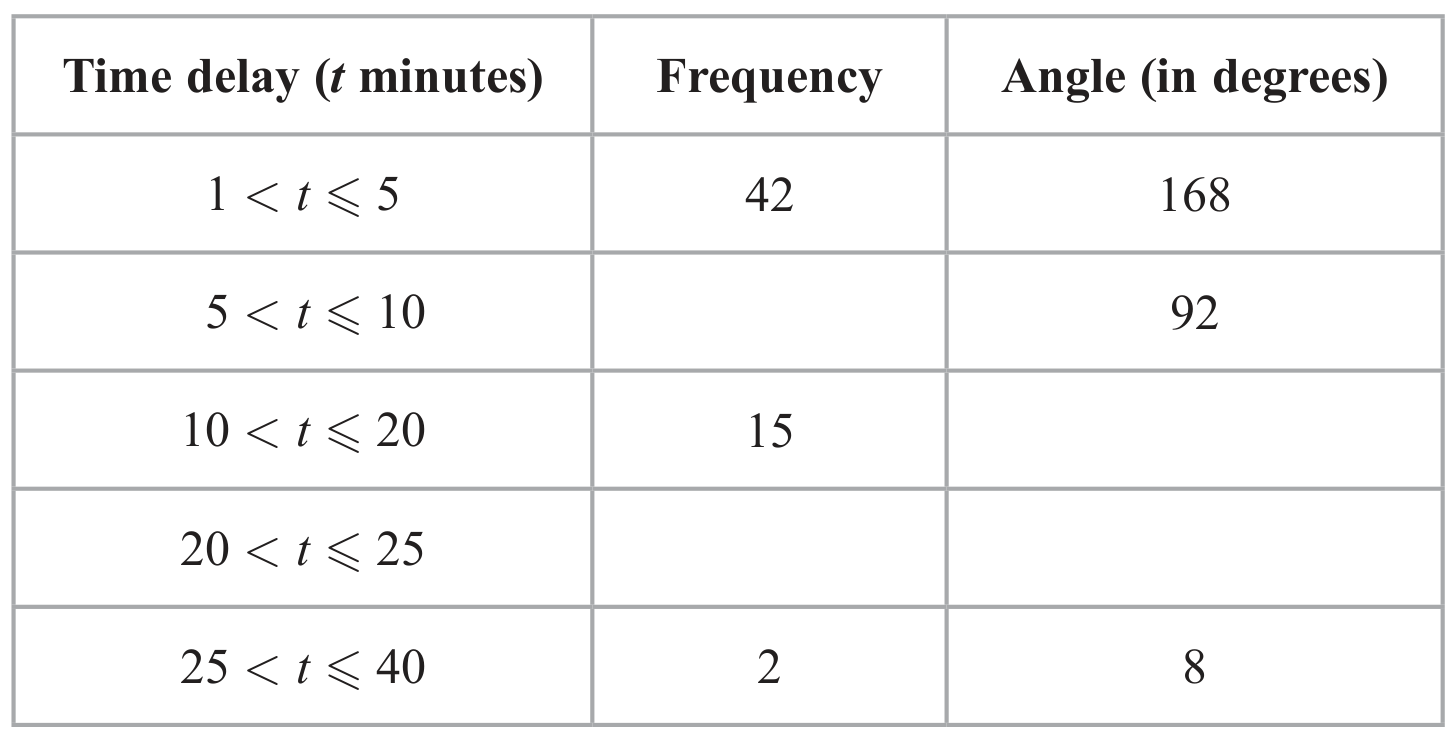
Arup collects information about the time delay, in minutes, of some trains.
He is going to draw a pie chart for his results.
The incomplete table below gives some information about his results together with the size, in degrees, of the angle of each of three sectors of his pie chart.

Table

Complete the table.

Question 8

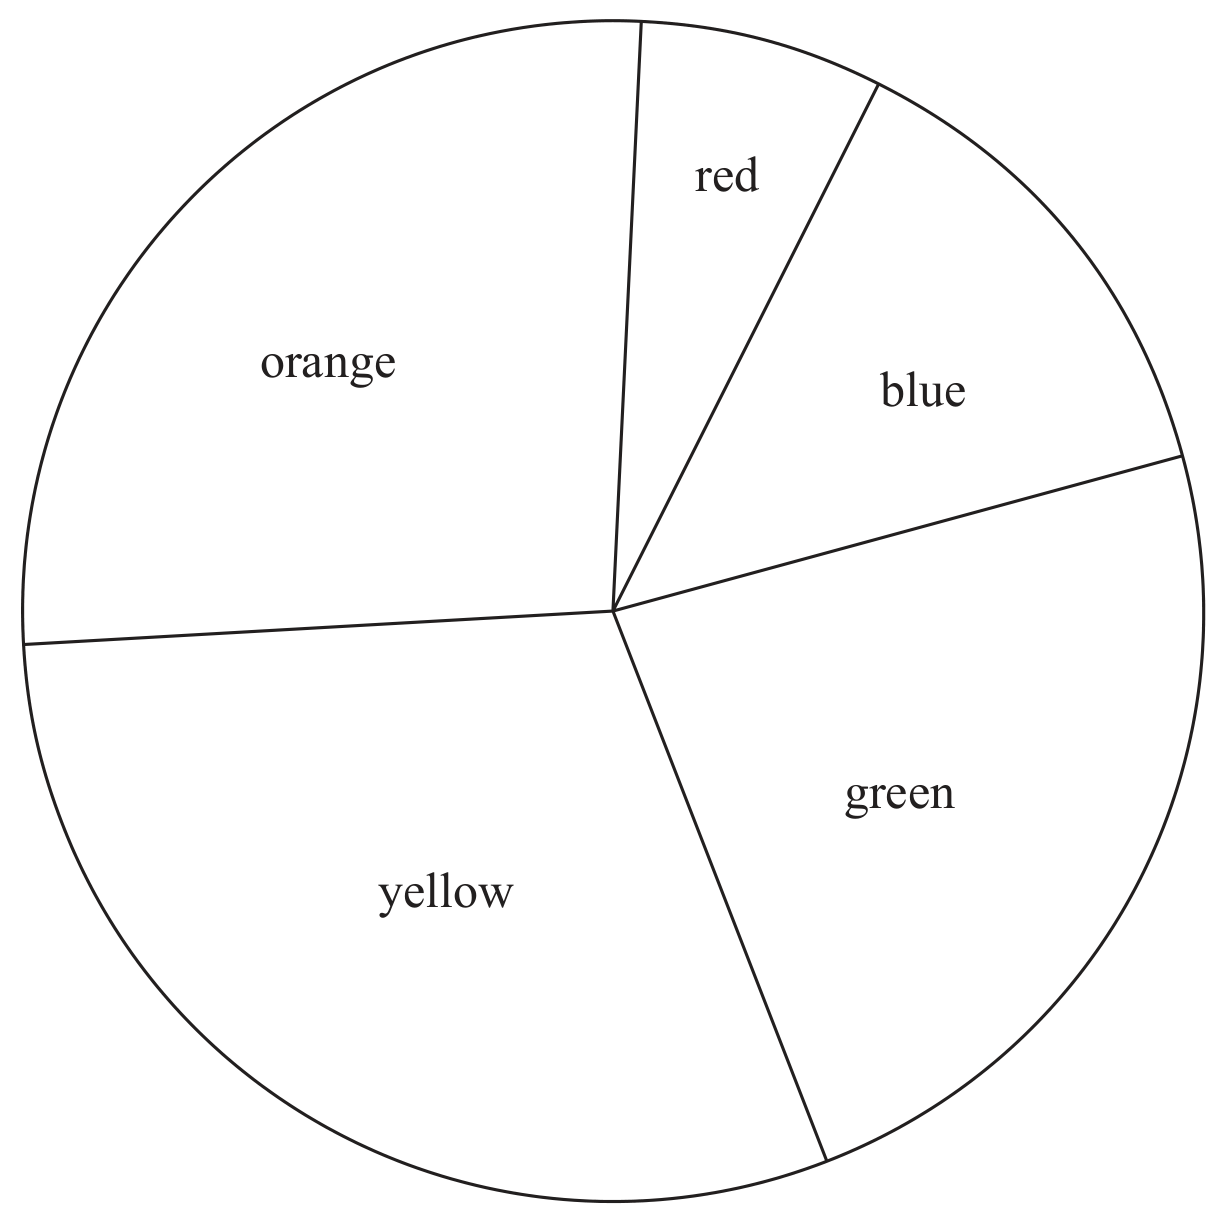
Rohan asked each of the students in his school what colour paper they would prefer him to use for their worksheets.

There are 150 students in Rohan's school.
Using his results, Rohan drew the following accurate pie chart.

Question image

Find how many of the 150 students preferred blue paper.

Question 6

[Maximum number: 6]
Question image

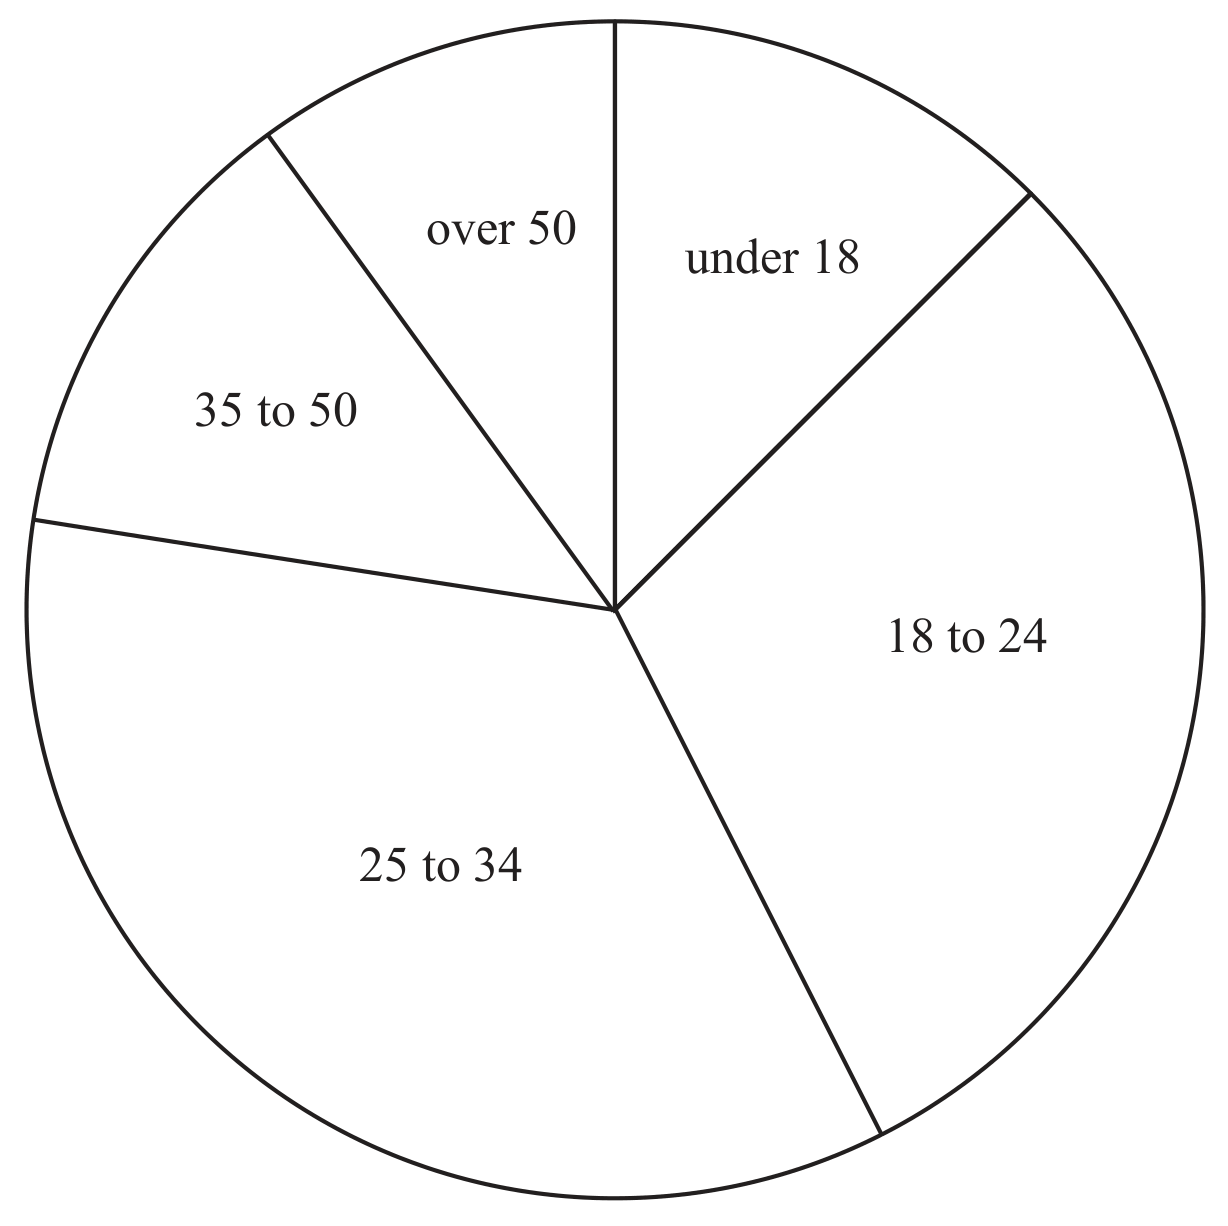
The accurate pie chart below shows information about the ages, in years, of 120 runners.

Question 6(a)

(a)

Calculate how many of these 120 runners are aged 25 to 34.

[ 3 ]

Question 6(c)

(b)

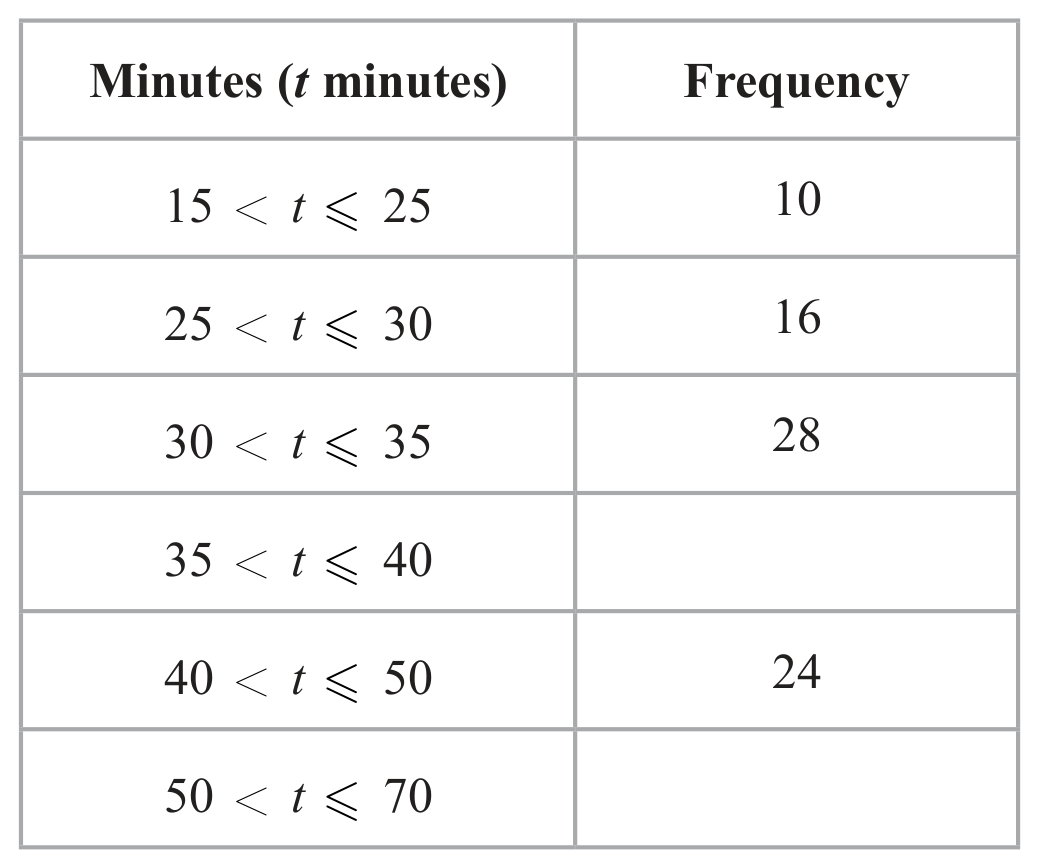
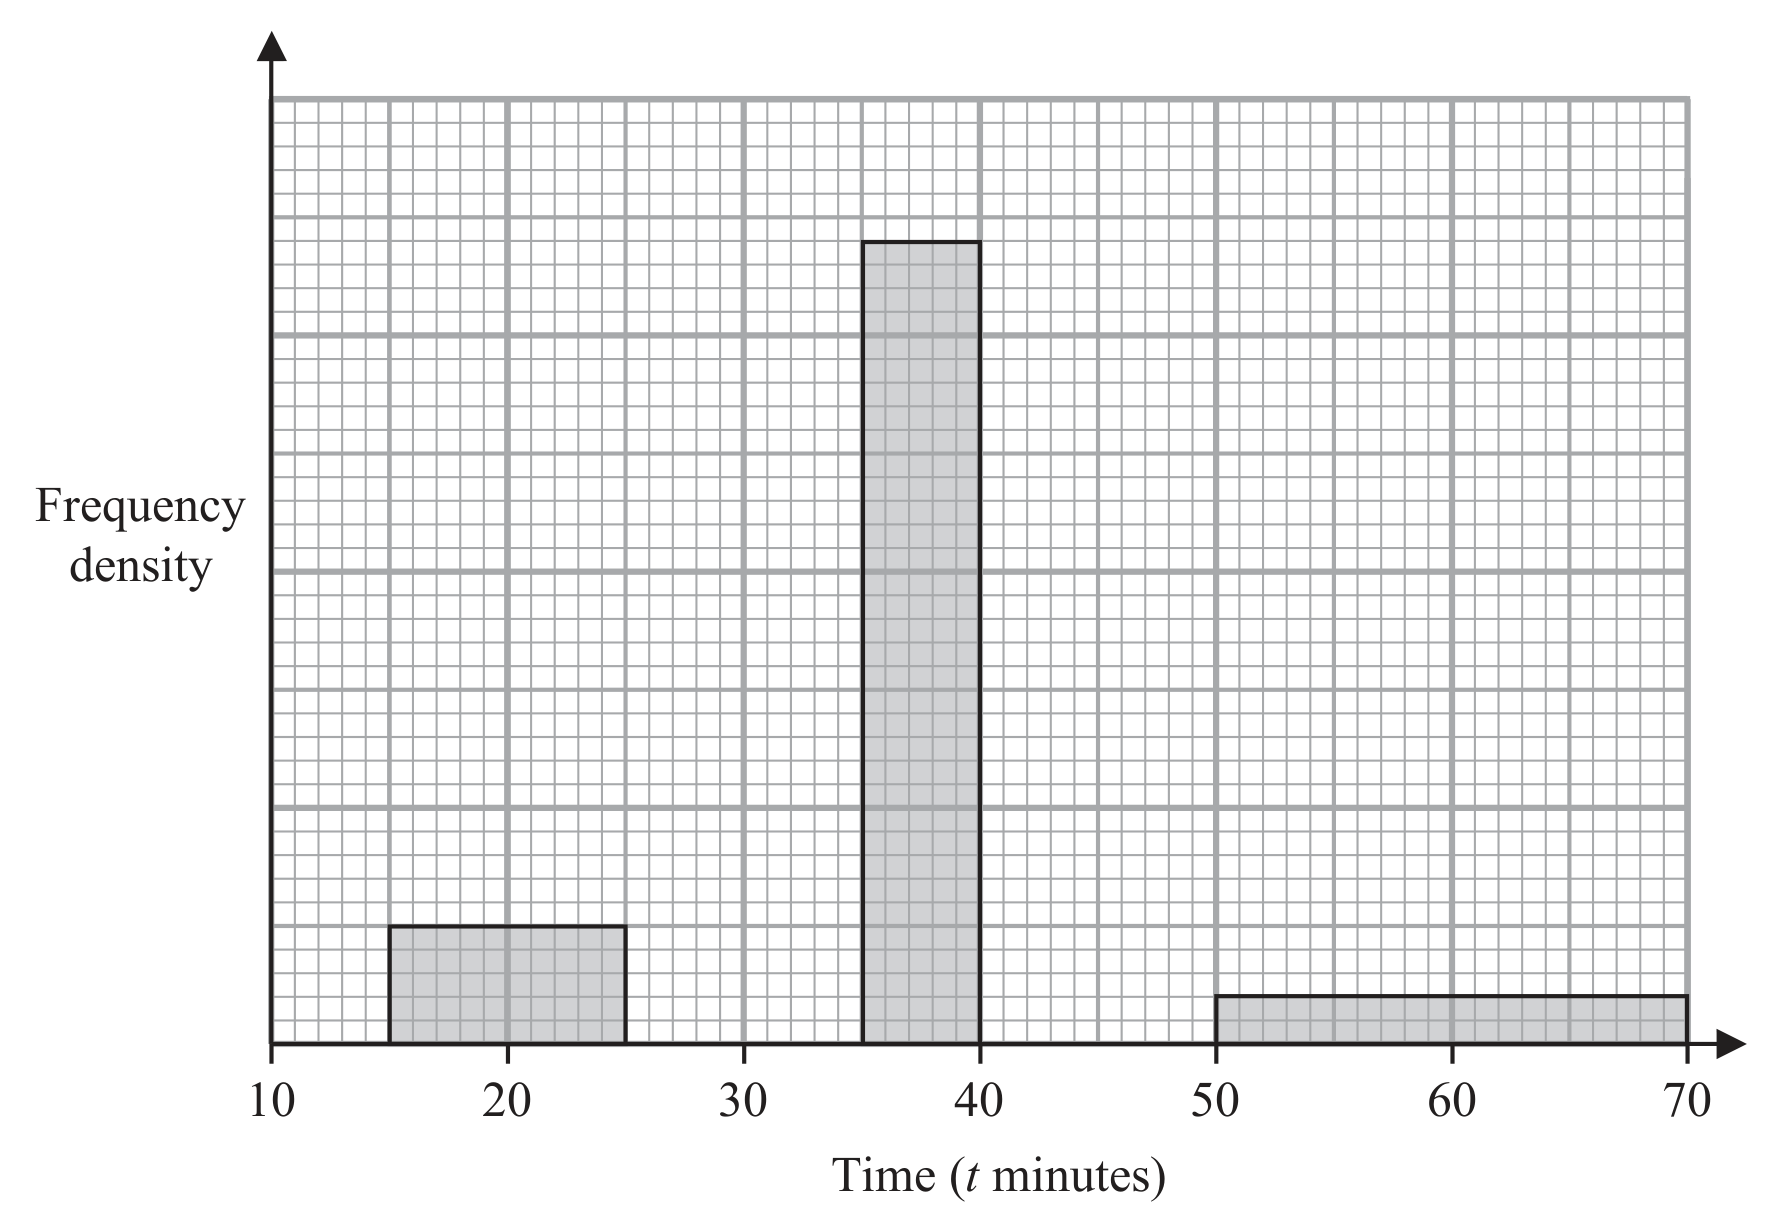
The times, in minutes, for the 120 runners to complete 5 km is recorded. No runner takes less than 15 minutes or more than 70 minutes.
The incomplete table and the incomplete histogram give information about the times.

Table
Question image

Complete the table and the histogram.

[ 3 ]

Question 7(a)

[Maximum number: 5]

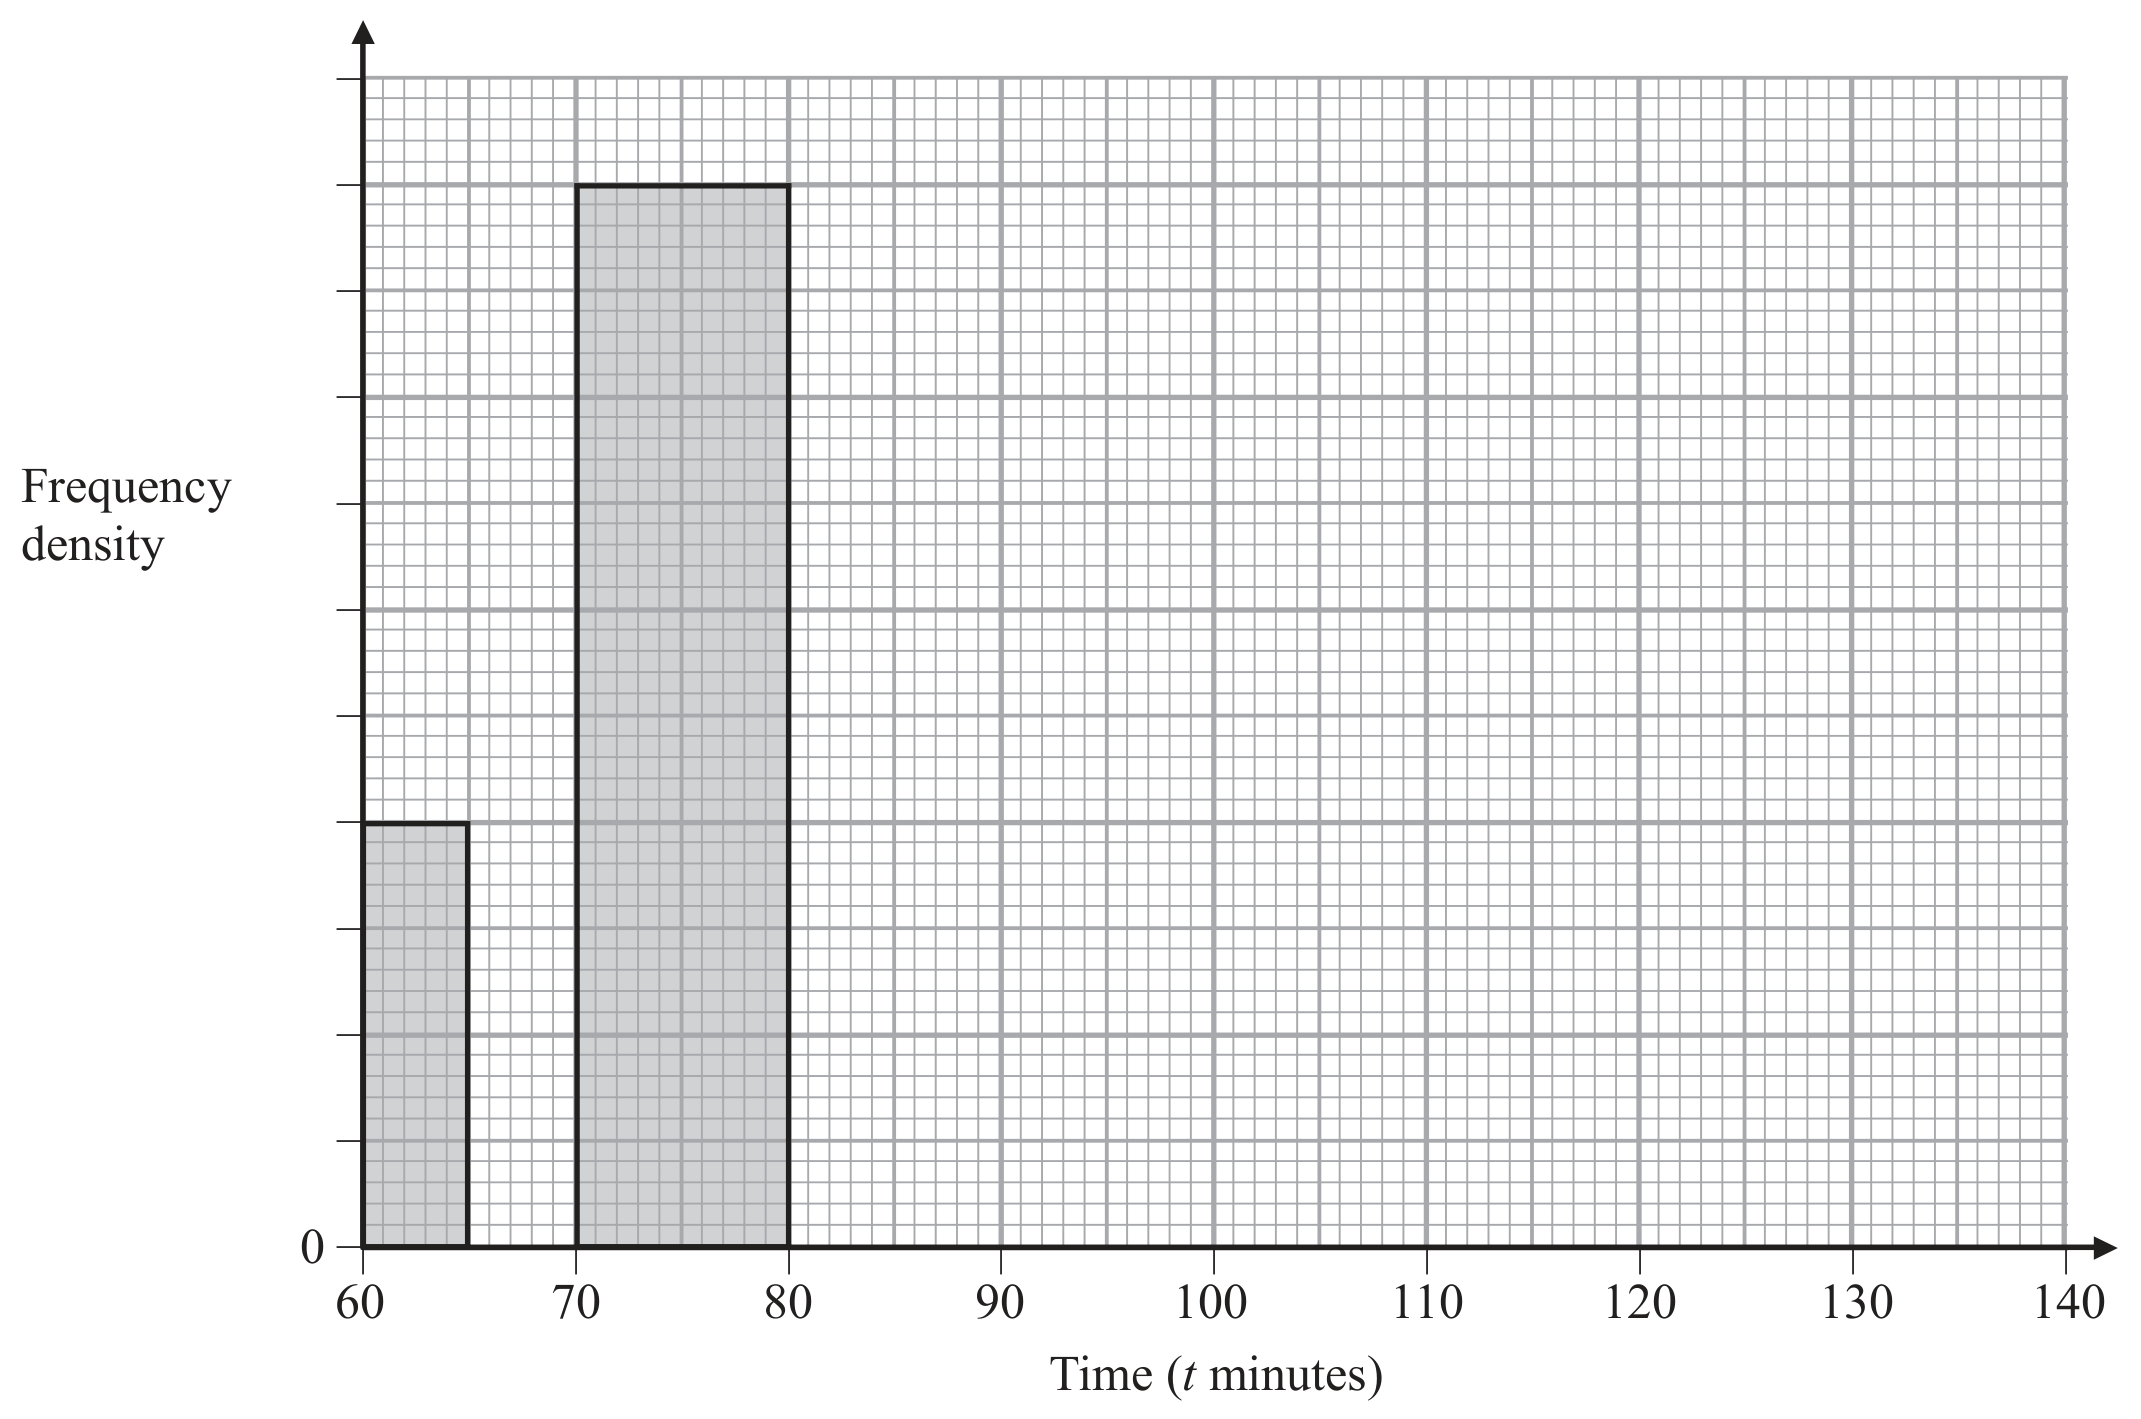
Information about the times, in minutes, taken by 305 runners to complete a half marathon is given in the incomplete table and the incomplete histogram.

Table
Question image

Complete the table and the histogram.

0 selected