IB Physics SL E.5.5 HR Diagram Regions

Practise locating main-sequence stars, giants, supergiants and white dwarfs on an HR diagram and inferring temperature, luminosity, colour or radius from axes and constant-radius…

Syllabus
First assessment 2025
Objective
Level
SL

Exam points

  • read temperature in its decreasing left-to-right direction and luminosity on the vertical axis
  • identify main sequence, giant, supergiant and white-dwarf regions from temperature and luminosity
  • use diagonal constant-radius lines or L ∝ R²T⁴ to compare stellar radii

E.5.5—HR diagram regions question 1

[Maximum number: 1]

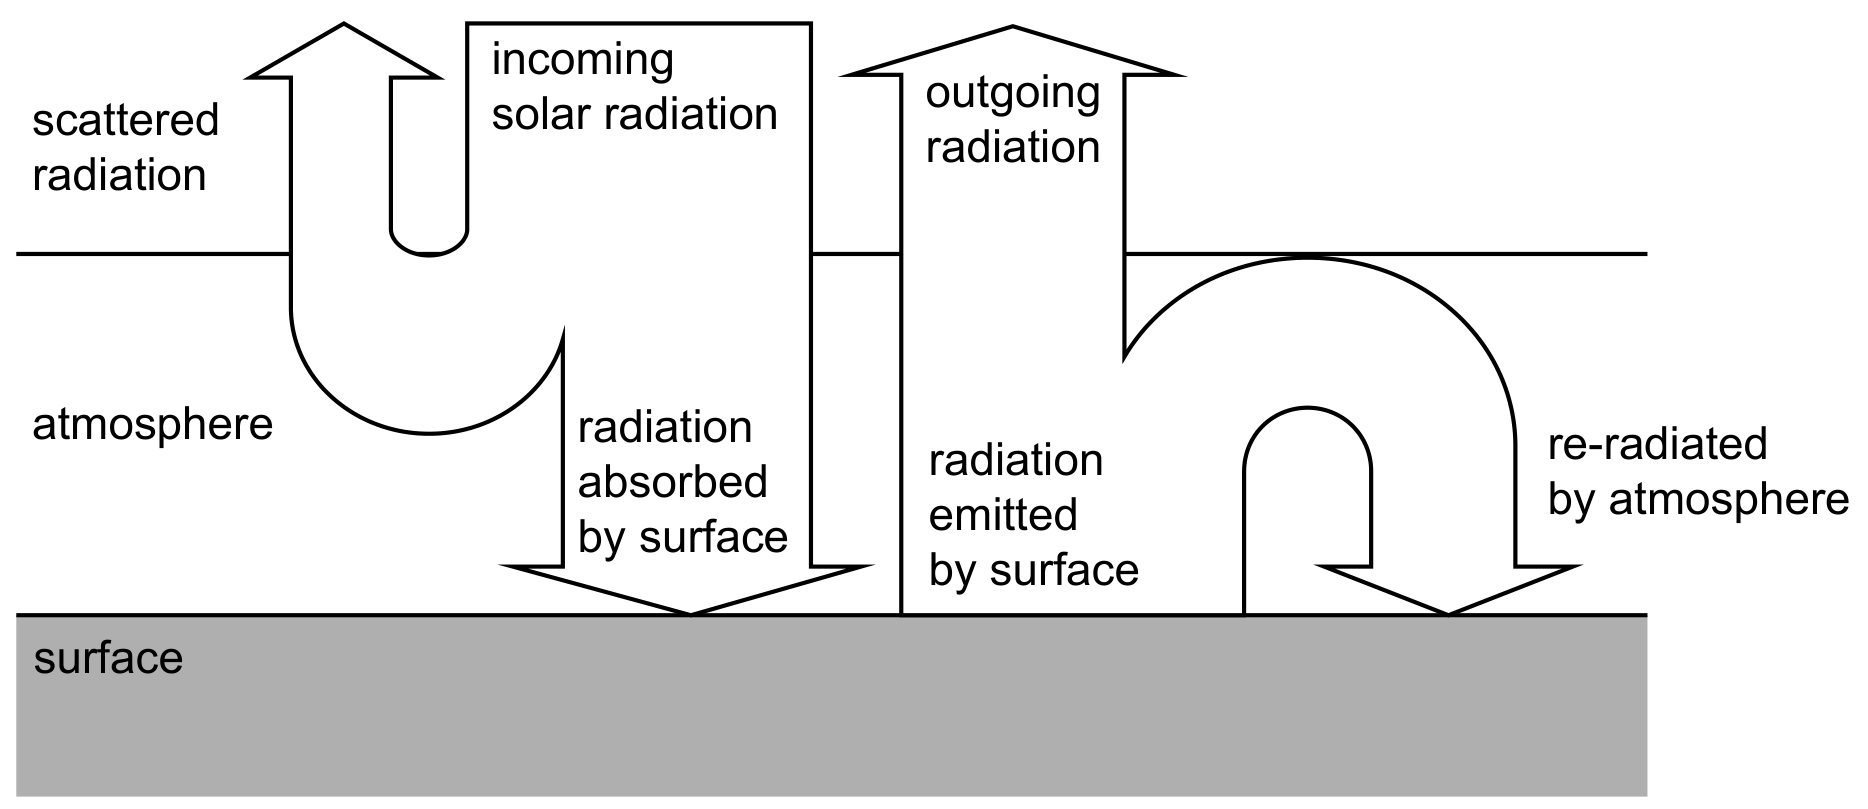
The diagram shows a simplified energy-balance model for the Earth surface–atmosphere system.

Figure for Question E.5.5—HR diagram regions question 1 — IB Physics SL

The following data are given:

 Average albedo of Earth =0.30 Average global temperature of the surface =288 K Average Earth-Sun distance =1.5×10¹¹ m\begin{aligned} \text { Average albedo of Earth } & =0.30 \\ \text { Average global temperature of the surface } & =288 \mathrm{~K} \\ \text { Average Earth-Sun distance } & =1.5 \times 10^{11} \mathrm{~m} \end{aligned}

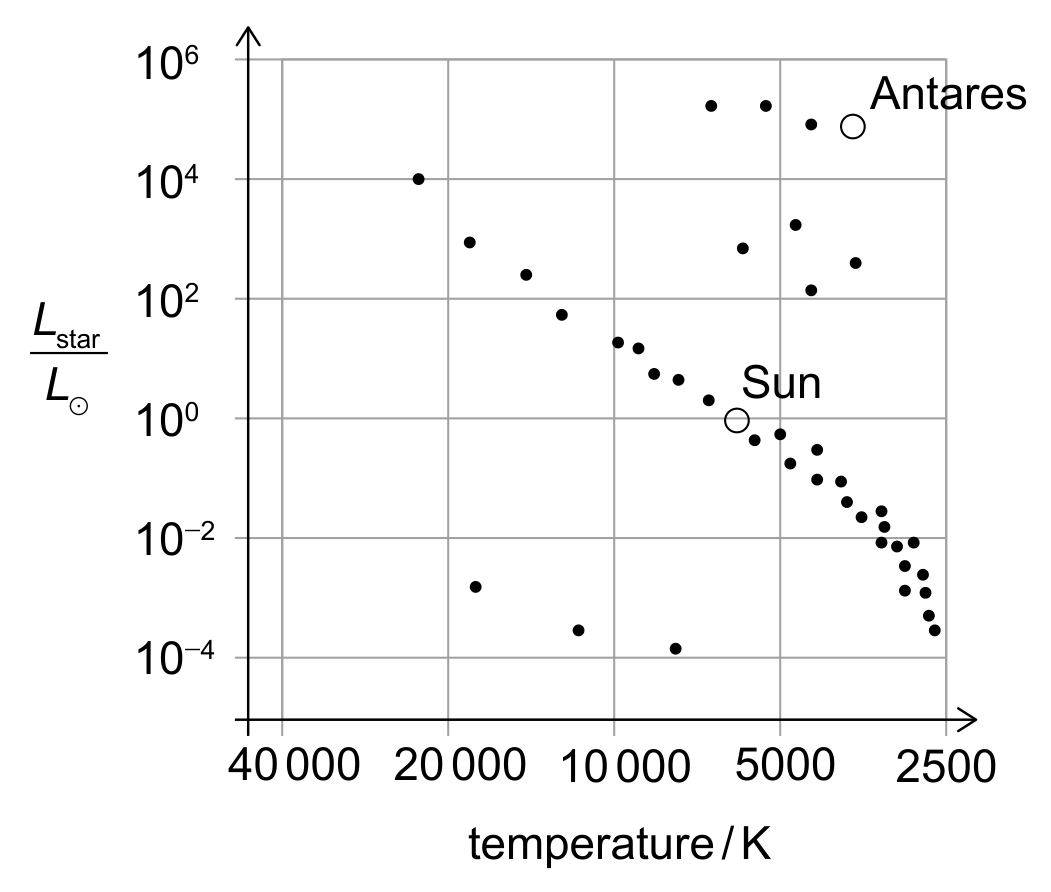
The positions of the Sun and the star Antares are shown in the Hertzsprung-Russell (HR) diagram.

Figure for Question E.5.5—HR diagram regions question 1 — IB Physics SL

State the star type of Antares.

All question bank results loaded