CAIE A-Level Economics 2.1.6 Supply Curve Shifts

CAIE A-Level Economics 2.1.6 Supply Curve Shifts
Cambridge International AS & A Level Economics 9708 syllabus for exams in 2026, 2027 and 20282026–2028

Practise explaining leftward or rightward supply shifts from costs, productivity, taxes, subsidies, technology, firm numbers or shocks and tracing the new equilibrium.

How this is tested

  • identify the non-price supply determinant and explain how it changes marginal production conditions
  • draw the direction of the supply shift while holding the product's own price on the vertical axis
  • combine shifted supply with demand to predict equilibrium price and quantity, noting possible offsets

Question 9

[Maximum number: 1]

The diagram shows the demand for and supply of a product.
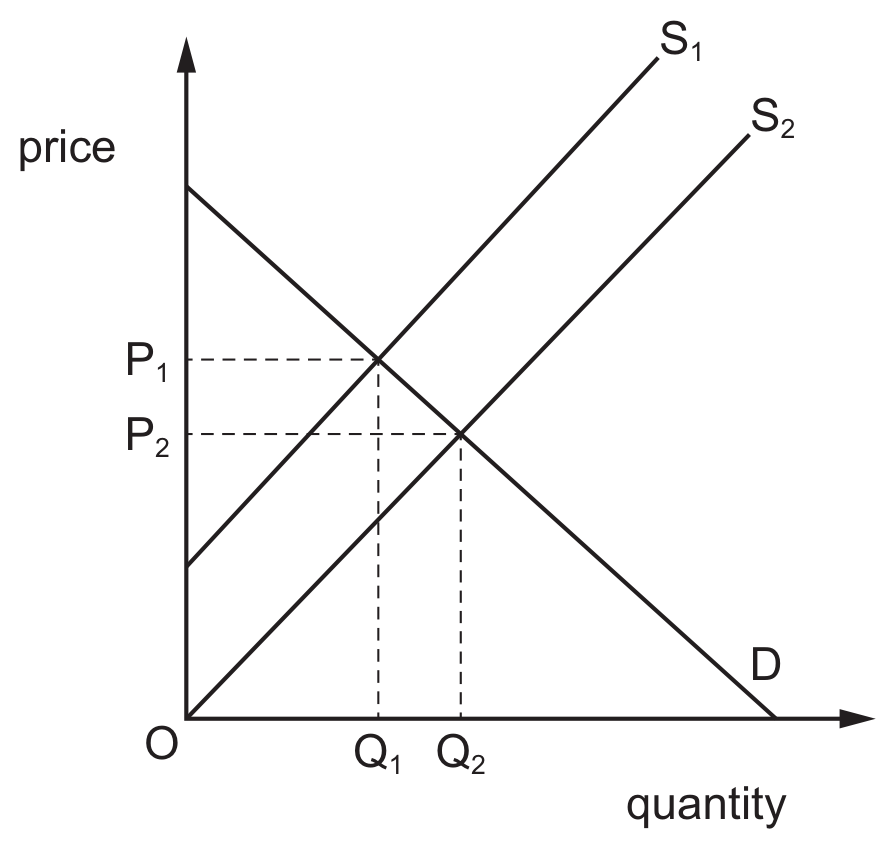
Figure for Question 9 — CAIE A-Level Economics

What could cause supply to shift from S1\mathrm{S}_{1} to S2\mathrm{S}_{2} ?

A

a fall in the price of the product

B

a fall in labour costs

C

a rise in the price of the product

D

a rise in labour costs