CAIE A-Level Economics 11.4 Characteristics at Different Development Levels Question Bank

CAIE A-Level Economics 11.4 Characteristics at Different Development Levels Question Bank
Cambridge International AS & A Level Economics 9708 syllabus for exams in 2026, 2027 and 20282026–2028

Practise using population structure, optimum population, Lorenz and Gini evidence and sector employment or trade patterns to compare economies at different levels of development.

Exam points

  • interpret birth rates, ageing and dependency data and relate population size to optimum output per head
  • draw or read Lorenz curves and Gini coefficients to compare the distribution of income
  • infer development level from primary, secondary and tertiary employment or trade patterns

Question 1(a)

[Maximum number: 2]

Malaysia's uncertain economic prospects

Malaysia is an emerging middle-income country. Its increasing population is an important factor in promoting future economic growth. The country, however, faces two underlying problems. First, the fertility rate, the average number of children a woman can expect to give birth to, has fallen consistently as Malaysia's economy has developed. This rate is now below the critical level where a population replaces itself. Second, Malaysia has an ageing population, with an increasing proportion of its population over 65 years of age. In 2015 the average age of Malaysia's population was 28.2 years; in 2030 it is forecast to reach 34.1 years. Malaysia's forecast total population to 2027 and its ageing population from 2017 to 2022 are shown in Figs. 1.1 and 1.2 below.

Content removed due to copyright restrictions.
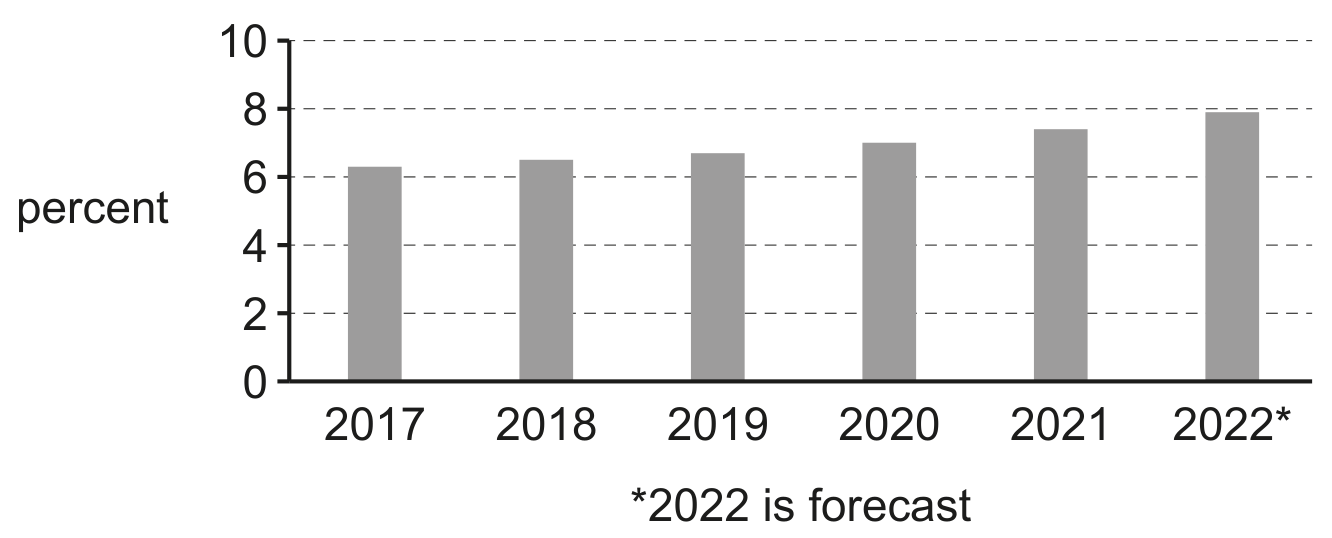
Fig. 1.1 Total population of Malaysia, 2017 to 2027

Fig. 1.1 Total population of Malaysia, 2017 to 2027

The key issue for Malaysia's government is whether it is prepared for this fundamental shift in its population. There is plenty of scope for optimism. The economy appears to have recovered from the shock of the COVID-19 pandemic. Its growth rate in 2021 and the 2022 forecast was above the government's target of 5.1%5.1 \%, with substantial growth in exports of electrical and electronic goods, palm oil, gas and oil supplies. Unemployment is below 4\% and the current account of the balance of payments was projected to have a record surplus in 2022.

Economists, however, fear that Malaysia's government and its people are not ready to meet the challenges of an ageing population. In a recent survey, 70%70 \% of respondents felt it was the duty of the young to take care of the elderly, but they were also concerned that the economy could not cope with the pressure on its human capital and other resources. More resources will have to be allocated to meet the needs of the elderly.

It was further argued that Malaysia needed a proper plan for dealing with this situation. According to one economist, free childcare for working parents was essential and tax incentives should be used to keep more elderly workers in employment.

Use the information in Figs. 1.1 and 1.2 to compare the change in Malaysia's total population from 2017 to 2022 with the change in its ageing population from 2017 to 2022.
Question 1(a)

[Maximum number: 5]

Inequality and globalisation

A government commission published a report saying that global poverty and inequality were worsening and there was a risk that the gap between the rich and the poor would increase.

But, according to a newspaper, a lot of what is said about inequality is wrong. It overlooks the fact that the past 50 years saw a period of dramatic reduction in global inequality. The normal measurement of relative inequality is the Gini coefficient. The figure for global inequality in 1975 was 0.75 , in 2020 it was 0.72 and in 2022 it was 0.67 .

It is important to understand this trend rather than make the mistake of the commission.
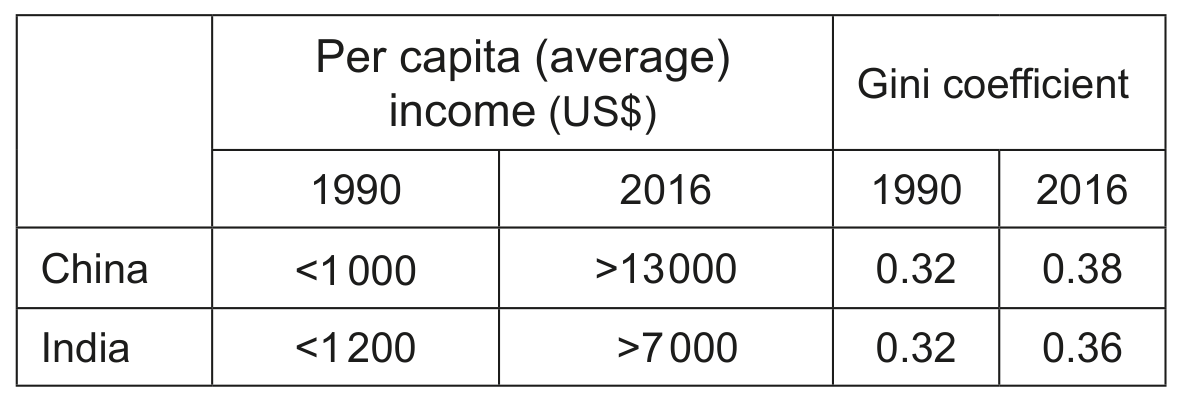
The fall in global inequality should not come as a surprise. For about two hundred years the benefits of industrialisation went mainly to countries in Europe and North America. Income inequality between these countries and poorer countries worsened. The spread of globalisation in recent decades has meant this difference has lessened. Countries such as China and India have benefited from large increases in per capita (average) income, as shown in Table 1.1.

Table 1.1 Per capita (average) income and Gini coefficient for China and India 1990 and 2016

Table 1.1 Per capita (average) income and Gini coefficient for China and India 1990 and 2016

With such an increase in per capita incomes maybe some level of inequality does not matter. Indeed, it might be a necessary condition for economic growth. Instead of concentrating on eliminating inequality perhaps the focus should be on the absolute position of the poorest.

If the attention is on the relief of poverty rather than the wealth of the richest, improvements can be seen. Life expectancy has increased, most noticeably by ten years in the past two decades in the poorest region of sub-Saharan Africa. Literacy rates have also increased. Those in absolute poverty across the world have fallen from more than a third to under a tenth of the world's population. And all this while the world's population has increased.

Critics of globalisation and foreign direct investment (FDI) by multinational companies point to the possible negative environmental effects, the weakening of individual cultures and the reliance on international financial institutions that can fail. They also claim there can be exploitation of workers leading to greater wage inequality and possible increases in domestic unemployment as cheaper goods are imported.

The article refers to the Gini coefficient. With the help of a diagram explain the link between a Gini coefficient and a Lorenz curve.

Question 30

[Maximum number: 1]

The table gives the percentage of employment in the primary, secondary and tertiary sectors in four countries.

Which country is most likely to be a high-income country?

primary
sector
\%

secondary
sector
\%

tertiary
sector
\%

15

40

45

30

40

30

35

45

20

45

35

20