CAIE A-Level Economics 11.3 Economic Development Question Bank

CAIE A-Level Economics 11.3 Economic Development Question Bank
Cambridge International AS & A Level Economics 9708 syllabus for exams in 2026, 2027 and 20282026–2028

Practise separating growth from development, calculating real income per head and using HDI, MPI, inequality and non-monetary evidence to compare living standards across…

Exam points

  • distinguish growth in real GDP from broader development in health, education and living standards
  • calculate or interpret real income per head, HDI and MPI components from tables and extracts
  • evaluate country comparisons using income, inequality and non-monetary evidence rather than one index

Question 20

[Maximum number: 1]

The table shows real GDP per head measured in $US for countries X and Y over a three year period.
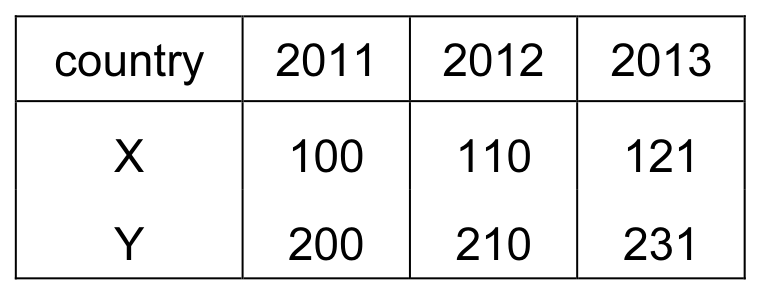
Table for Question 20 — CAIE A-Level Economics

What can definitely be concluded from the data?

A

Each country had the same rate of economic growth between 2011 and 2012.

B

Growth in real GDP per head was higher in country X than in country Y between 2011 and 2012.

C

Population growth was higher in country X than in country Y between 2012 and 2013.

D

The average price level was higher in country X than in country Y throughout the period.

Question 24

[Maximum number: 1]

What does the Kuznets curve show about the relationship between economic development and inequality?

A

the Gini coefficient initially falls as countries develop from low to high income levels

B

the Gini coefficient initially rises as countries develop from low to high income levels

C

there is always a negative relationship between GDP per capita and the Gini coefficient

D

there is always a positive relationship between GDP per capita and the Gini coefficient

Question 29

[Maximum number: 1]

Which country is likely to be the most highly developed?

Gini coefficient

death rate

relative size of
tertiary sector

high

high

high

low

low

low

low

low

high

low

high

low