D2.3.4—Changes in plant tissue
Plant tissue changes mass in sucrose or salt solutions, allowing isotonic concentration to be estimated from zero percent change in experiments.
- Syllabus
- First assessment 2025
- Objective
- D2.3.4
- Level
- SL
Plant tissue changes mass in sucrose or salt solutions, allowing isotonic concentration to be estimated from zero percent change in experiments.

Coverage 2016–2024 · Updated 16 Jul 2026
Changes in plant-tissue mass or length across a series of sucrose concentrations can be used to estimate the isotonic concentration.
Prepare equal tissue pieces, record initial mass or length, incubate them for the same time in known sucrose solutions, blot consistently, record final values and calculate change.
%\text{ change}=\frac{\text{final value}-\text{initial value}}{\text{initial value}}\times100
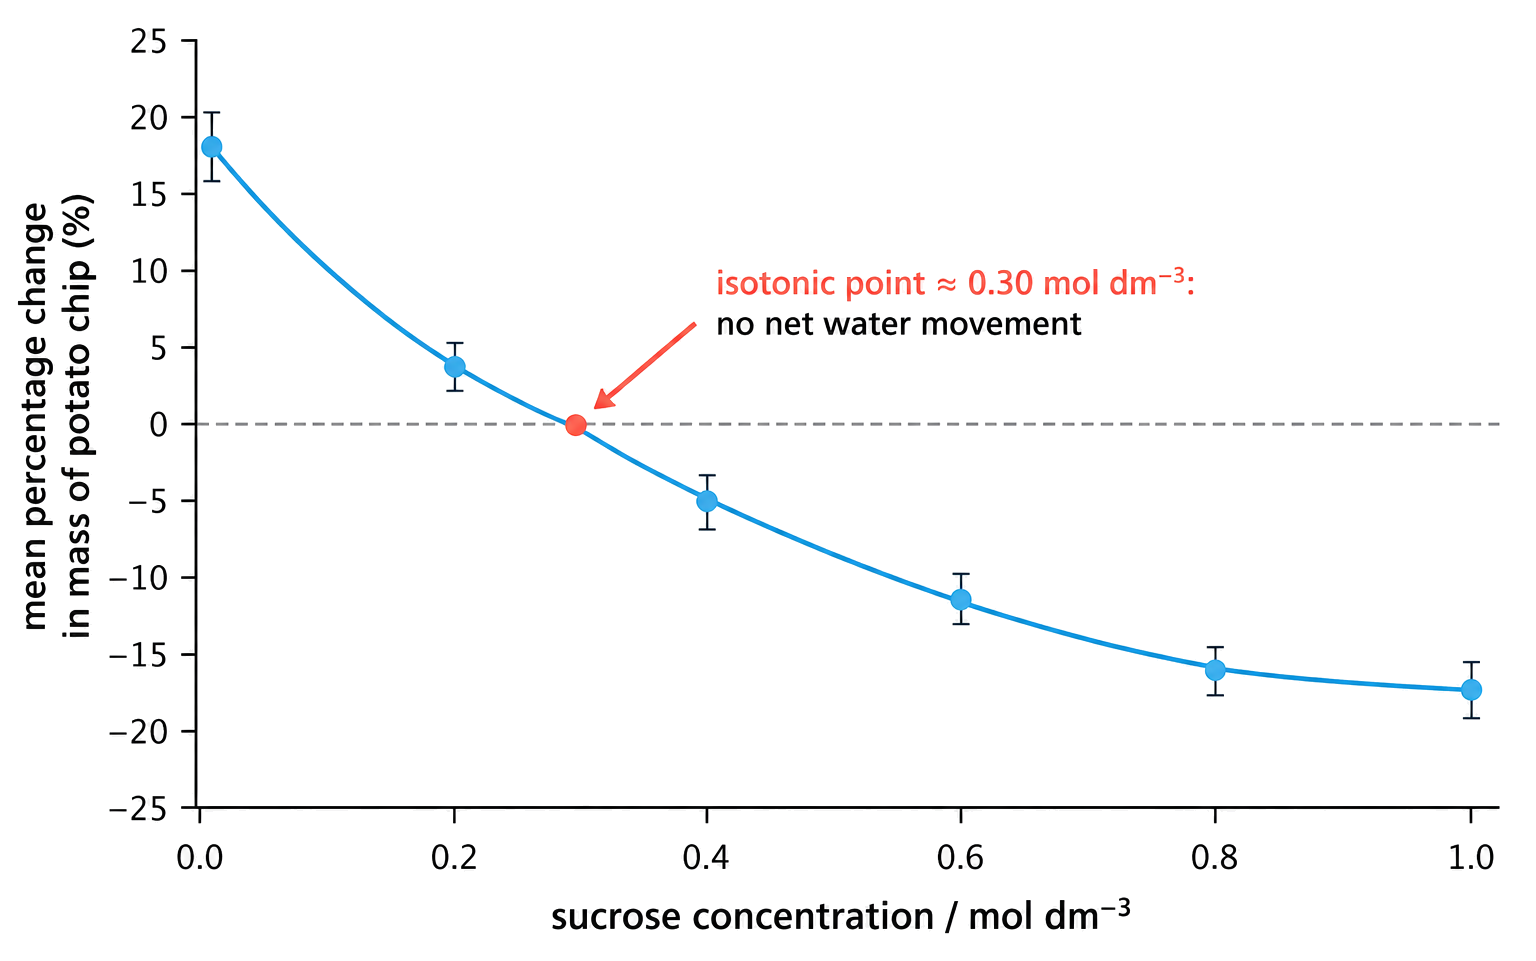
Plot mean percentage change against sucrose concentration. The x-intercept, where change is 0%, estimates the isotonic concentration. Replicates allow standard deviation to compare spread and standard error/error bars to compare uncertainty in means.
Positive mass change at 0.20 mol dm⁻³ and negative change at 0.30 mol dm⁻³ place the isotonic estimate between those concentrations; interpolate from the fitted graph rather than choosing the nearest raw point.
Zero mean change estimates isotonic conditions; it does not mean water molecules stopped moving. Consistent blotting, initial size and incubation time are needed for a fair comparison.
This objective is assessed through experimental design, commonly using Identify / Describe / Explain.
Identify / Describe / Explain / Suggest / Evaluate / Outline
Build the answer around this relationship: Percentage change in mass shows relative water gain or loss.
Using raw mass change instead of percentage change when initial masses differ.
Representative question
Student osmosis experiments often involve putting plant tissue such as potato cylinders in several salt solutions of different concentrations and measuring the mass before and after immersion. Outline how data collected from such an experiment could be used to estimate the osmolarity of the plant tissues.
a. (percentage) change in mass can be used;
b. plot concentration of solution on x-axis AND (percentage) change in mass on y-axis
OR
gain in mass means hypotonic (solution)/vice versa;
c. point where data line intercepts zero (\%) change in mass is osmolarity/osmotic concentration (of tissue)
OR
no change in mass means isotonic (solution);
Answer must refer to mass of (cylinders/tissue).
a. Accept increase/decrease.
b. Both axes needed for [1]
Accept sketch of graph correctly drawn and annotated e.g.
2 max
Water forms hydration shells around ions and polar solutes; hydrogen bonding and charge attraction reduce free water movement. Water moves by osmosis across partially permeable membranes from hypotonic/lower solute solutions toward hypertonic/higher solute solutions. Osmosis direction depends on internal and external solute concentration; isotonic conditions have dynamic water movement but no net osmosis. Plant tissue changes mass or length in sucrose solutions; percentage change graphs estimate isotonic or osmotic concentration. Animal cells can lyse in hypotonic solutions and crenate in hypertonic solutions; freshwater protists use contractile vacuoles to expel excess water. Plant cells become turgid in hypotonic solutions as vacuoles swell; hypertonic solutions cause flaccidity and plasmolysis from water loss. Isotonic saline prevents harmful water gain or loss in body cells; IV fluids and transplant organ baths must match tissue osmotic concentration.