D3.2 Inheritance
Inheritance explains how alleles, chromosomes, meiosis, pedigrees, linkage, variation and statistical tests predict genetic outcomes across generations in inheritance problems.
- Syllabus
- First assessment 2025
- Topic
- D3.2
- Level
- SL
Inheritance explains how alleles, chromosomes, meiosis, pedigrees, linkage, variation and statistical tests predict genetic outcomes across generations in inheritance problems.
diploid parent (two homologous copies of each autosome) → meiosis → haploid gametes (one copy) → fertilization → diploid zygote (two copies again)
| Cell | Chromosome sets | Alleles possible at one autosomal locus |
|---|---|---|
| body cell in a diploid parent | 2n | two alleles, one on each homolog |
| gamete | n | one allele |
| zygote | 2n | one allele from each parent |
Two alleles does not mean two different alleles. A diploid genotype may be homozygous, with matching alleles, or heterozygous, with different alleles.
| Term | Meaning | Example |
|---|---|---|
| gene | DNA sequence with a functional product or role | a gene affecting pea height |
| locus | the gene's position on a chromosome | the height-gene position |
| allele | one sequence version at that locus | T or t |
| genotype | allele combination carried | TT, Tt or tt |
Use genotype for the allele combination, not for the visible trait. A genotype can be written for one locus, several loci or the whole genome, so state the scope when it matters.
A phenotype is an observable or measurable characteristic produced by the genotype, the environment, or an interaction between them.
| Main cause | Example | Why |
|---|---|---|
| genotype | ABO blood group | inherited alleles determine A and B antigens |
| environment | an acquired scar | injury changes tissue without changing inherited alleles |
| genotype × environment | adult height | growth potential interacts with nutrition and health |
The same phenotype can come from different genotypes, and one genotype can produce different phenotypes in different environments. Phenotype alone therefore does not always identify genotype.
Under complete dominance, a dominant allele determines the heterozygous phenotype. A recessive phenotype appears only when no dominant allele is present.
| Genotype | Allele state | Phenotype when T is dominant |
|---|---|---|
| TT | homozygous dominant | tall |
| Tt | heterozygous | tall |
| tt | homozygous recessive | dwarf |
Dominant does not mean better, stronger or more common. It only describes expression in a heterozygote; a harmful or rare allele can be dominant.
Emasculation and isolation prevent self-pollination, so the experimenter knows the parental sources of both gametes. Reciprocal crosses can also test whether switching the pollen and ovule parents changes the result.
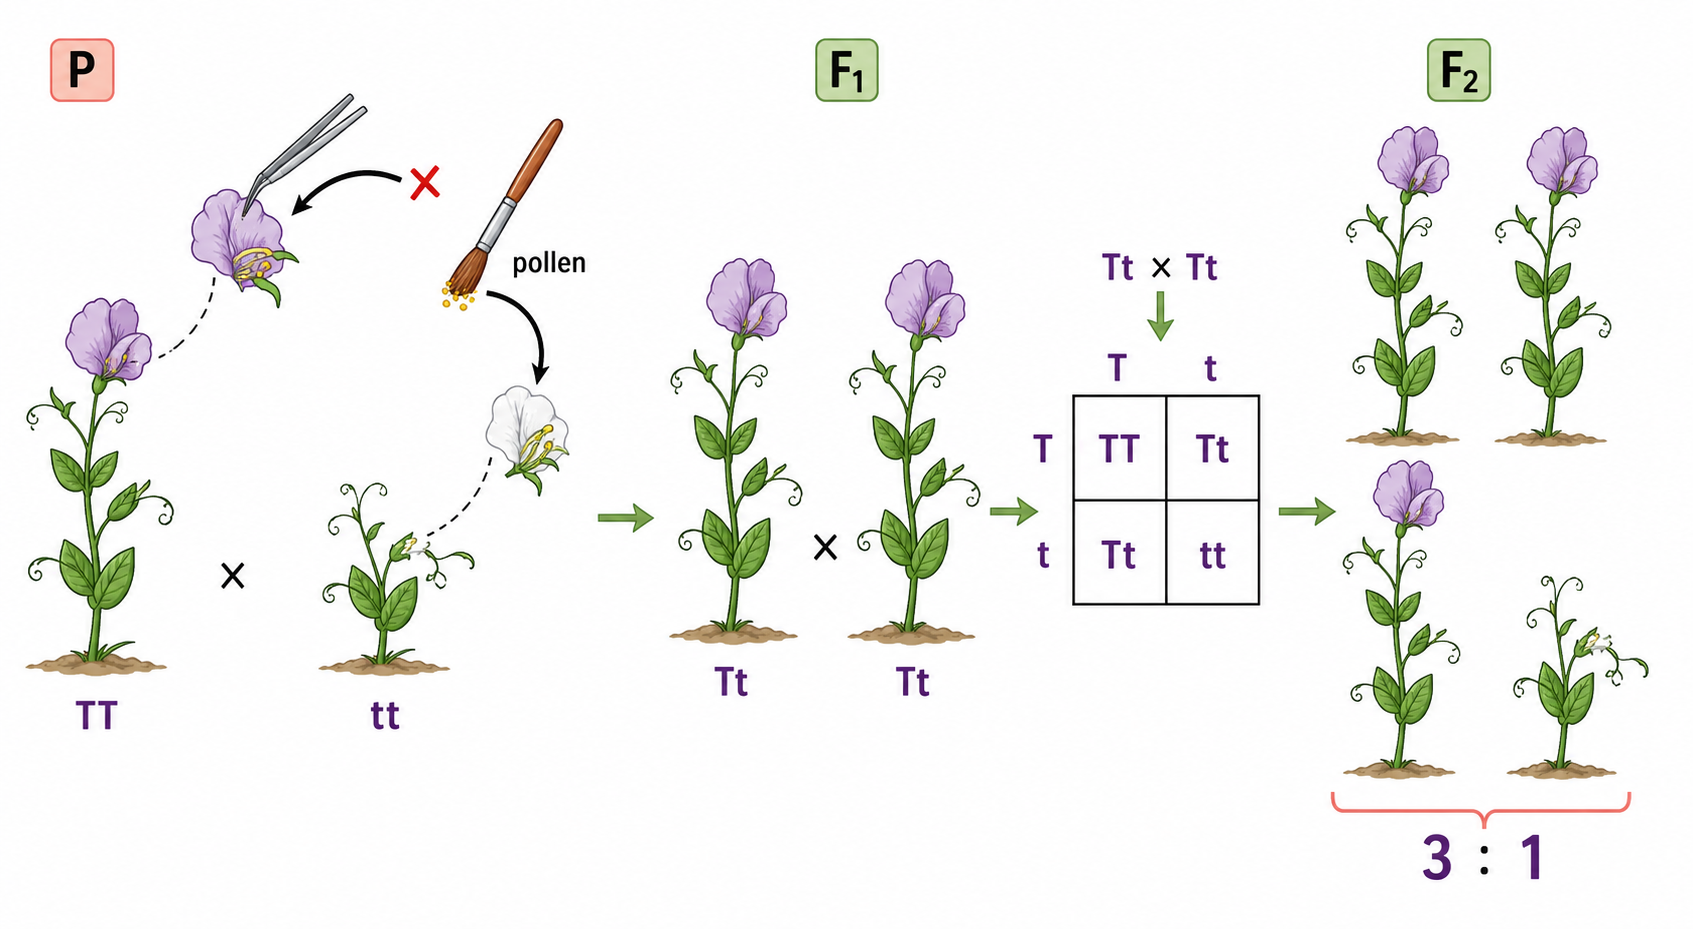
P generation: true-breeding tall TT × true-breeding dwarf tt → every gamete carries T or t, respectively.
F1 generation: every offspring is Tt and tall. The t allele has not blended away; its phenotypic effect is masked in the heterozygote.
F1 self-cross: Tt × Tt → F2 genotypes 1 TT : 2 Tt : 1 tt → phenotypes 3 tall : 1 dwarf in a large sample.
Reappearance of dwarf offspring shows that hereditary factors remain discrete across generations. The observed ratio approaches the probability prediction only when many offspring are counted.
| Tt × Tt | T gamete | t gamete |
|---|---|---|
| T gamete | TT, tall | Tt, tall |
| t gamete | Tt, tall | tt, dwarf |
Each cell has probability 1/4 because each parent produces T and t gametes with probability 1/2. The grid predicts probabilities for each fertilization, not a guarantee that every four offspring will contain one of each cell.
A tall plant could be TT or Tt because both contain the dominant T allele. Cross the unknown plant with a homozygous recessive tester, tt, whose gametes reveal what the unknown parent contributes.
| Unknown parent | Cross with tt | Expected offspring evidence |
|---|---|---|
| TT | TT × tt | all Tt, all tall |
| Tt | Tt × tt | about 1 Tt tall : 1 tt dwarf |
A small all-tall sample does not prove the parent is TT because a heterozygote can produce tall offspring repeatedly by chance. Confidence increases as more offspring are scored.
Phenotypic plasticity is the capacity of one genotype to develop different phenotypes in different environments by changing patterns of gene expression.
environmental cue → signalling pathway → transcription or translation changes → different proteins, cell activity or growth → phenotype better matched to the experienced environment
| Plastic response | Genetic evolution |
|---|---|
| genotype is unchanged within the individual | allele frequencies change across generations |
| can be reversible during a lifetime | inherited population change is not reversed by one individual's environment |
| response range itself can be inherited | selection acts on heritable differences |
A suntan or training response is acquired plasticity; it does not mean the altered phenotype is encoded as a new allele and passed directly to offspring.
two loss-of-function PAH alleles → little or no phenylalanine hydroxylase → phenylalanine is not converted efficiently to tyrosine → phenylalanine and harmful derivatives accumulate → untreated neural development is damaged
| Intervention | Why it helps |
|---|---|
| newborn screening | detects the metabolic problem before severe symptoms appear |
| early low-phenylalanine diet | limits substrate accumulation while still supplying controlled essential phenylalanine |
| continued monitoring | keeps blood concentrations within a safer range as diet and growth change |
The genotype does not change with treatment, but the environment does. Dietary control can greatly change the phenotype, making PKU a clear genotype–environment interaction.
| Genotype | PKU status | Reproductive meaning |
|---|---|---|
| PP | unaffected, not a carrier | passes P |
| Pp | unaffected carrier | can pass P or p |
| pp | affected | passes p |
| Pp × Pp | P gamete | p gamete |
|---|---|---|
| P gamete | PP unaffected | Pp carrier |
| p gamete | Pp carrier | pp affected |
For each pregnancy: 1/4 affected, 1/2 unaffected carrier, 1/4 unaffected non-carrier. The probability resets for every fertilization; previous children do not change the next gamete combination.
Carrier and affected are not synonyms. A heterozygous carrier has a working dominant allele and usually does not show PKU, but can transmit the recessive allele.
A single-nucleotide polymorphism (SNP) is a common difference at one nucleotide position among genomes. A SNP within or near a gene can create or mark a different allele.
| Scale | What may exist at one locus |
|---|---|
| one haploid gamete | one allele |
| one diploid individual | at most two alleles |
| a population gene pool | two, three or many alternative alleles |
Multiple alleles means several versions of one gene in the population. It does not mean that one ordinary diploid person carries every version.
| Phenotype | Possible genotype(s) | Red-cell antigen(s) |
|---|---|---|
| A | IᴬIᴬ or Iᴬi | A |
| B | IᴮIᴮ or Iᴮi | B |
| AB | IᴬIᴮ | A and B |
| O | ii | neither A nor B |
Iᴬ and Iᴮ are codominant because both antigen products appear in IᴬIᴮ. Each is dominant to i, which produces neither A nor B antigen.
Blood group is a phenotype; Iᴬ, Iᴮ and i are alleles. A person with group A or B may hide an i allele, so phenotype does not always identify genotype.
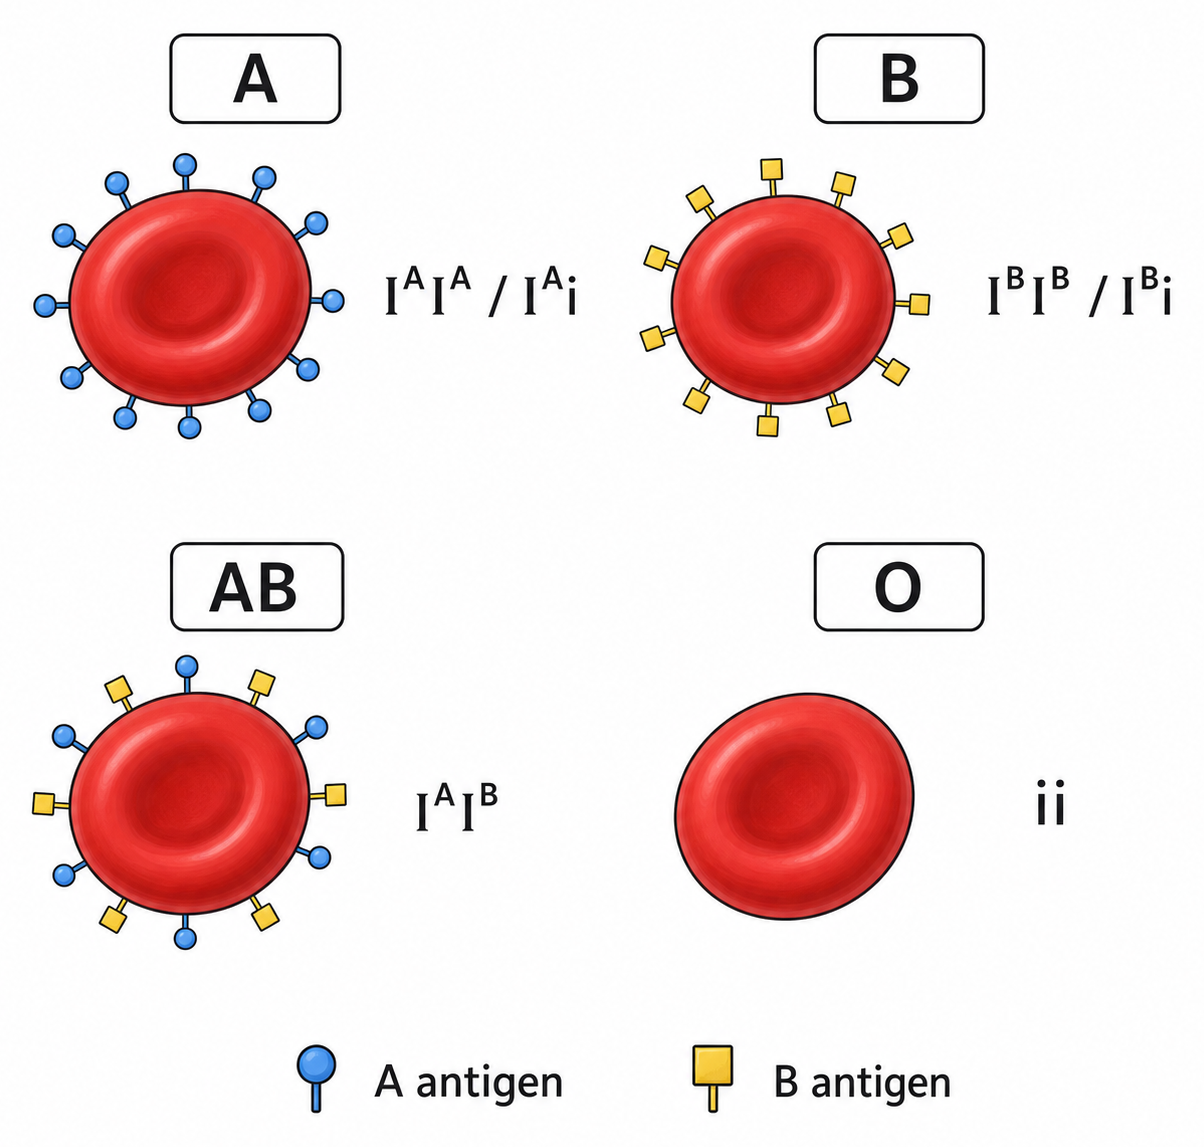
A group-A parent could be IᴬIᴬ or Iᴬi, and a group-B parent could be IᴮIᴮ or Iᴮi. State the genotype assumption before predicting children.
| Iᴬi × Iᴮi | Iᴮ gamete | i gamete |
|---|---|---|
| Iᴬ gamete | IᴬIᴮ, group AB | Iᴬi, group A |
| i gamete | Iᴮi, group B | ii, group O |
With these heterozygous parents, A, B, AB and O phenotypes each have probability 1/4. If either parent is homozygous, the outcome changes.
ABO data can sometimes exclude a proposed parent–child relationship, but common blood groups cannot uniquely prove parentage because many people share the same phenotype and genotype.
| Allele relationship | Heterozygote phenotype | Example |
|---|---|---|
| complete dominance | matches the dominant homozygote | Tt pea is tall |
| codominance | both allele products are detectably expressed | IᴬIᴮ has A and B antigens |
| incomplete dominance | intermediate between the two homozygotes | red × white Mirabilis gives pink F1 |
| Heterozygote × heterozygote | Genotype ratio | Phenotype ratio |
|---|---|---|
| complete dominance | 1:2:1 | 3:1 |
| codominance or incomplete dominance | 1:2:1 | 1:2:1 when all three genotypes are distinguishable |
Codominance is not blending: both products remain identifiable. In incomplete dominance, the heterozygote is intermediate rather than showing two separate products side by side.
P generation: FᴿFᴿ red × FᵂFᵂ white → all FᴿFᵂ pink F1 offspring.
| FᴿFᵂ × FᴿFᵂ | Fᴿ gamete | Fᵂ gamete |
|---|---|---|
| Fᴿ gamete | FᴿFᴿ red | FᴿFᵂ pink |
| Fᵂ gamete | FᴿFᵂ pink | FᵂFᵂ white |
F2 genotype ratio = phenotype ratio = 1 red : 2 pink : 1 white because the heterozygote has its own recognizable phenotype.
Segregation has not changed: each heterozygote still makes the two gamete types equally. The different phenotypic ratio comes from how the heterozygous genotype is expressed.
homologous chromosomes carry two alleles in a diploid parent → meiosis separates one allele into each gamete → fertilization restores a two-allele genotype → allele relationship and environment shape phenotype → offspring data test the prediction
For any genetic cross:
| If the simple 3:1 expectation fails | First question to ask |
|---|---|
| heterozygote has a third phenotype | incomplete dominance? |
| both products appear | codominance? |
| phenotype changes with conditions | environmental or plastic response? |
| more than two alleles occur in the population | multiple-allele locus such as ABO? |
| Gamete contribution | X-bearing sperm | Y-bearing sperm |
|---|---|---|
| X-bearing egg | XX zygote | XY zygote |
| expected probability | about 1/2 | about 1/2 |
Y chromosome with functional SRY → testis-determining factor (TDF) is produced → embryonic gonads develop as testes → testicular hormones direct typical male reproductive development
Without a functional SRY signal, the undifferentiated gonads normally follow ovarian development and typical female reproductive structures develop.
XX/XY is the core human chromosomal model, but chromosome number, SRY location or function, hormone synthesis and tissue response can vary. Chromosomal pattern alone does not describe every aspect of sex or gender.
Most genes in the non-homologous region of X have no matching allele on Y. An XY individual is therefore hemizygous for those X-linked genes: the single allele on X is expressed even if it is recessive.
| Genotype | Typical status for an X-linked recessive allele h |
|---|---|
| XᴴXᴴ | unaffected XX |
| XᴴXʰ | unaffected carrier XX |
| XʰXʰ | affected XX |
| XᴴY | unaffected XY |
| XʰY | affected XY |
Write the allele as a superscript on X, such as Xᴴ or Xʰ. Do not place the X-linked allele on Y when the gene is absent from the relevant Y region.
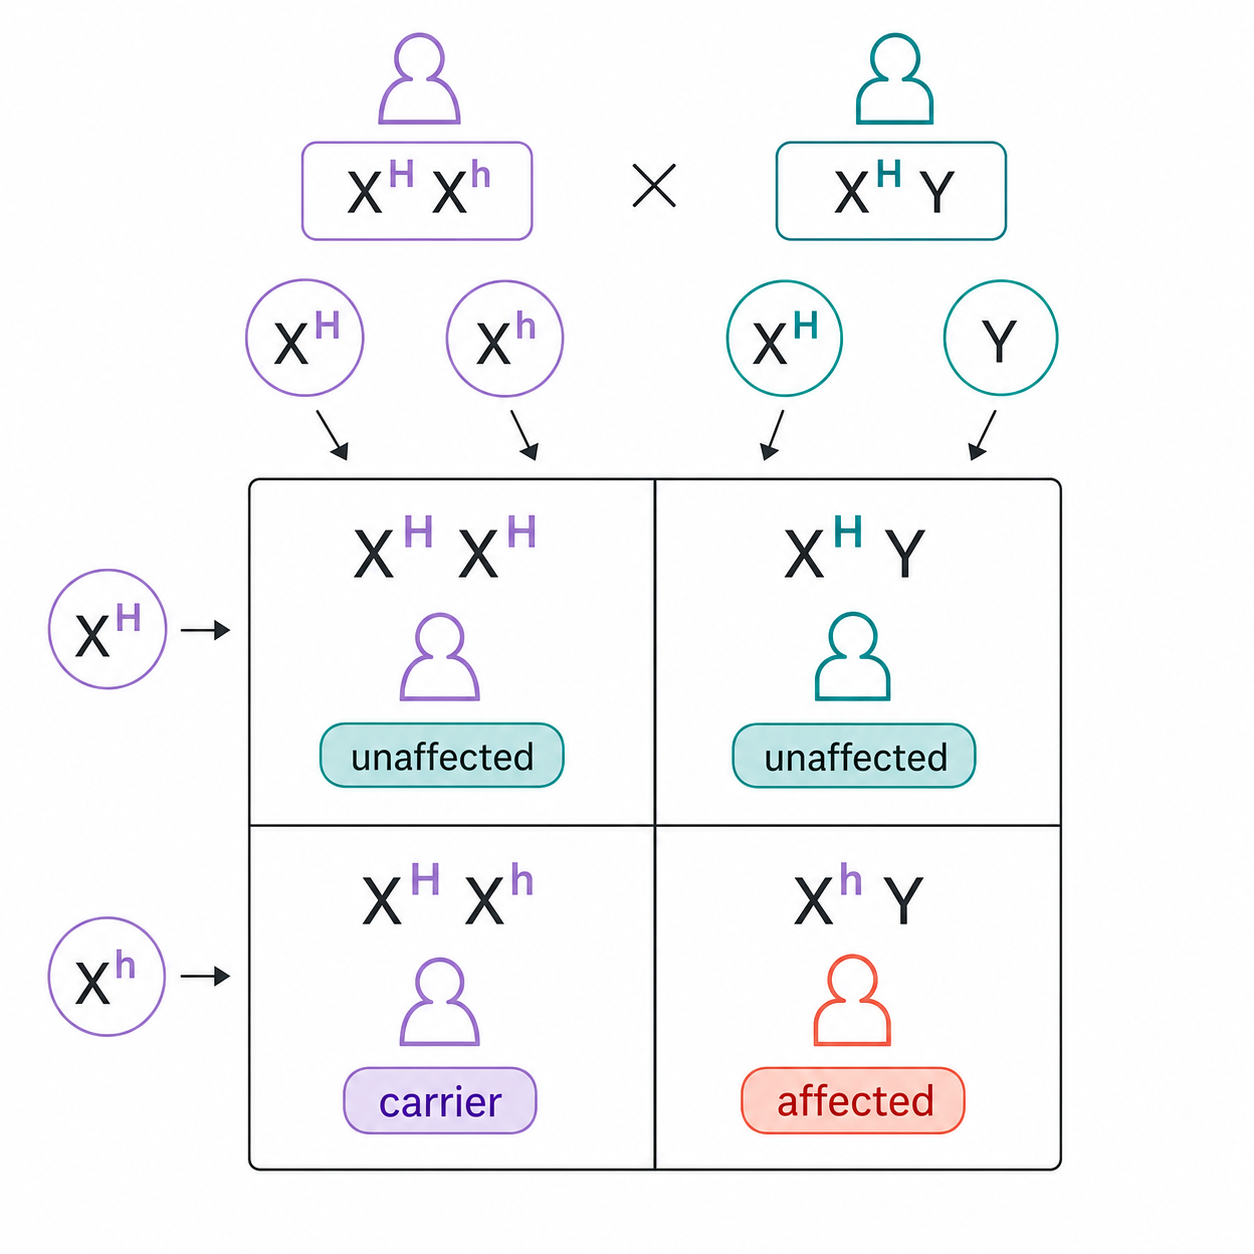
| XᴴXʰ × XᴴY | Xᴴ sperm | Y sperm |
|---|---|---|
| Xᴴ egg | XᴴXᴴ unaffected daughter | XᴴY unaffected son |
| Xʰ egg | XᴴXʰ carrier daughter | XʰY affected son |
Among daughters: 1/2 carriers and 1/2 non-carriers; none affected in this cross. Among sons: 1/2 affected and 1/2 unaffected. Across all offspring, each grid outcome has probability 1/4.
Haemophilia A and B result from deficient clotting factors. The inheritance pattern reflects an X-linked recessive allele; treatment supplies or supports the missing clotting function but does not alter the inherited allele.
| Pedigree mark | Meaning |
|---|---|
| square / circle | male / female in the standard convention |
| filled symbol | individual shows the tracked phenotype |
| horizontal partner line | mating or reproductive partnership |
| vertical descent line | offspring connection |
| shared sibship line | siblings from the same parents |
| I, II, III … | generations |
| 1, 2, 3 … | individuals within a generation |
A pedigree records observed family evidence, not every conception or every relative. Small families and missing records can make more than one inheritance model possible.
| Observation | Strong inference |
|---|---|
| two unaffected parents have an affected child | supports recessive inheritance; contradicts simple complete-dominant inheritance |
| affected person has an affected parent in every generation | supports dominance, but does not prove it alone |
| affected father has an affected son | contradicts X-linked transmission from father to son |
| affected sons arise from unaffected mothers | consistent with X-linked recessive carrier mothers |
| males and females affected similarly | supports autosomal inheritance |
Start with forced genotypes. For an autosomal recessive trait, affected people are aa; each unaffected parent of an affected child must carry a. For an X-linked recessive trait, an affected son XʰY proves that his mother supplied Xʰ.
Treat each inheritance mode as a hypothesis. Predict transmissions that must or cannot occur, compare them with the pedigree, and reject a model only when a relationship contradicts it.
Skipping a generation suggests recessiveness but is not a proof. Chance, incomplete records, late onset and variable expression can obscure the apparent pattern.
| Feature | Continuous variation | Discrete variation |
|---|---|---|
| possible values | many intermediate measurements | separate categories |
| common cause | polygenic effects plus environment | often one or few major loci |
| examples | height, body mass, skin pigmentation | ABO group, biological sex chromosome category |
| useful display | histogram or box plot | bar chart or counts table |
Ask whether the variable is measured on a scale or counted in named categories. Height remains continuous even if a researcher later groups measurements into artificial height bands.
Continuous does not mean every imaginable value must occur in one sample, and discrete does not mean the categories are controlled by only one allele.
In polygenic inheritance, several loci contribute to one characteristic. Different combinations of small allele effects generate many genotypic values rather than a few Mendelian phenotype classes.
many contributing genotypes + nutrition, health, temperature or other environmental effects + genotype-specific responses to those conditions → overlapping phenotypes across a continuous range
| Trait | Genetic contribution | Environmental contribution |
|---|---|---|
| height | many growth-related loci | nutrition, disease and developmental conditions |
| body mass | metabolism and appetite loci | diet, activity and health |
| skin pigmentation | several melanin-related loci | ultraviolet exposure changes melanin production |
Do not confuse multiple genes contributing to one trait with multiple alleles at one gene locus. These are different levels of genetic variation.
A common rule marks values below Q1 − 1.5 × IQR or above Q3 + 1.5 × IQR as outliers. Check the convention used before treating the raw minimum and maximum as whisker ends.
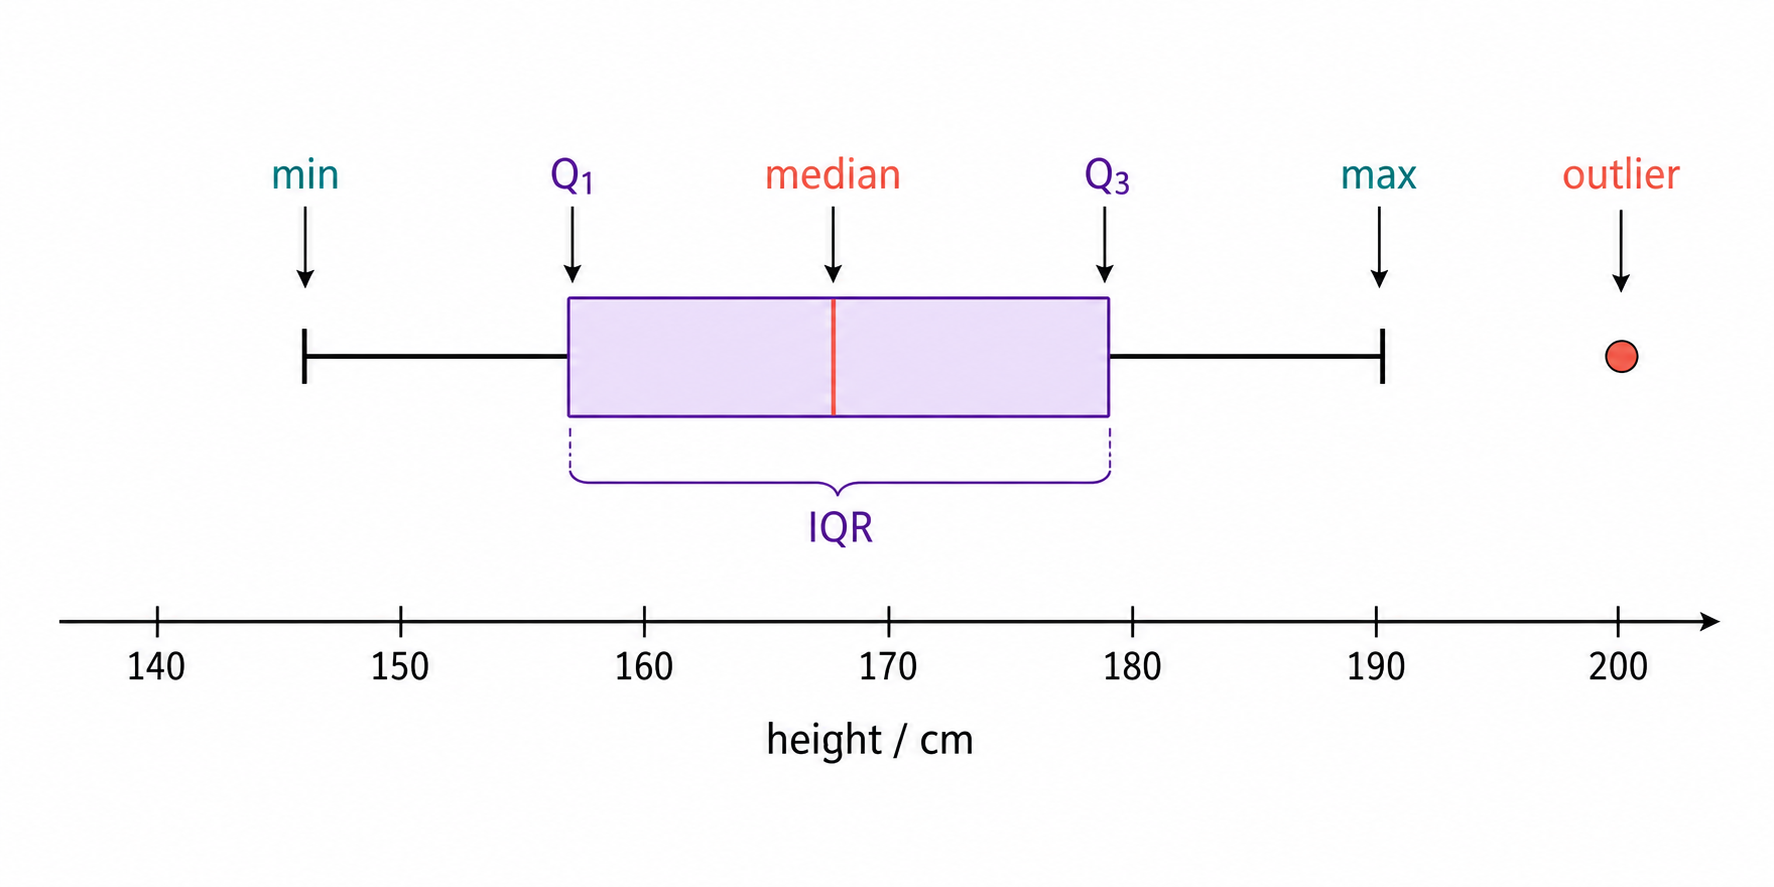
| Feature | What to compare |
|---|---|
| median line | typical central value |
| box length, IQR | spread of the middle 50% |
| whiskers | spread beyond the quartiles among non-outliers |
| isolated points | potential outliers requiring biological or measurement review |
| overlap between boxes | descriptive overlap, not automatically a significance test |
If group A has a higher median but strongly overlapping boxes with group B, report both observations. Do not erase the overlap or claim a significant difference without an appropriate inferential test.
A box plot does not show sample size, separate peaks or every raw value unless these are added. Two very different distribution shapes can share the same median and quartiles.
X and Y contributions establish the usual chromosomal starting point → unequal X-linked gene dosage changes inheritance risk → pedigrees reveal transmission across families → polygenes and environment create continuous population variation → box plots summarize centre and spread
| Evidence source | Reliable question |
|---|---|
| X-linked cross | which parent supplies the allele to sons or daughters? |
| pedigree | which inheritance hypotheses are contradicted by family relationships? |
| continuous measurements | where is the median and how wide is the middle 50%? |
| apparent outlier | biological extreme, data error or different process? |
Match the claim to the evidence scale. One Punnett grid predicts a fertilization probability, a pedigree constrains family genotypes, and a box plot describes a sample distribution; none alone proves a universal biological rule.
[ 1 ]
For what reason do gametes contain only one allele of each gene?
[ 3 ]
L. purpureus can have purple or white flowers. Two pure-breeding varieties were crossed: HA 4 with white flowers and GL 424 with purple flowers. All of the F1 plants had purple flowers. The F1 plants were self-pollinated to produce an F2 generation. There were 97 plants with purple flowers and 38 plants with white flowers in the F2 generation.
Using a Punnett grid, explain the results of this cross.
[ 1 ]
Define the term genotype.
[ 2 ]
Identify the phenotypes of each part of the phenotypic ratio.
| Ratio | Phenotypes |
|---|---|
| 9 | |
| 3 | |
| 3 | |
| 1 |
[ 4 ]
Many genetic diseases are due to recessive alleles of autosomal genes that code for an enzyme. Using a Punnett grid, explain how parents who do not show signs of such a disease can produce a child with the disease.
[ 1 ]
Scientists incubated larvae of the moth Utetheisa ornatrix at either 15∘C or 22∘C until they hatched. They found the hatched moths had different wing colour patterns due to phenotypic plasticity.
Moth from larvae incubated at \(15^{\circ
Moth from larvae incubated at \(22^{\circ
Which of the following explains the observed differences in wing colour?
[ 4 ]
Discuss the causes and treatments of phenylketonuria.
[ 1 ]
Which statement defines alleles?
[ 9 ]
Describe the inheritance of ABO blood groups.
[ 1 ]
A Mirabilis jalapa plant with red flowers was crossed with one with white flowers. All plants in the F1 generation had pink flowers. What phenotype ratio would be expected in the F2 generation?
[ 4 ]
Distinguish between autosomes and sex chromosomes in humans.
[ 8 ]
Explain how males inherit hemophilia and how females can become carriers for the condition.
[ 2 ]
Explain how the pedigree chart shows that the dominant allele causing PKD is not on the X chromosome.
[ 7 ]
Explain the reasons for variation in human height.
[ 3 ]
Using the data, deduce whether the incidence of CHF or the incidence of anemia has a greater effect on the blood hepcidin concentration.