
Edexcel IGCSE Physics Rate of Change Graphs

Edexcel IGCSE Physics Rate of Change Graphs
Edexcel IGCSE Physics syllabusPhysics 4PH1Issue 4 (2024)

Practise Edexcel IGCSE Physics rate-of-change graphs by matching current-time graph shapes to descriptions of how a quantity changes.

How this is tested

  • Match current-time graph shapes to descriptions of increasing, decreasing or changing current.

Question 2

The diagram shows four graphs, P, Q, R and S. Each graph shows a different relationship between current and time.
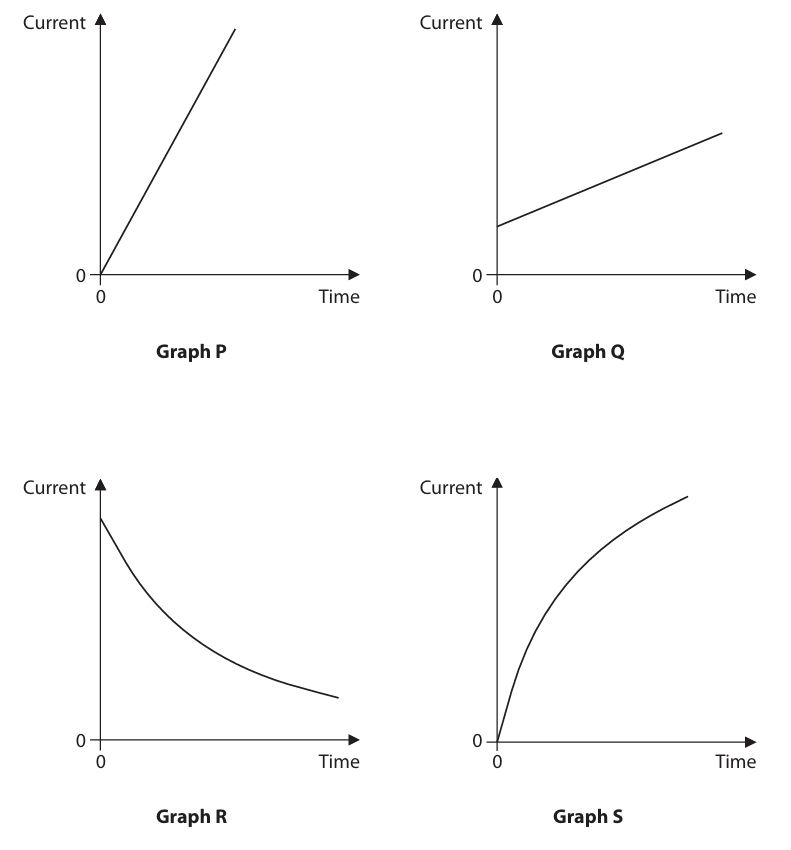
Figure for Question 2 — Edexcel IGCSE Physics

The table gives descriptions of the relationships between current and time shown by graphs P, Q, R and S.

Complete the table by giving the correct graph for each description.
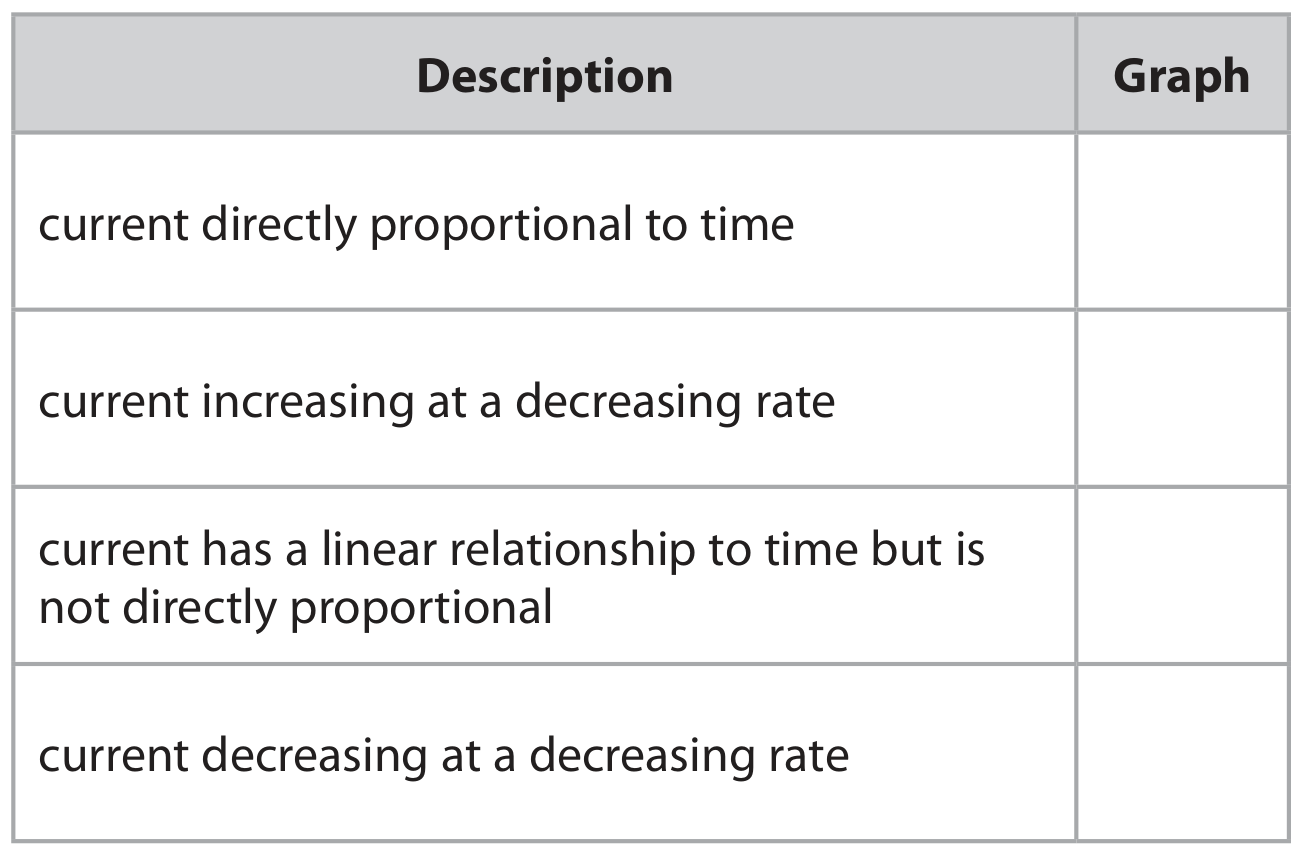
Table for Question 2 — Edexcel IGCSE Physics