
Edexcel IGCSE Physics Plot Two Variables

Edexcel IGCSE Physics Plot Two Variables
Edexcel IGCSE Physics syllabusPhysics 4PH1Issue 4 (2024)

Practise Edexcel IGCSE Physics plotting two variables by choosing scales, labelling axes, plotting points and adding an appropriate best-fit curve.

How this is tested

  • Choose sensible linear scales and label both axes with quantities and units.
  • Plot all data points accurately to the nearest half square on the graph grid.
  • Draw a smooth curve or suitable best-fit line after plotting the two variables.

Question 10(c)(ii)

[Maximum number: 2]

Diagram 1 shows the apparatus a student uses to investigate the bending of a wooden strip.

Part of the wooden strip is clamped to a table.
A load is fixed to the free end of the wooden strip, causing it to bend.
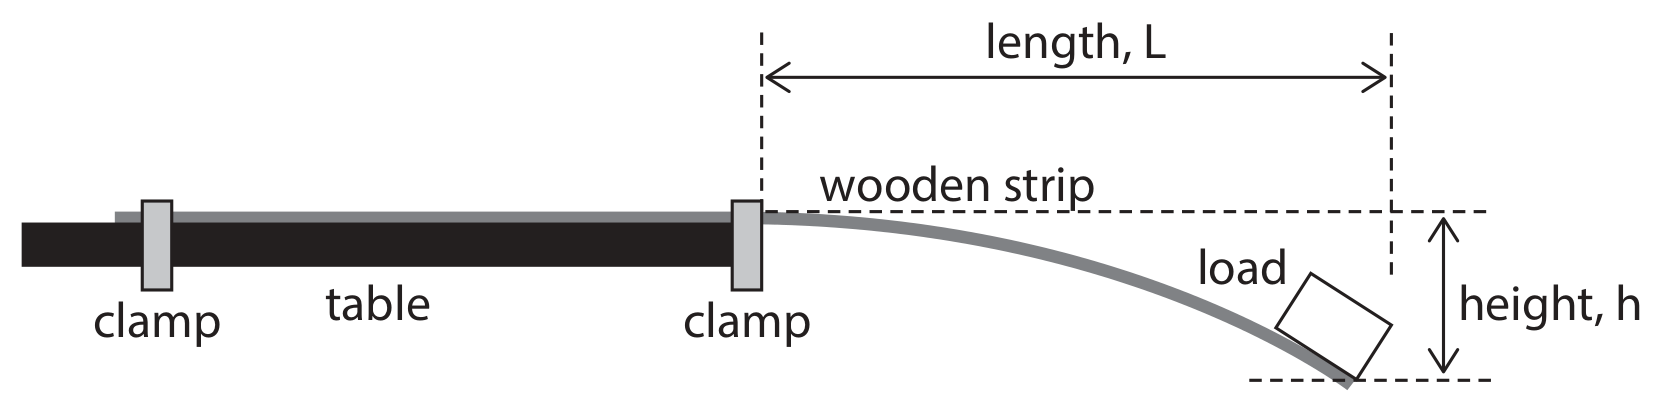
Diagram 1

Diagram 1

The free end of the wooden strip is positioned a length, L , beyond the edge of the table, as shown in diagram 1.

The weight of the load causes the end of the wooden strip to move down through a height, h.

A student investigates how the length, L , affects the height, h .

The table shows the results of the investigation.
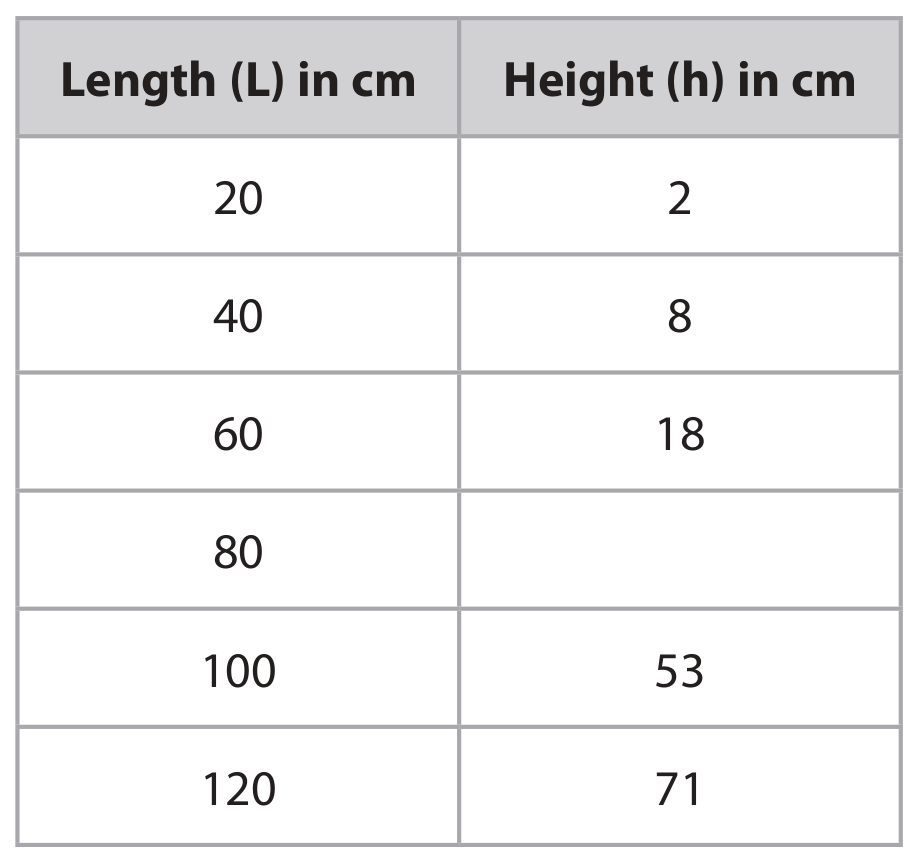
Table for Question 10(c)(ii) — Edexcel IGCSE Physics

Plot a graph of the student's results.