
Question 8(d)(iv)
A student uses this apparatus to investigate how the efficiency of an electric motor varies with its input voltage.
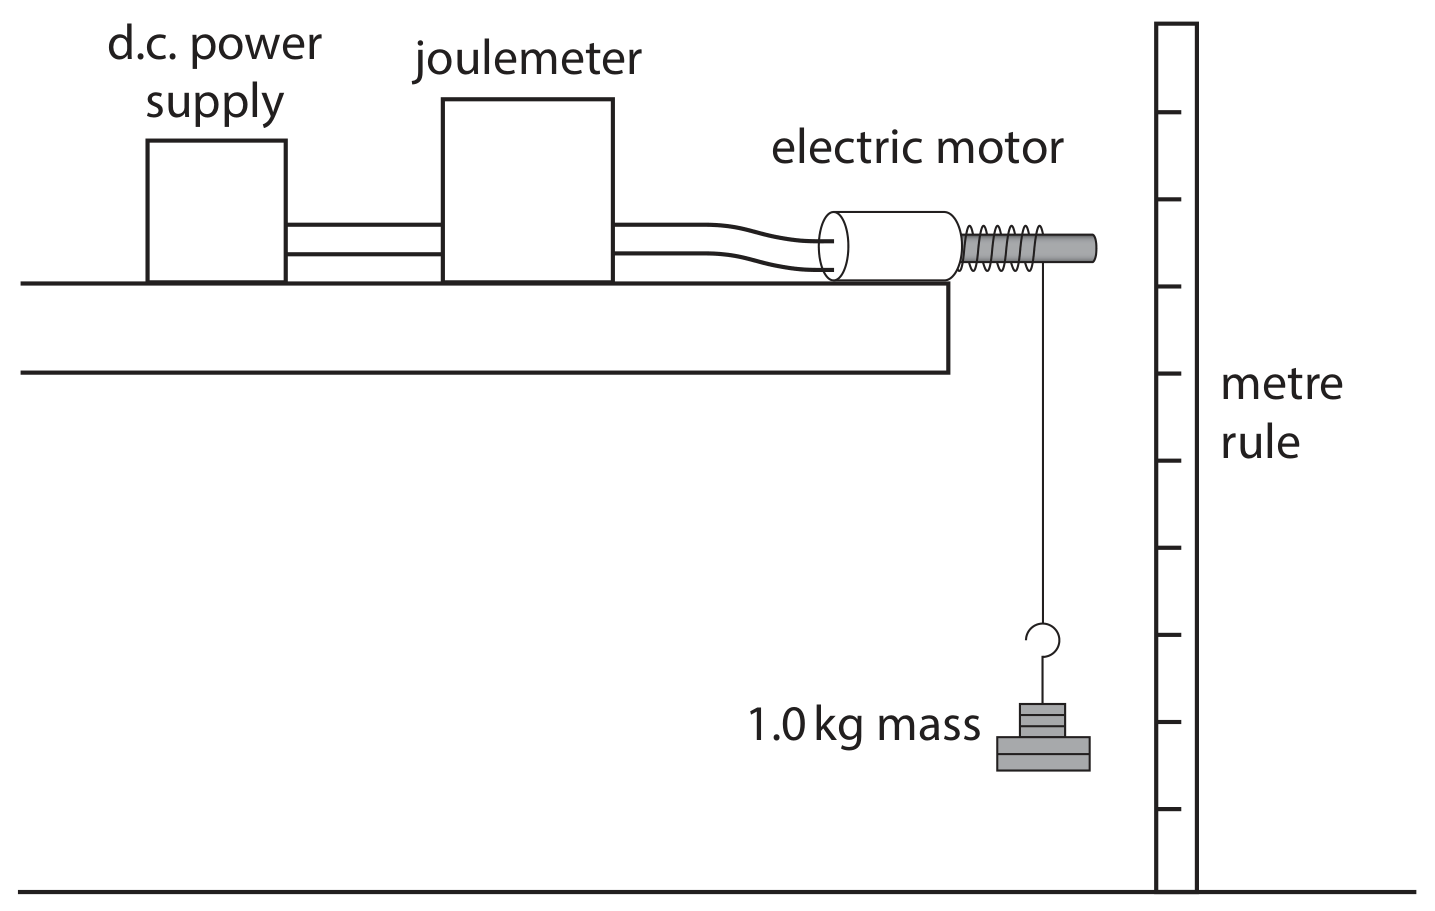
This is the student's method.
- connect the electric motor to a d.c. power supply and a joulemeter
- attach a 1.0 kg mass to the electric motor using a length of string
- set the voltage of the power supply to 10 V and switch on the power supply
- switch off the power supply when the mass has been lifted through a distance of 50 cm
- record the input energy to the motor from the joulemeter
- calculate the energy transferred to the gravitational store of the mass
- calculate the efficiency of the motor
The student repeats this process, setting the power supply to a different voltage each time.
The table shows the student's results.
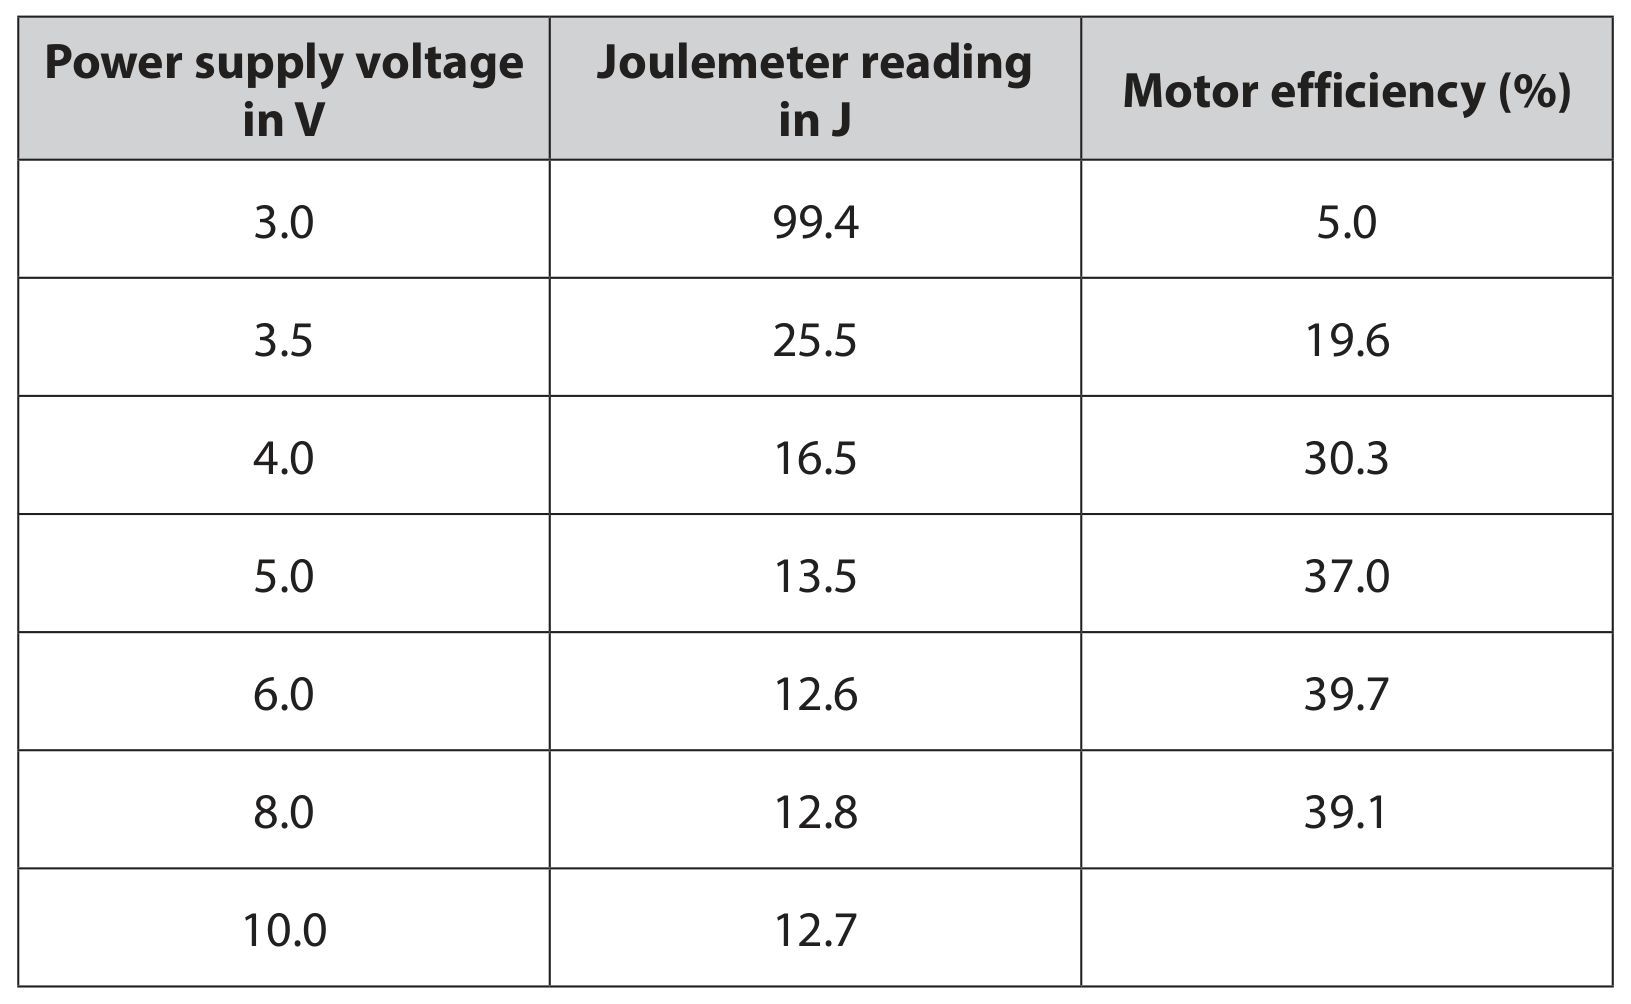
Using the graph, determine the minimum power supply voltage that will allow the electric motor to operate at maximum efficiency.
voltage = ............ V