CAIE IGCSE Mathematics Extended E9.6.2 Quantiles from Cumulative Frequency
Practise estimating medians, quartiles, percentiles and interquartile ranges from cumulative-frequency diagrams.
- Syllabus
- 2028–2030
- Objective
- E9.6.2
- Level
- Extended
Practise estimating medians, quartiles, percentiles and interquartile ranges from cumulative-frequency diagrams.
200 students estimate the volume, , of a classroom. The cumulative frequency diagram shows their results.
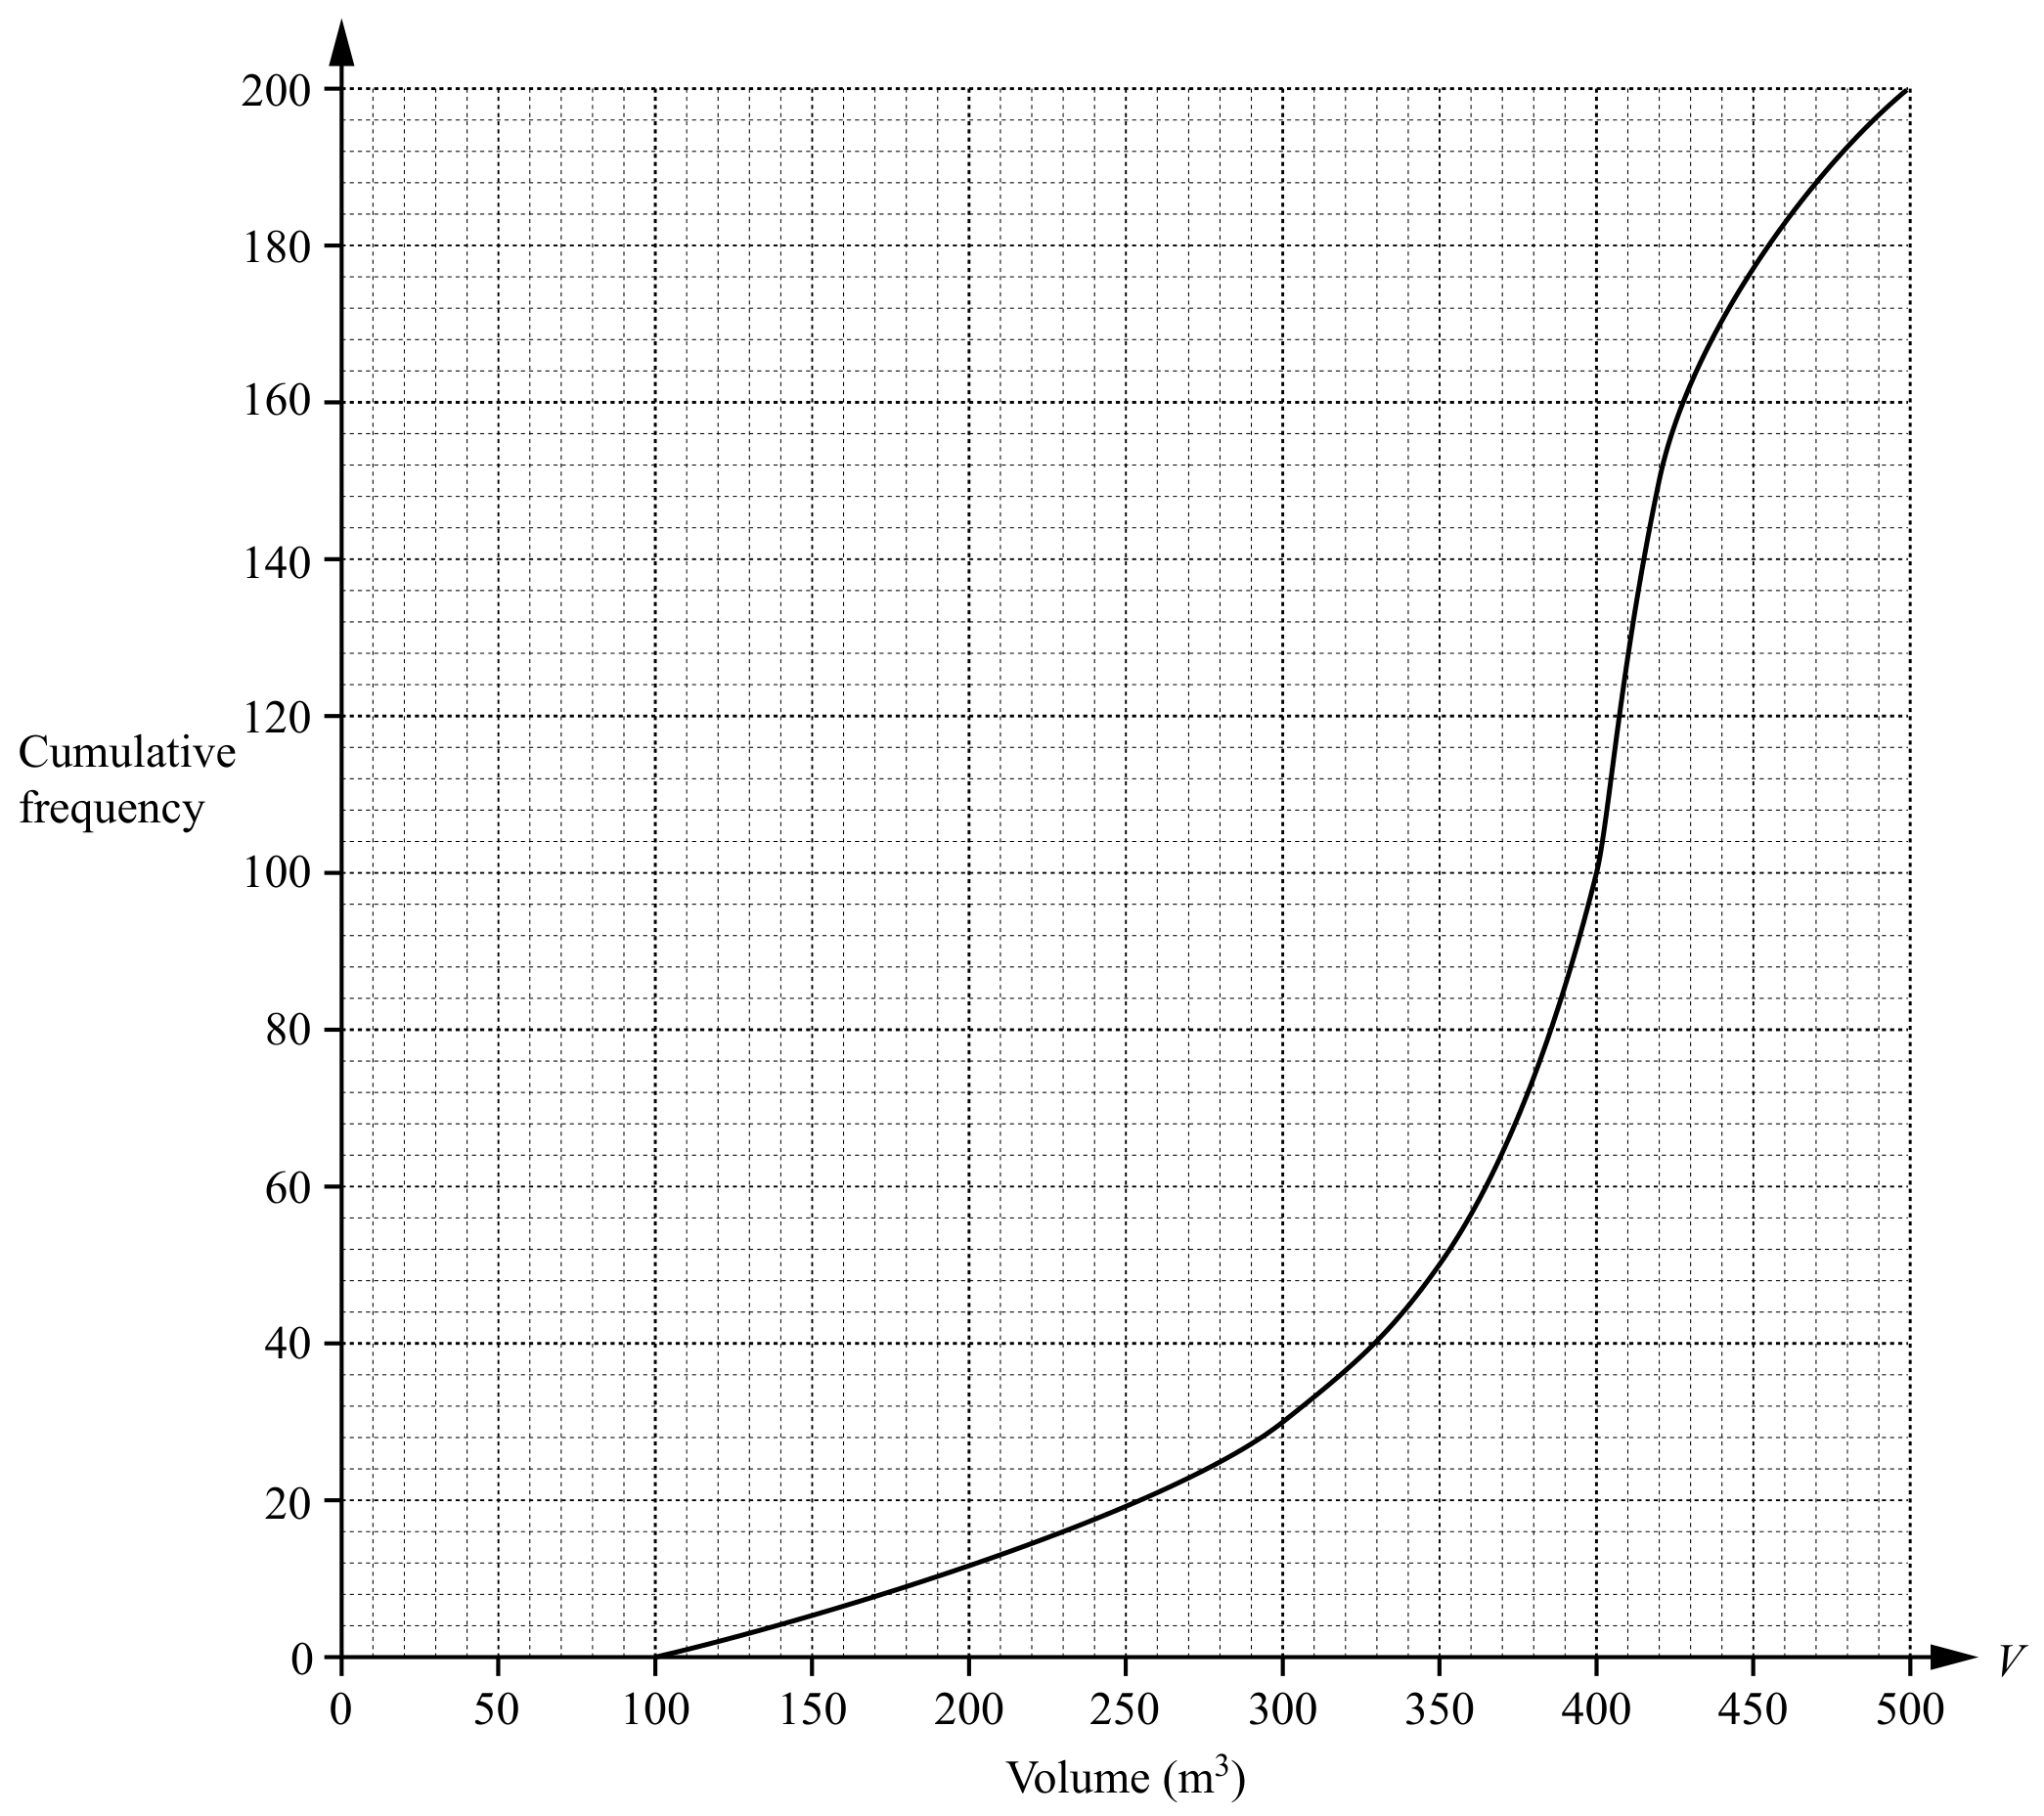
Use the graph to find an estimate of
the 60th percentile,
___ m^3