CAIE IGCSE Mathematics Extended E9.2.2 Comparing Data Sets
Practise comparing typical value and spread using tables, graphs, medians, ranges and interquartile ranges.
- Syllabus
- 2028–2030
- Objective
- E9.2.2
- Level
- Extended
Practise comparing typical value and spread using tables, graphs, medians, ranges and interquartile ranges.
The box-and-whisker plot shows information about the marks scored by some students in a test.
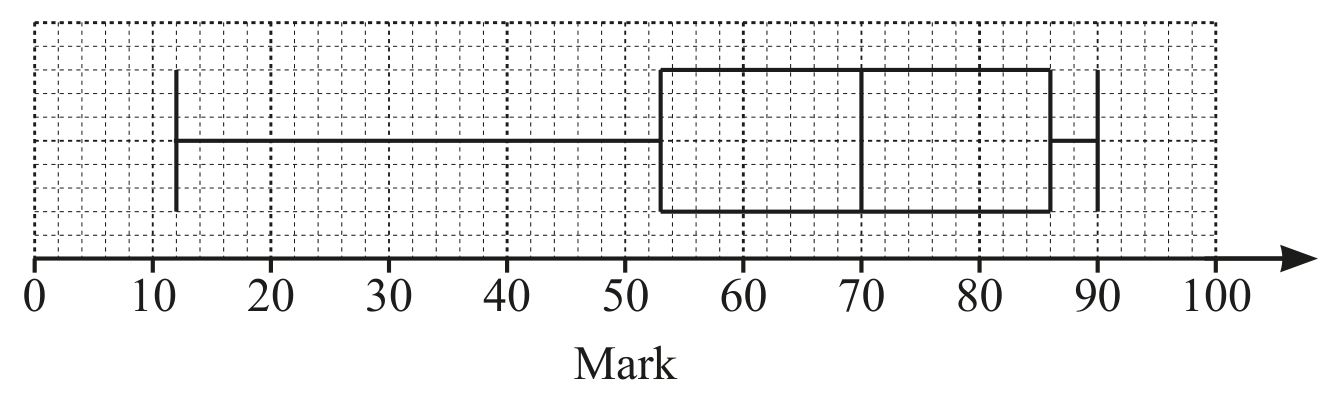
This box-and-whisker plot shows information about the marks scored by the same students in a second test.
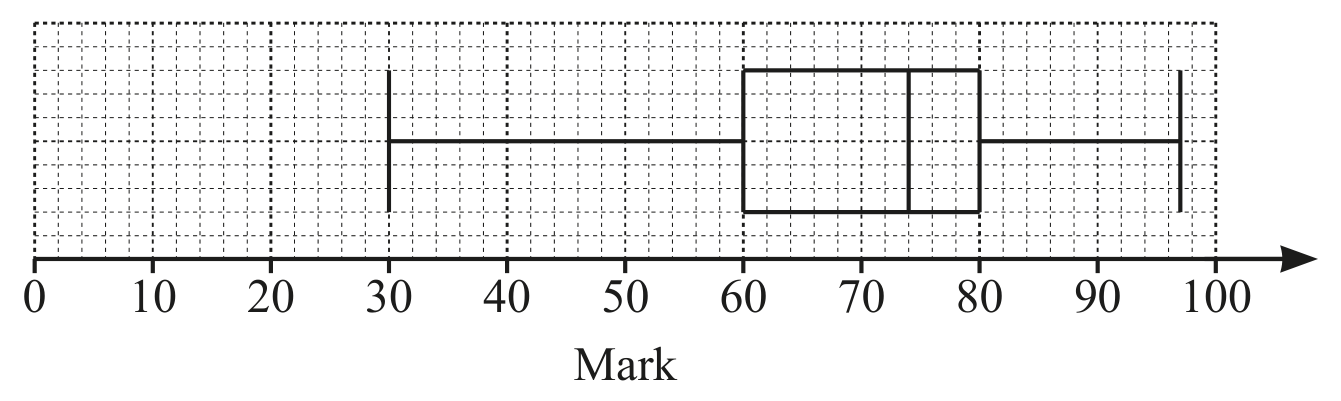
Make one comparison between the distributions of marks in the two tests.