CAIE IGCSE Mathematics Extended E9.2.1 Read, interpret & draw inferences from tables & statistical

Practise extracting values and making inferences from statistical tables and diagrams, including box plots and real data contexts.

Syllabus
2028–2030
Objective
E9.2.1
Level
Extended

Exam points

  • use quartiles from a box plot to estimate how many values exceed a given threshold

E9.2.1 Read, interpret and draw inferences from tables and statistical question 1

[Maximum number: 1]

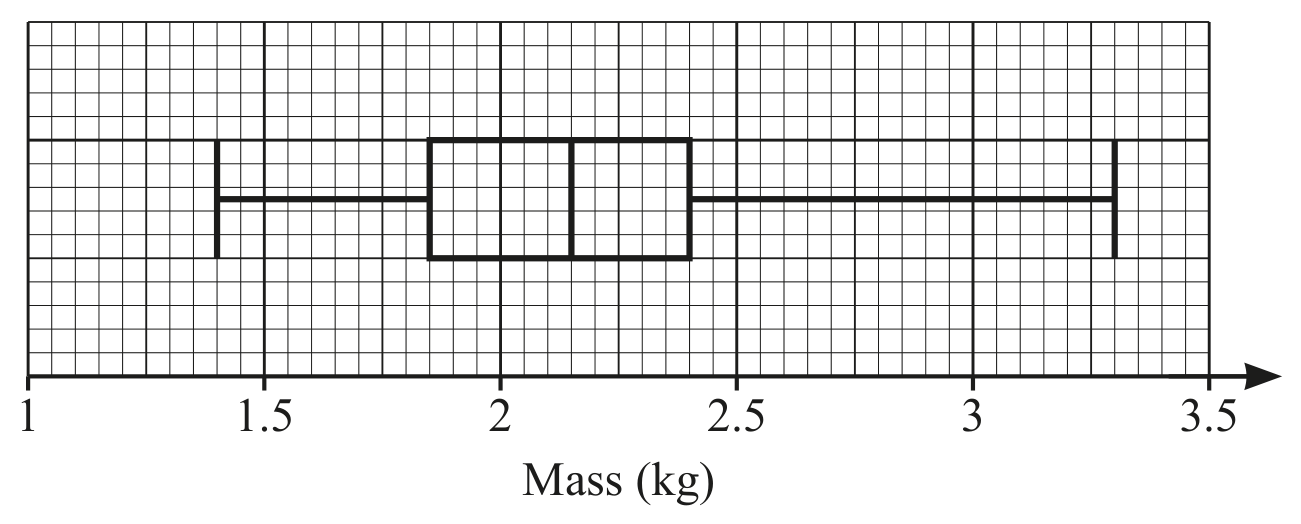
The box-and-whisker plot shows information about the mass, in kg, of some parcels.

Figure for Question E9.2.1 Read, interpret and draw inferences from tables and statistical question 1 — CAIE IGCSE Mathematics Extended

Find the mass of the heaviest parcel.
kg\mathrm{kg}

All question bank results loaded