EduNinja

S2.2 Collecting and processing data Topic Practice

S2.2 Collecting and processing data Topic Practice
IB Physics syllabusPhysics SL/HLFirst assessment 2025

Turn raw measurements into evidence by averaging, checking proportionality, plotting graphs, and judging whether data support a model.

Exam points

  • test direct proportionality with table ratios or a graph passing through the origin
  • find a missing plotted point from the original data table, then place it with correct coordinates and scale
  • judge reliability from repeats, anomalies, and whether error bars or the best-fit line support the model assumption

Question 1

[Maximum number: 4]

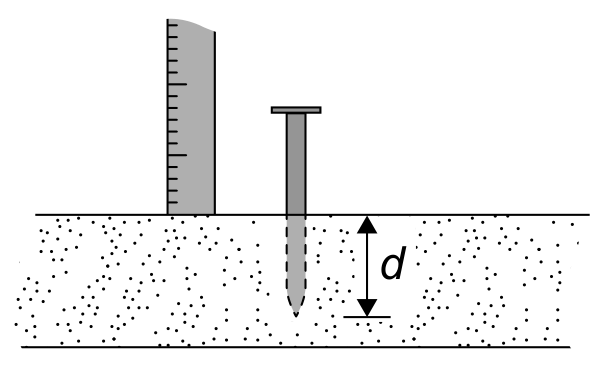
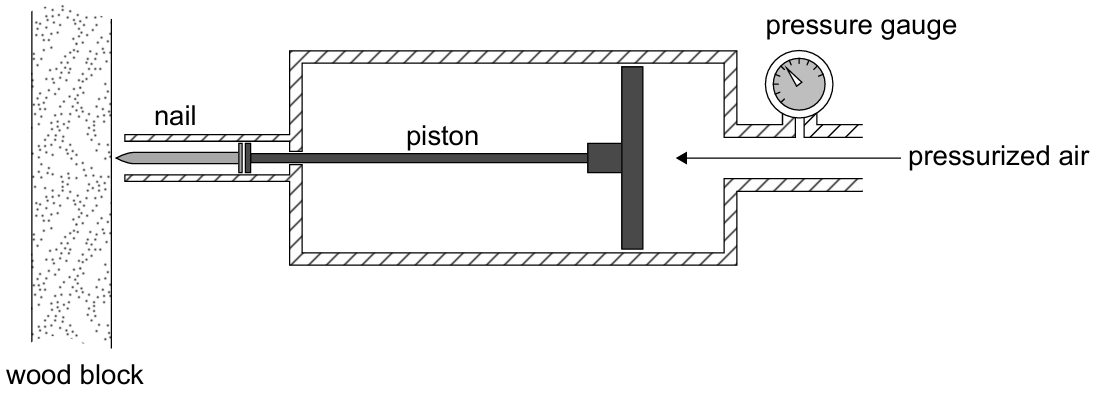
A group of students uses pressurized air to move a piston that forces a nail into a block of wood. A gauge is used to measure the pressure P of compressed air above atmospheric pressure. The nail enters the wood perpendicular to its surface.
Question image

The students use a ruler to measure the length of the nail which remains above the surface of the wood as shown. The depth of the nail inside the wood is d. All necessary length measurements are recorded using a ruler with uncertainty ±1 mm\pm 1 \mathrm{~mm}.

Question image

Question 1(b)

(a)

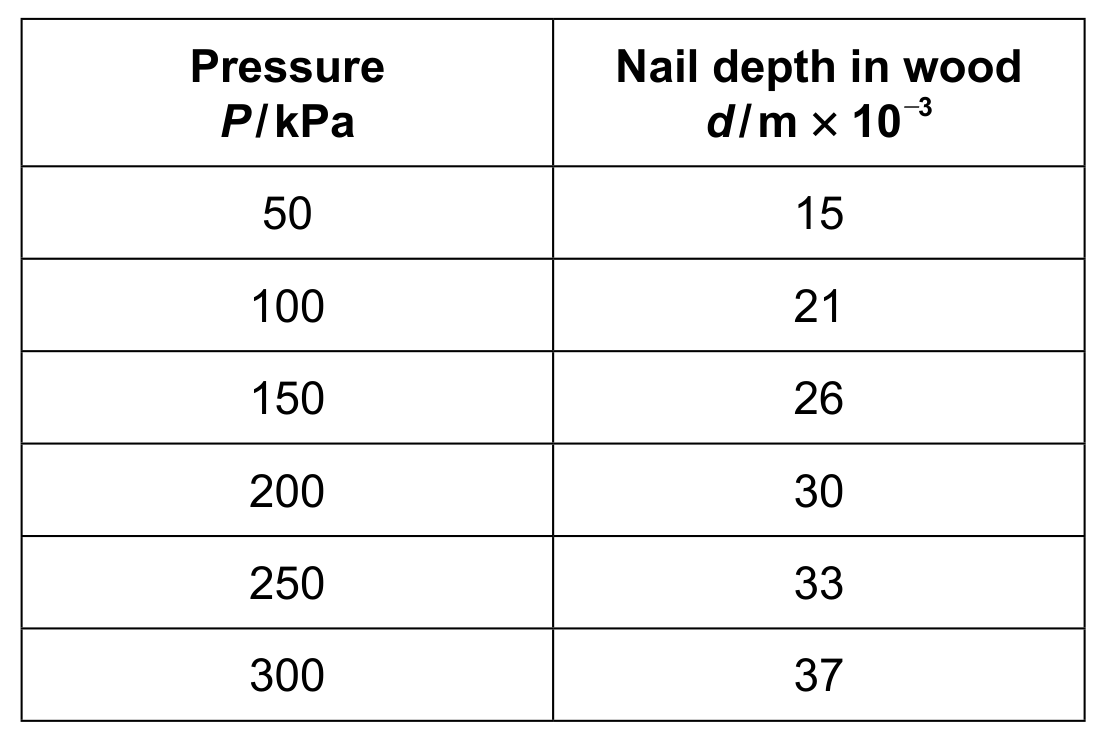
The students systematically increase the pressure and calculate d.
Table
[ 2 ]

Question 1(b)(iv)

(i)

By using two sets of data in the table, show that the relationship between d and P is not directly proportional.

[ 2 ]

Question 1(c)

(b)

The students suggest the following relationship between d and P :

d=kPd=k \sqrt{P}

where k is a constant.
To verify the relationship, the variation of d with P\sqrt{P} is plotted.
One data point is missing.
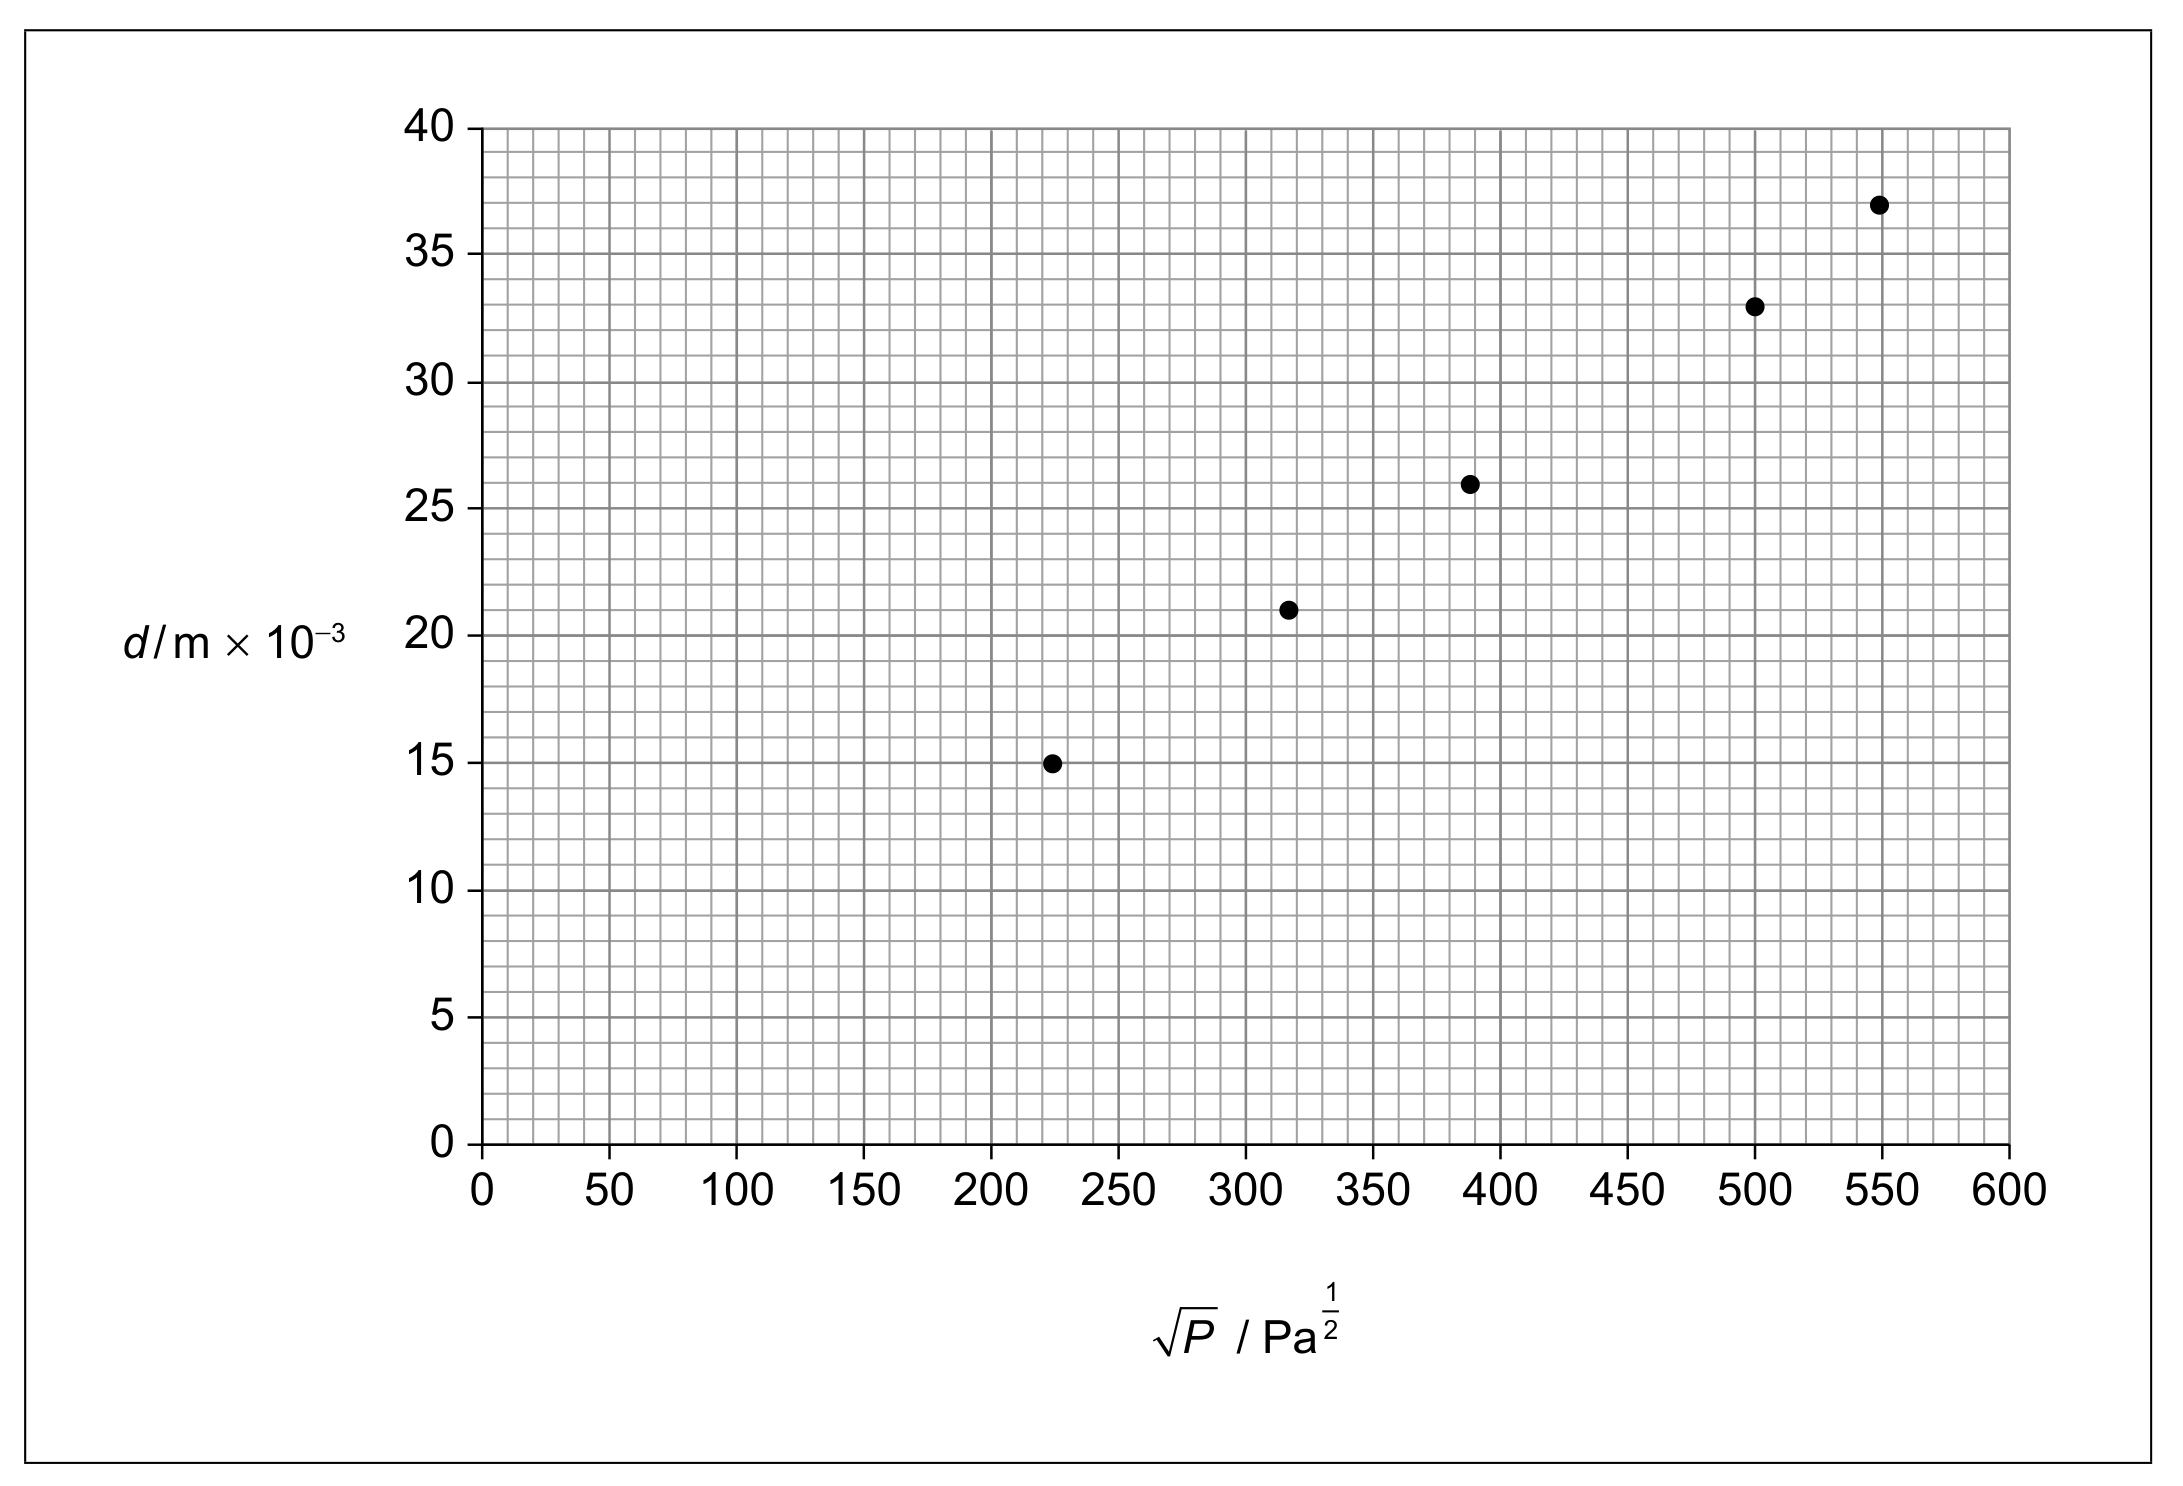
Question image
[ 1 ]

Question 1(c)(i)

(i)

Determine the coordinates of the missing point using the original data set and plot it on the graph.

[ 1 ]

Question 1(d)

(c)

The students collect only one value of d for each value of P. Suggest why this is a poor method.

[ 1 ]

Question 1(c)(i)

[Maximum number: 2]

A student determines the resistivity ρ\rho of a metal that is in the form of a cylindrical wire. The student makes the following measurements:

 Length L of the wire =(462±2)mm\text { Length } L \text { of the wire }=(462 \pm 2) \mathrm{mm}
Readings for the diameter d of the wire:

Readings for the diameter d of the wire:

 Resistance R of the wire =13.7Ω±1.5%\text { Resistance } R \text { of the wire }=13.7 \Omega \pm 1.5 \%

Show that the mean diameter of the wire is about 0.2 mm .

Question 1(c)(i)

[Maximum number: 2]

A student determines the resistivity ρ\rho of a metal that is in the form of a cylindrical wire. The student makes the following measurements:

 Length L of the wire =(462±2)mm\text { Length } L \text { of the wire }=(462 \pm 2) \mathrm{mm}
Readings for the diameter d of the wire:

Readings for the diameter d of the wire:

 Resistance R of the wire =13.7Ω±1.5%\text { Resistance } R \text { of the wire }=13.7 \Omega \pm 1.5 \%

Show that the mean diameter of the wire is about 0.2 mm .

Question 1

[Maximum number: 3]

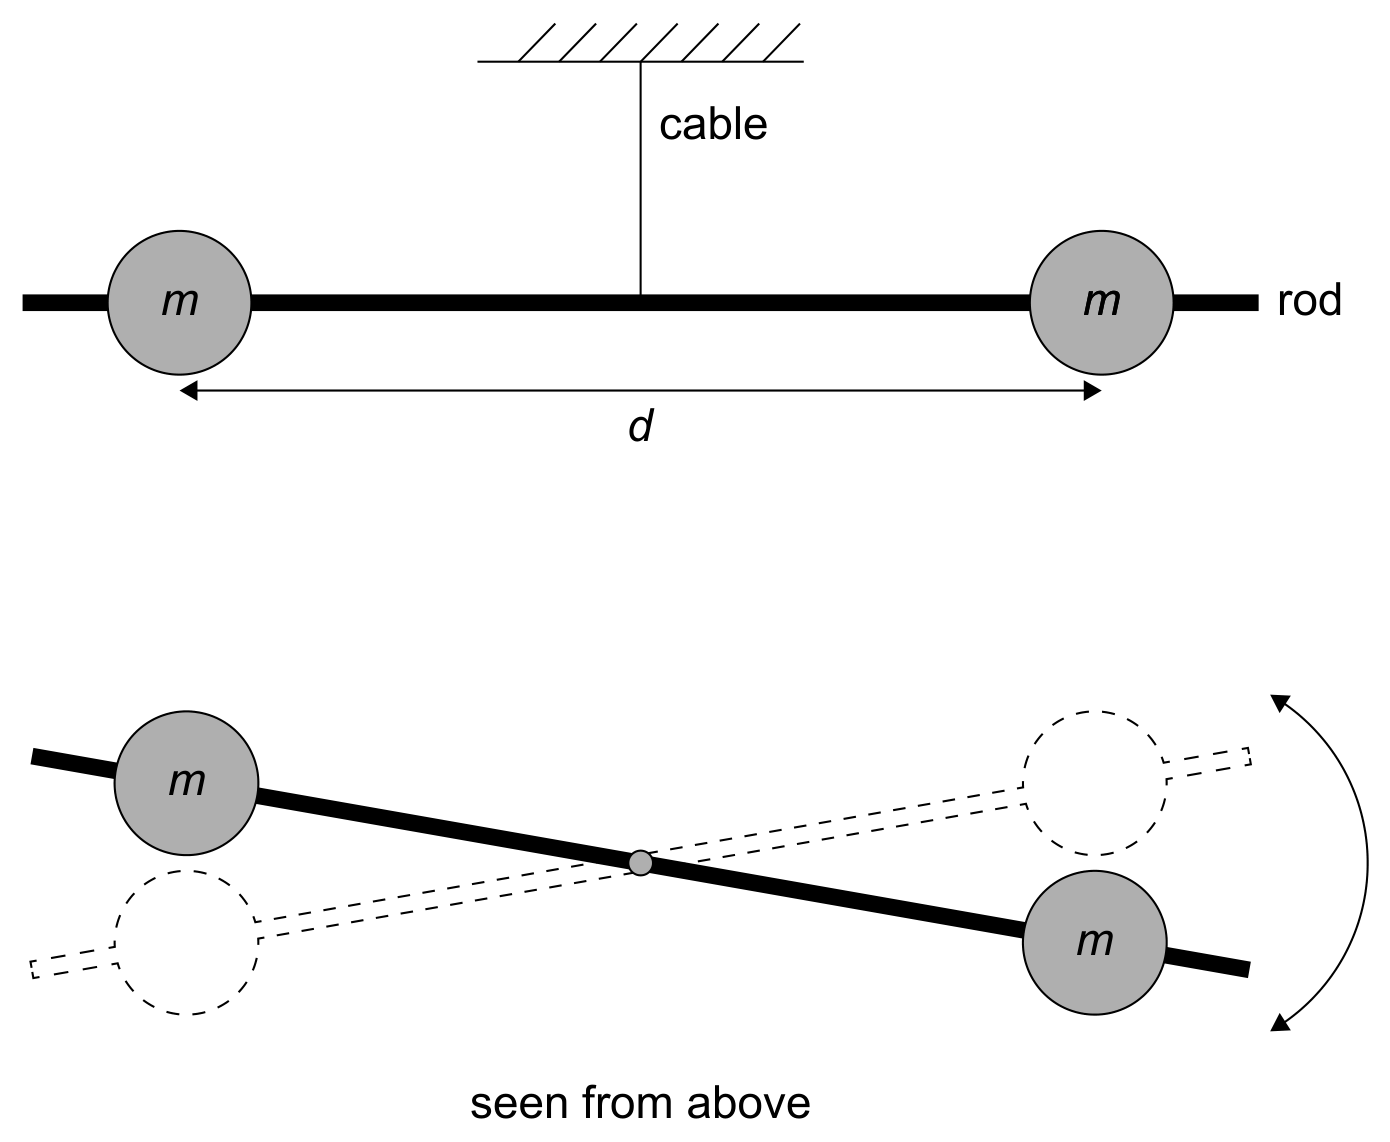
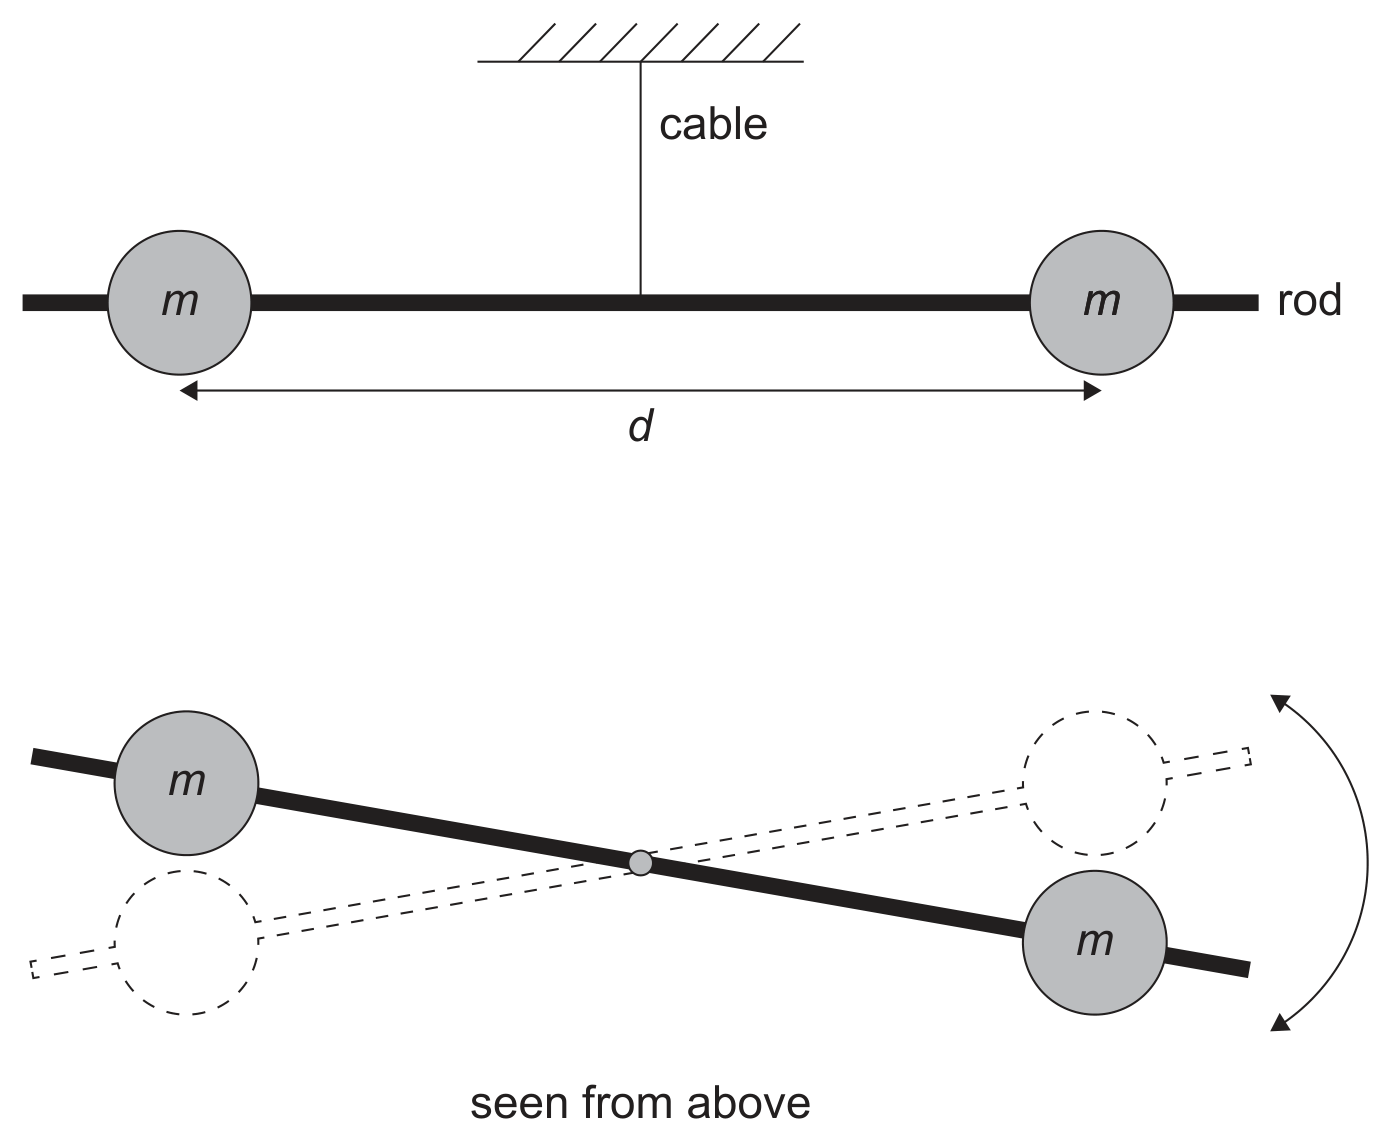
A student performs an experiment with a rod that is free to oscillate in a horizontal plane. Two identical small spheres, each of mass m, are placed at equal distances from the centre of the rod. The student records values of the period of oscillation of the rod T in seconds for different values of the distance of separation of the spheres d, in metres.

Question image

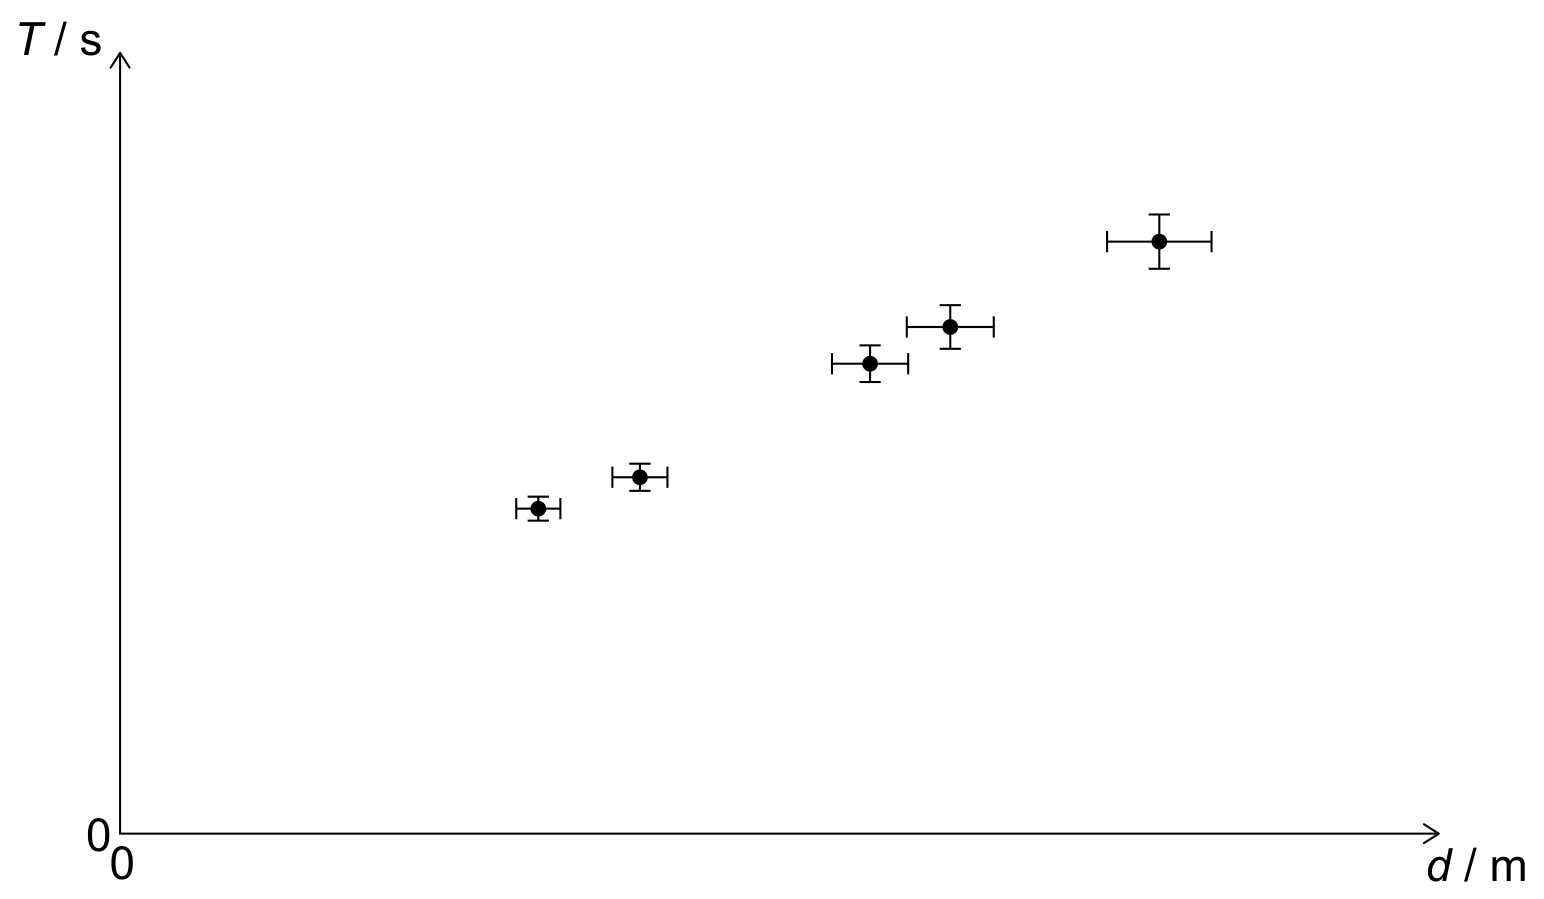
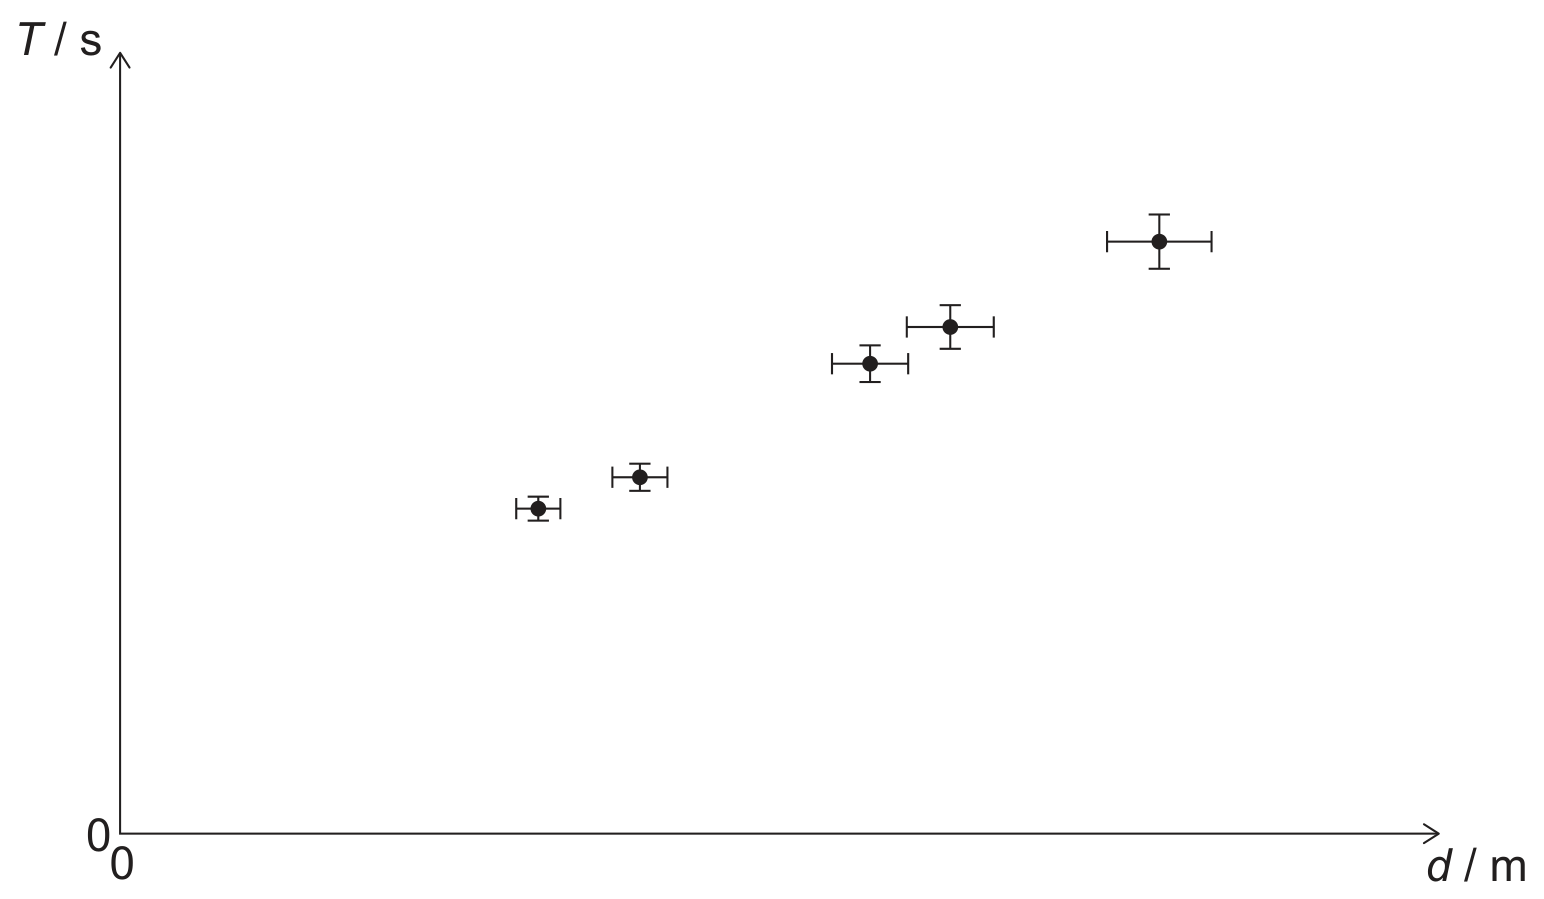
The student plots the variation with d of T, keeping m constant.

Question image

Question 1(a)(ii)

(a)

The student proposes the hypothesis that T is directly proportional to d. Outline whether the graph supports this model.

[ 1 ]

Question 1(c)

(b)

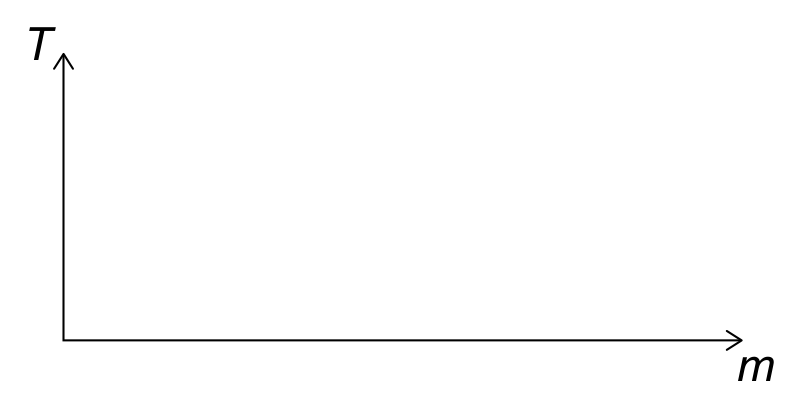
The student goes on to investigate the relationship proposed in (b) between T and m, keeping d constant.

Sketch the graph expected for this experiment on the axes provided.

Question image
[ 2 ]

Question 1(a)(ii)

[Maximum number: 1]

A student performs an experiment with a rod that is free to oscillate in a horizontal plane. Two identical small spheres, each of mass m, are placed at equal distances from the centre of the rod. The student records values of the period of oscillation of the rod T in seconds for different values of the distance of separation of the spheres d, in metres.

Question image

The student plots the variation with d of T, keeping m constant.

Question image

The student proposes the hypothesis that T is directly proportional to d. Outline whether the graph supports this model.

Question 1(d)

[Maximum number: 2]

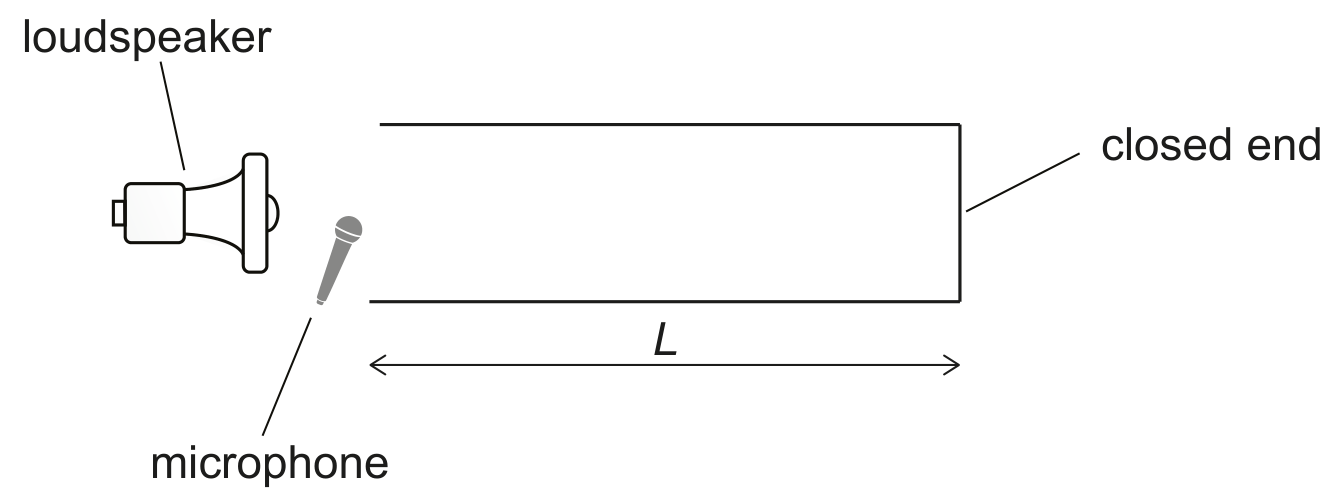
Student A conducts an experiment to determine the speed of sound in air using tubes of different lengths. Each tube is open at one end and closed at the other end.

A short pulse of sound is produced by a loudspeaker near the open end of each tube. A microphone is placed at the open end of each tube and detects the sound entering and leaving the tube.

Question image

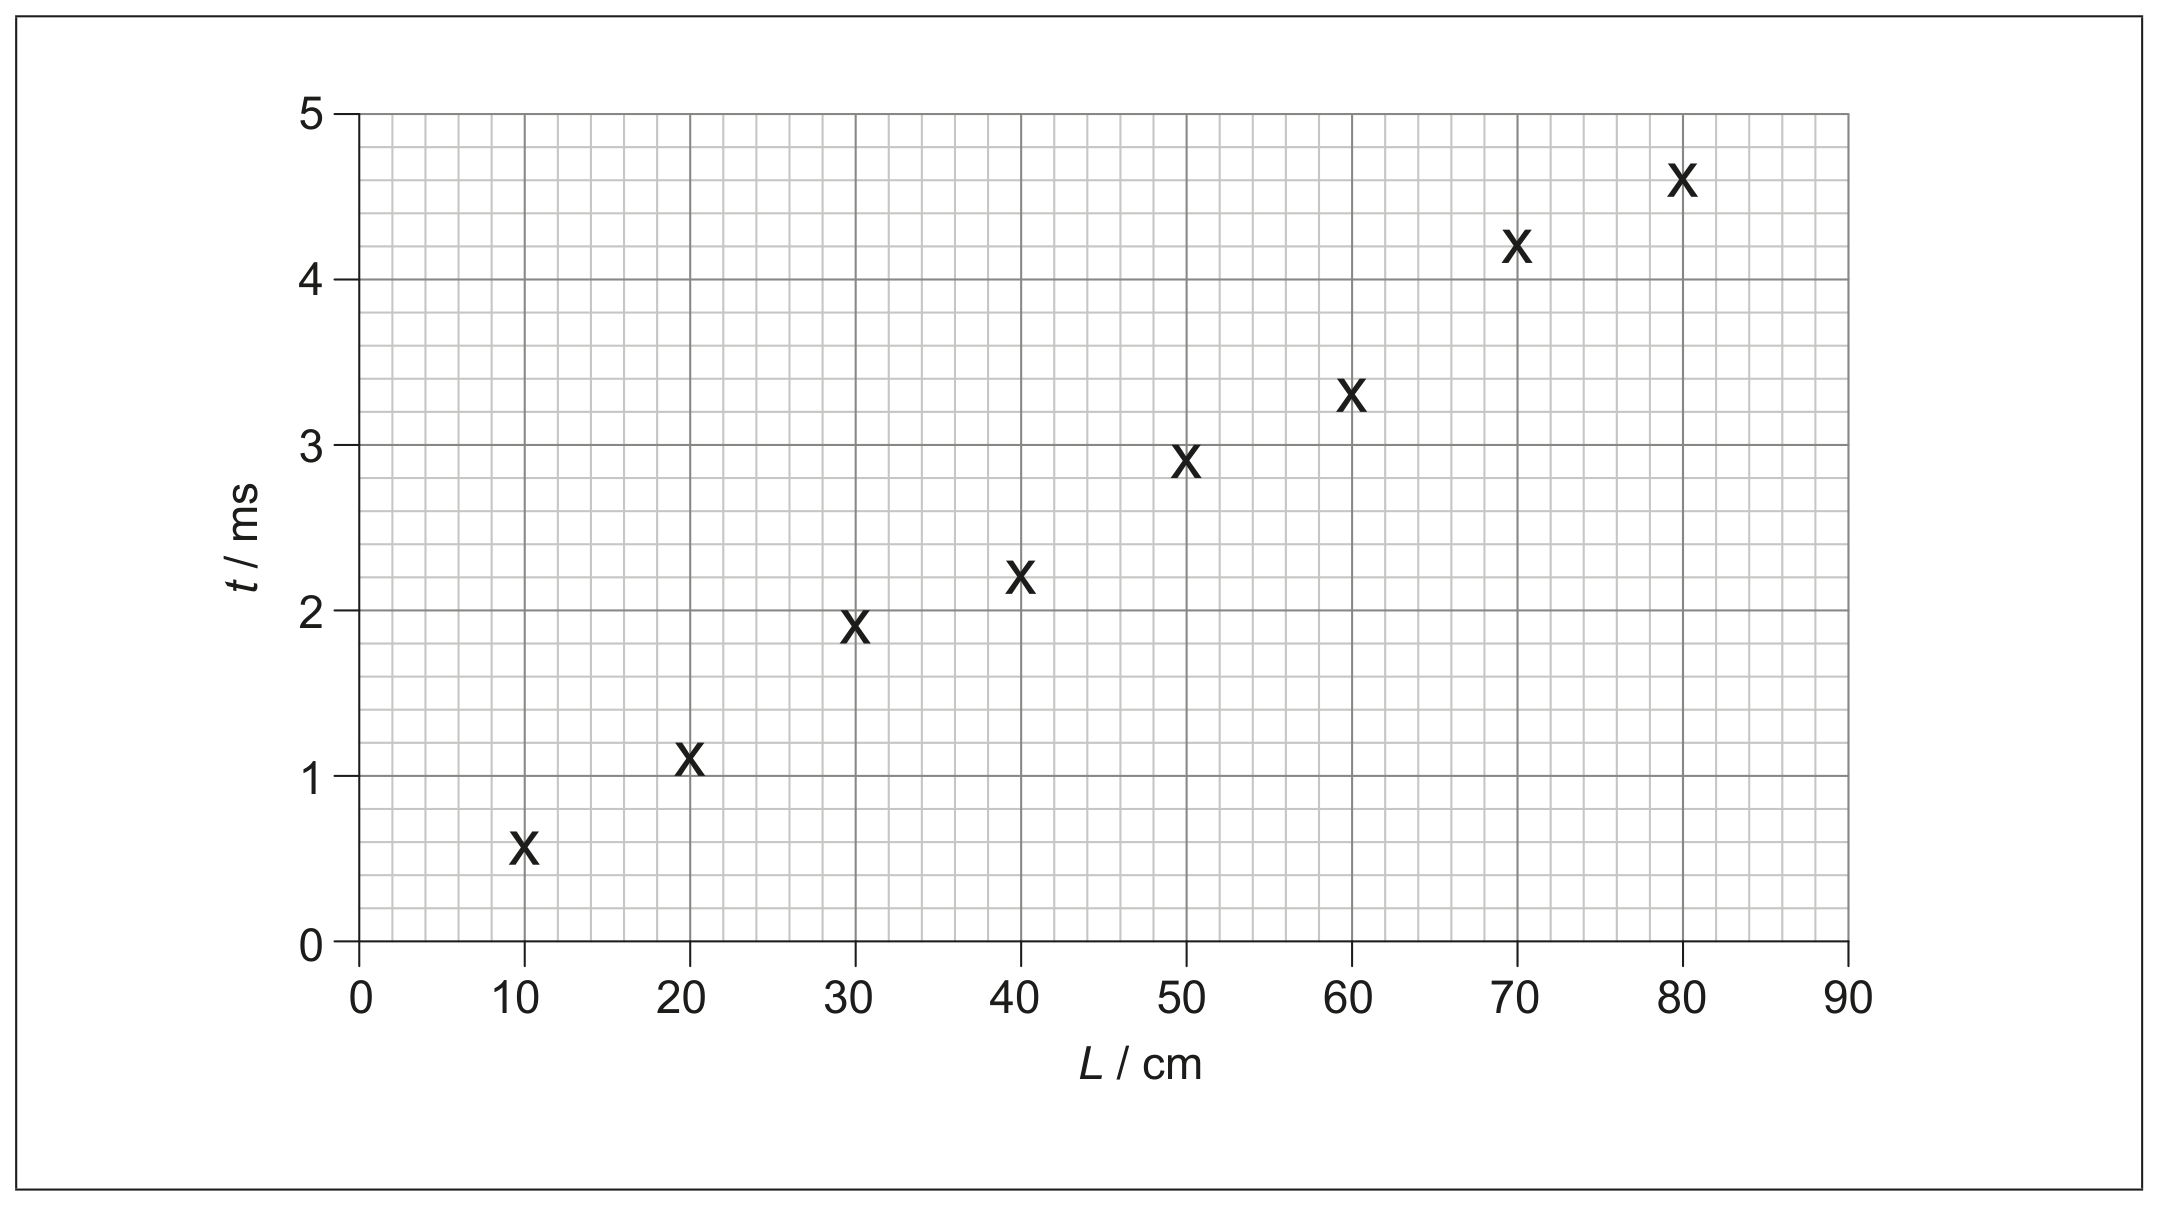
The graph shows the variation with tube length L of the time t for the sound to travel along the tube and be reflected back.

Question image

The percentage uncertainty in each time measurement is 9 %. The uncertainty in L is negligible.

Student B conducts the same experiment and analysis but places the microphone 10 cm to the left of the open end of each tube.

Compare, with reference to the graphs drawn, the value for speed of sound obtained by student B to that of student A.

Question 2(a)(iii)

[Maximum number: 3]

The equation PV=NkBTP V=N k_{\mathrm{B}} T describes the behaviour of an ideal gas.

A student tests a fixed mass of gas to confirm that, for a constant temperature,

P V=K

where K is a constant.

The student does this by making measurements of P and V.
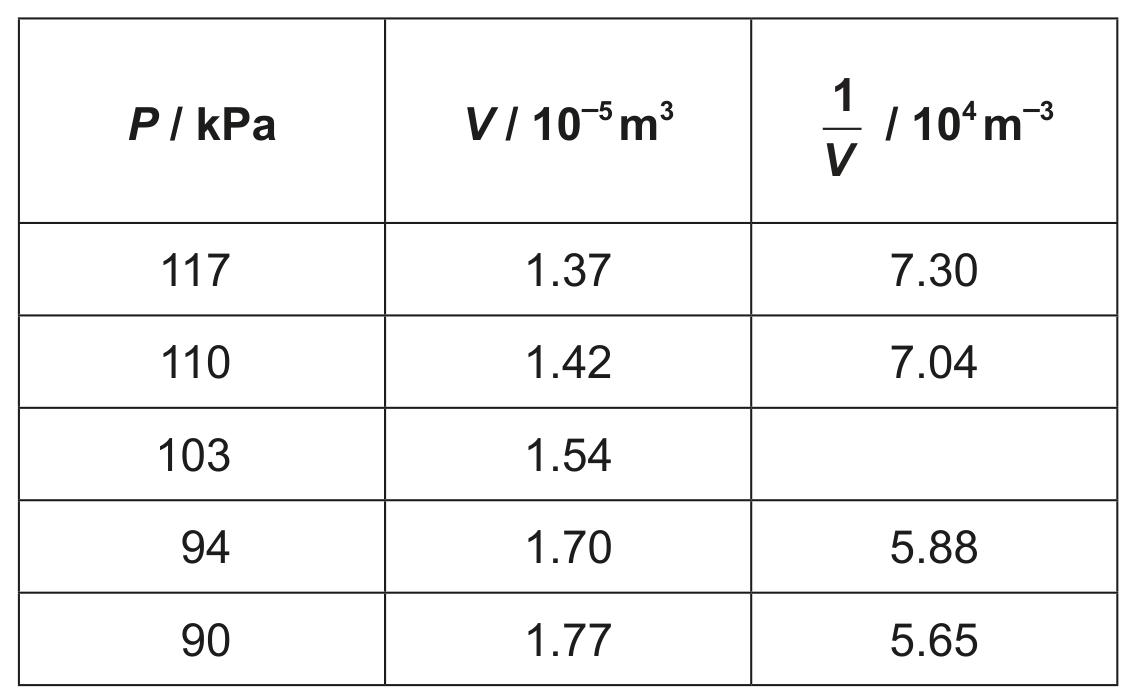
Five sets of data for this experiment are shown in the table. Four processed values of 1V\frac{1}{V} are also shown.

Table

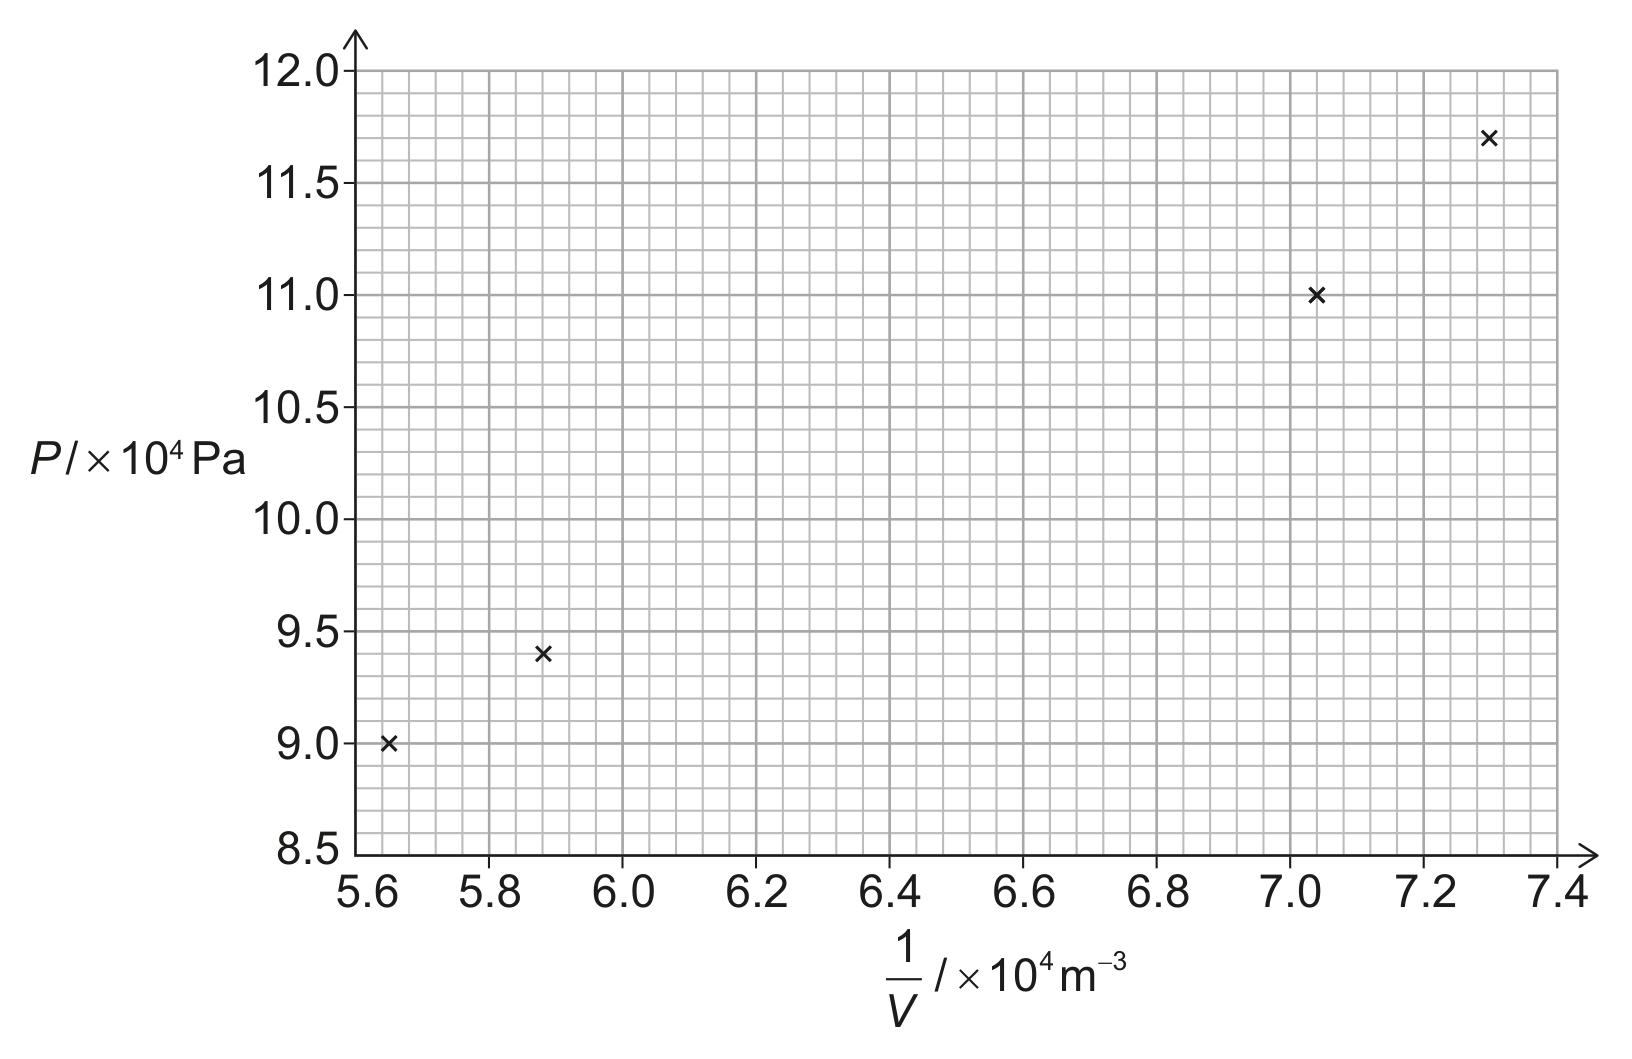
The variation of P with 1V\frac{1}{V} is shown for four data points.

Question image

Explain how the student can use the graph to decide whether the data support the relationship P V=K.

0 selected