EduNinja

S1.3 Mathematics Topic Practice

S1.3 Mathematics Topic Practice
IB Physics syllabusPhysics SL/HLFirst assessment 2025

Practise the maths used throughout IB Physics, from units and vectors to uncertainties and graphs, with decisions based on data, lines and numerical checks.

Exam points

  • apply unit analysis, vector reasoning and uncertainty rules when selecting answers or completing working
  • interpret tables and graphs by adding points, drawing best-fit lines, using gradients and checking s.f. or units
  • use numerical processing such as logs, powers or ratios before reading constants, intercepts or uncertainties

Question 1

[Maximum number: 8]

A group of students is trying to determine the density and the viscosity of a liquid.

To determine the density, they use a balance to read the mass m of a sphere in air and immersed in the liquid.

They use a sphere of volume V=1.827×10⁷ m3V=1.827 \times 10^{-7} \mathrm{~m}^{3}.
The readings are mair =1.427 gm_{\text {air }}=1.427 \mathrm{~g} in air and mlmmersed =1.208 gm_{\text {lmmersed }}=1.208 \mathrm{~g} in the liquid.
The readings are different due to buoyancy. The buoyancy force FbF_{\mathrm{b}} is given by

Fb=ρVgF_{\mathrm{b}}=\rho V g

where V is the volume of the sphere and ρ\rho is the density of the liquid.

Question 1(a)

(a)

State the level of precision in the measurement of m.

[ 1 ]

Question 1(d)

(b)

To determine the viscosity, they immerse the sphere in the liquid and drop it from rest.
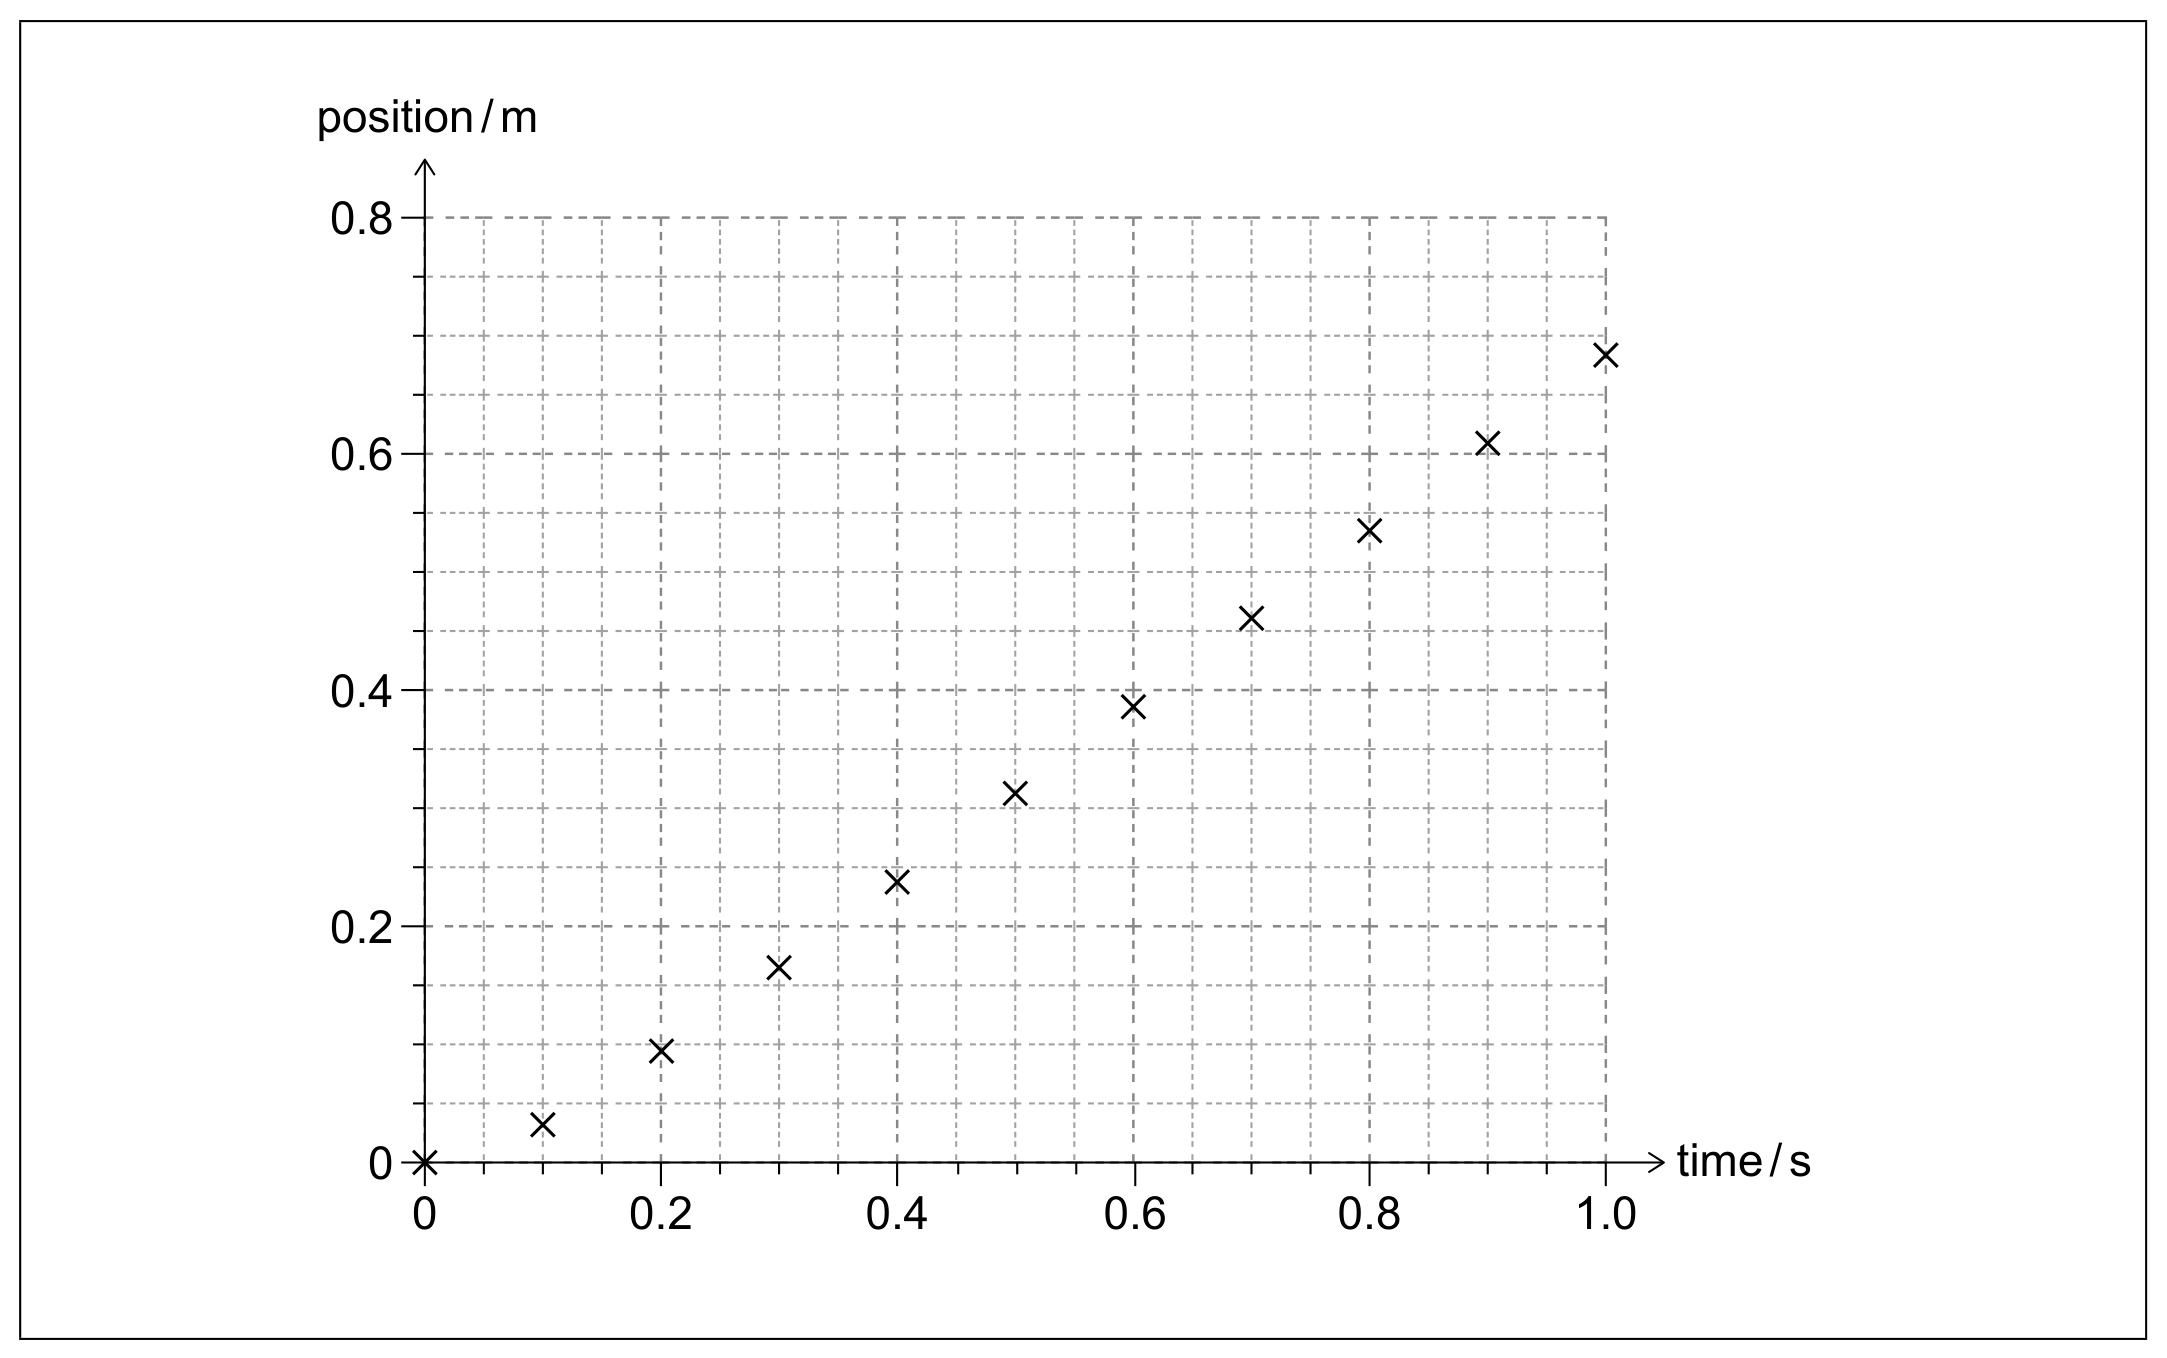
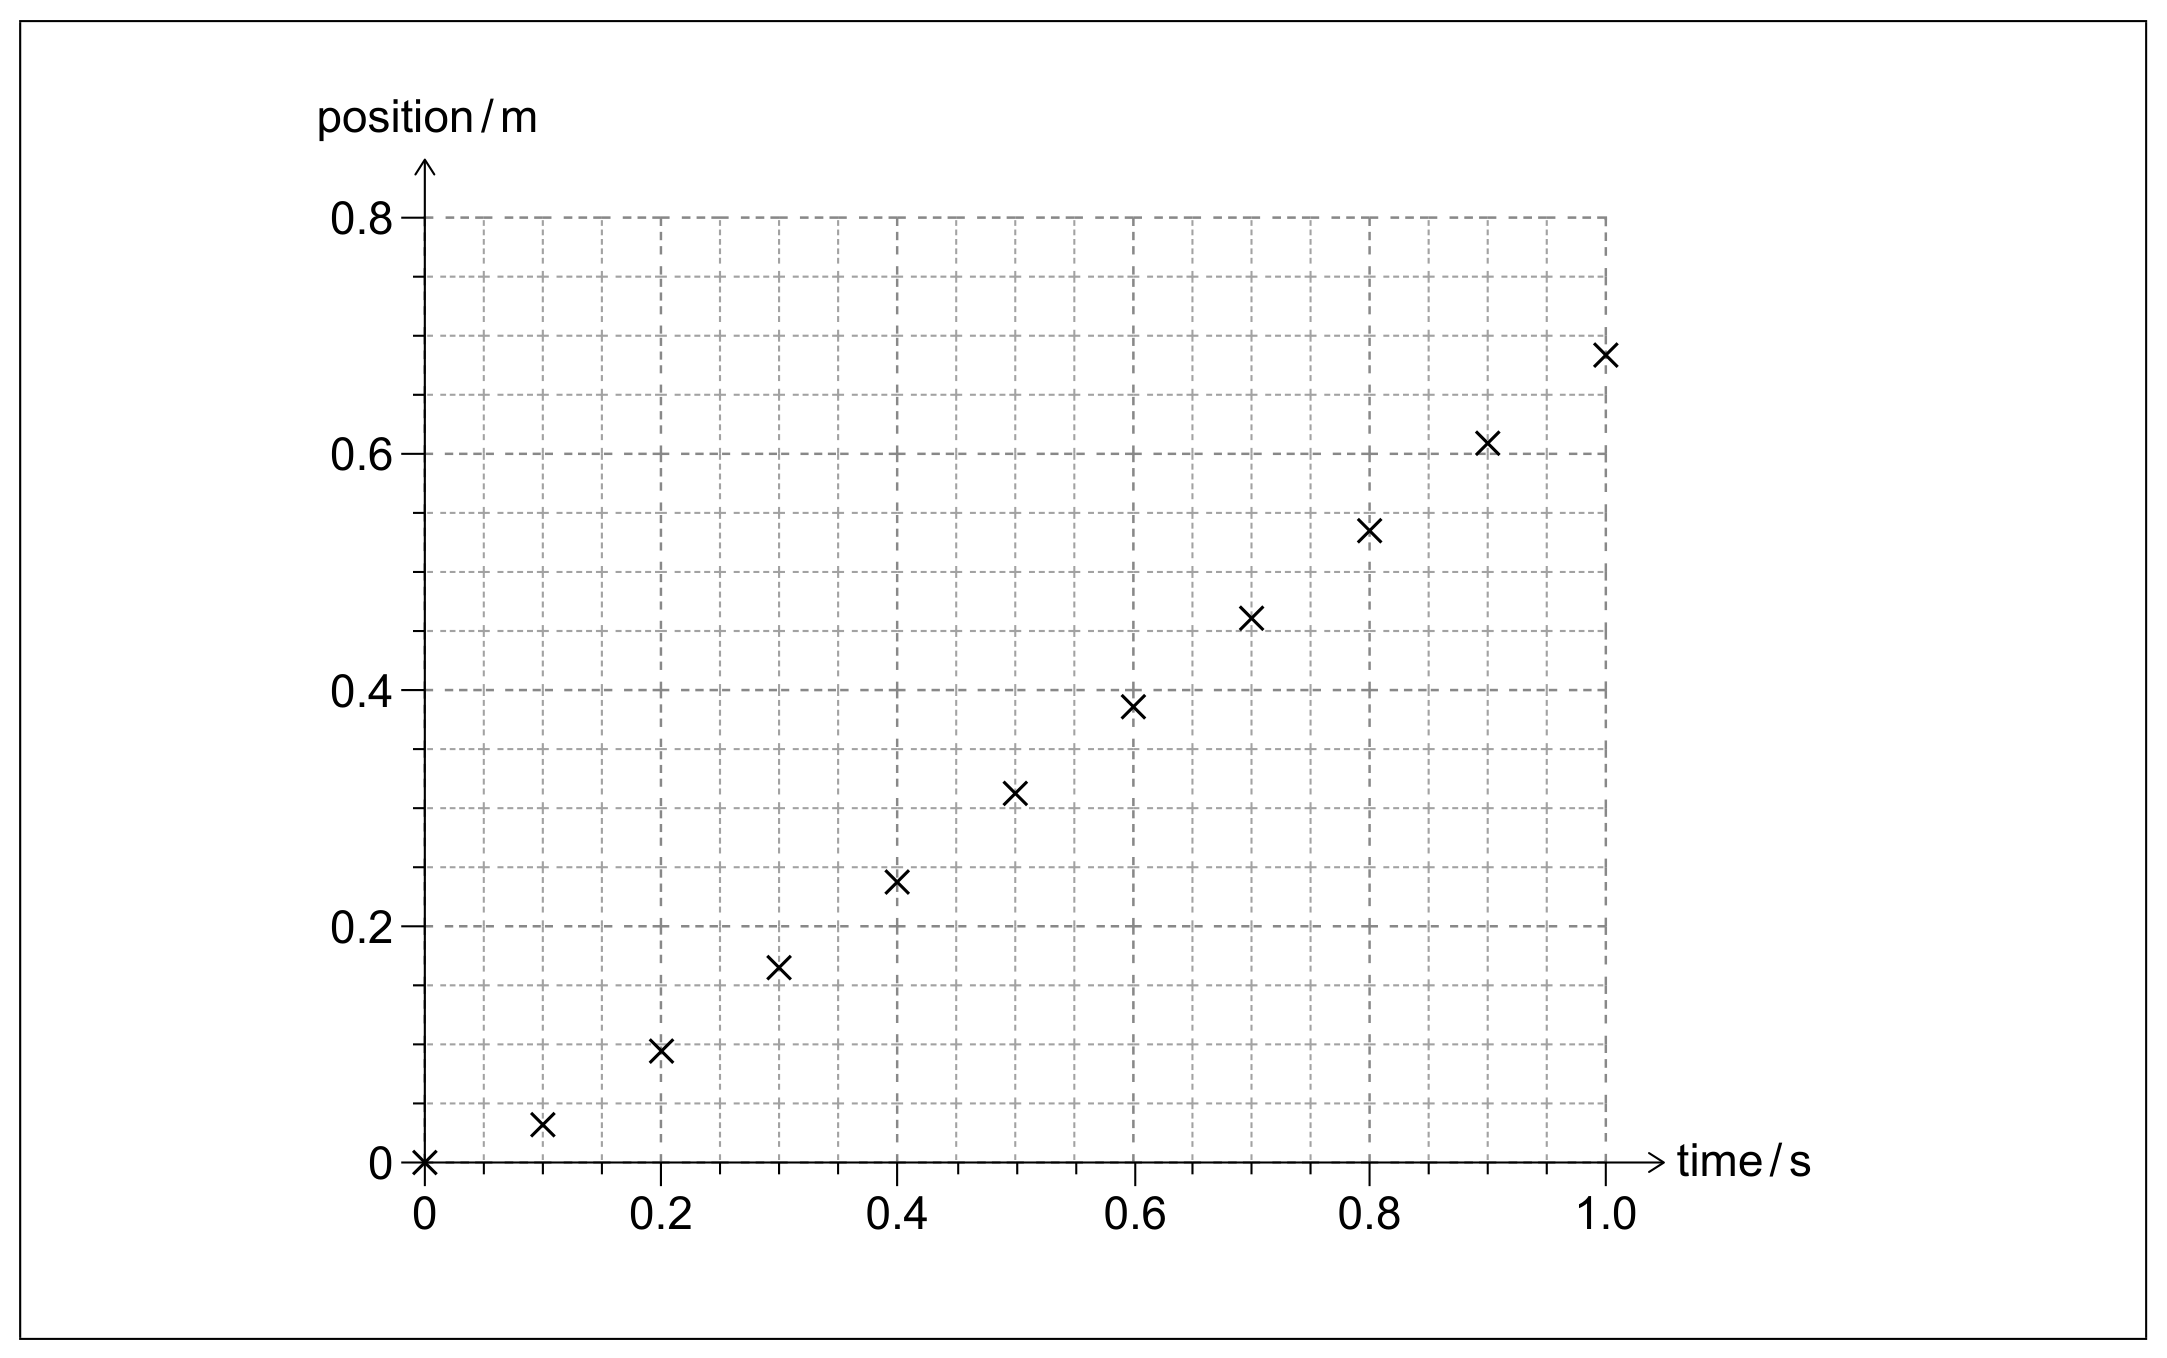
They collect values and plot a graph of the position d of the sphere from the moment they drop it. They verify that the sphere reaches terminal velocity vtv_{t} after 0.5 s .

Question image

Draw the line of best fit on the graph.

[ 2 ]

Question 1(e)

(c)

Outline how the students may verify that the sphere reaches terminal velocity.

They repeat the experiment several times and estimate an average for

vt=(0.71±0.05)ms1v_{\mathrm{t}}=(0.71 \pm 0.05) \mathrm{ms}^{-1}

They use the equation

η=mairgρVg6πrvt\eta=\frac{m_{\mathrm{air}} g-\rho V g}{6 \pi r v_{\mathrm{t}}}

where
r= radius of the sphere,
vt=v_{\mathrm{t}}= terminal velocity of the sphere,
η=\eta= viscosity of the liquid.
The radius r of the sphere is 3.520 mm .

[ 1 ]

Question 1(f)

(d)

Calculate the viscosity of the liquid and its absolute uncertainty. Ignore uncertainties in the mass, radius and volume of the sphere. Give your answer in the form η±Δη\eta \pm \Delta \eta, to an appropriate number of significant figures, including units.

The students search literature values and find the viscosity of this liquid to be 0.24 , when expressed in SI base units.
[ 4 ]

Question 1

[Maximum number: 7]

A group of students is trying to determine the density and the viscosity of a liquid.

To determine the density, they use a balance to read the mass m of a sphere in air and immersed in the liquid.

They use a sphere of volume V=1.827×10⁷ m3V=1.827 \times 10^{-7} \mathrm{~m}^{3}.
The readings are mair =1.427 gm_{\text {air }}=1.427 \mathrm{~g} in air and mlmmersed =1.208 gm_{\text {lmmersed }}=1.208 \mathrm{~g} in the liquid.
The readings are different due to buoyancy. The buoyancy force FbF_{\mathrm{b}} is given by

Fb=ρVgF_{\mathrm{b}}=\rho V g

where V is the volume of the sphere and ρ\rho is the density of the liquid.

Question 1(d)

(a)

To determine the viscosity, they immerse the sphere in the liquid and drop it from rest.
They collect values and plot a graph of the position d of the sphere from the moment they drop it. They verify that the sphere reaches terminal velocity vtv_{t} after 0.5 s .

Question image

Draw the line of best fit on the graph.

[ 2 ]

Question 1(e)

(b)

Outline how the students may verify that the sphere reaches terminal velocity.

They repeat the experiment several times and estimate an average for

vt=(0.71±0.05)ms1v_{\mathrm{t}}=(0.71 \pm 0.05) \mathrm{ms}^{-1}

They use the equation

η=mairgρVg6πrvt\eta=\frac{m_{\mathrm{air}} g-\rho V g}{6 \pi r v_{\mathrm{t}}}

where
r= radius of the sphere,
vt=v_{\mathrm{t}}= terminal velocity of the sphere,
η=\eta= viscosity of the liquid.
The radius r of the sphere is 3.520 mm .

[ 1 ]

Question 1(f)

(c)

Calculate the viscosity of the liquid and its absolute uncertainty. Ignore uncertainties in the mass, radius and volume of the sphere. Give your answer in the form η±Δη\eta \pm \Delta \eta, to an appropriate number of significant figures, including units.

The students search literature values and find the viscosity of this liquid to be 0.24 , when expressed in SI base units.
[ 4 ]

Question 1

[Maximum number: 4]

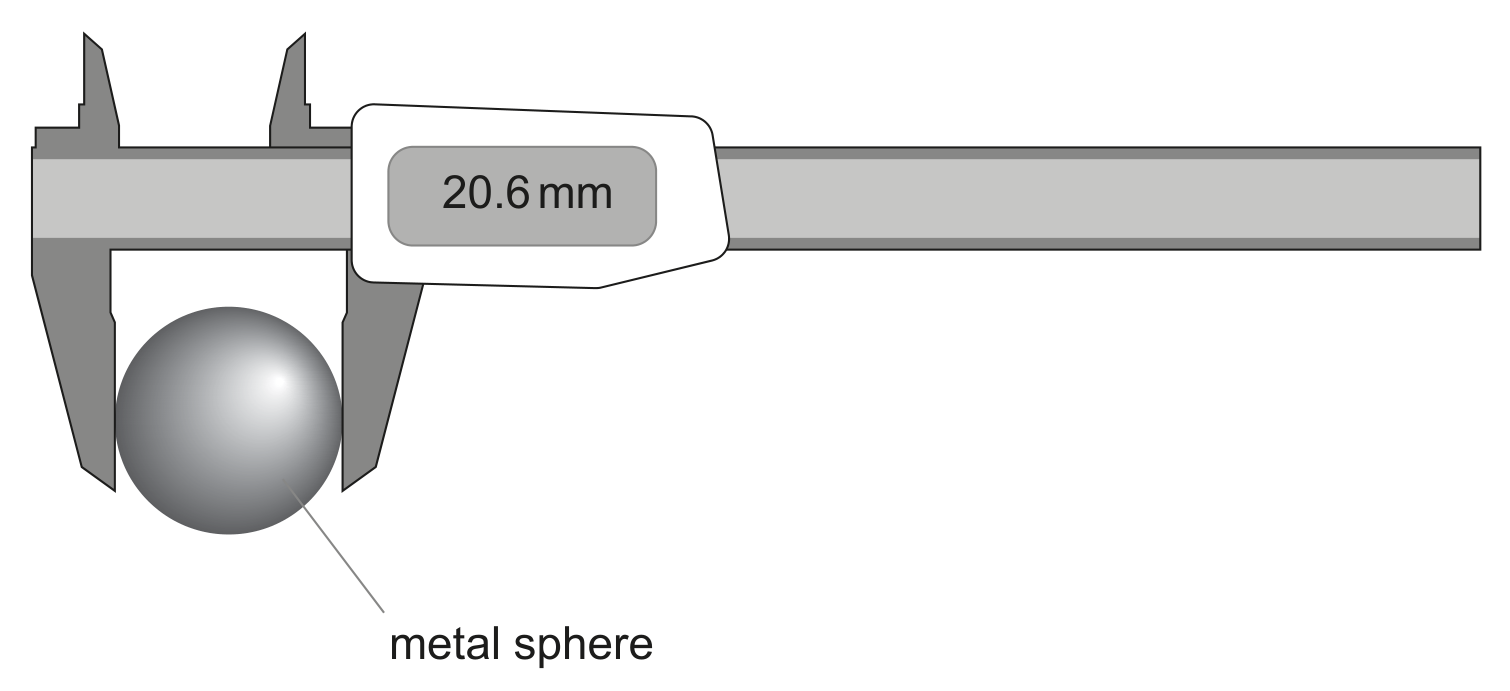
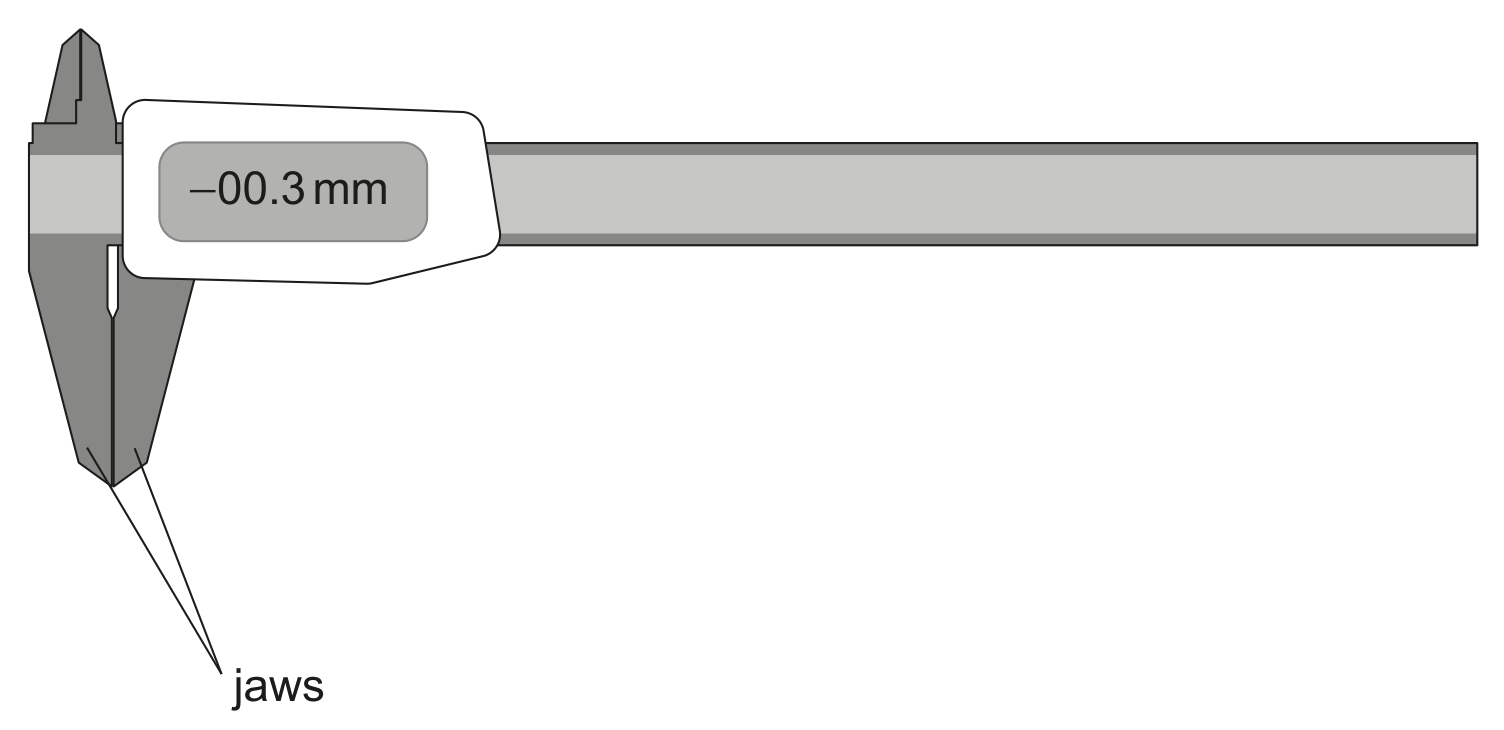
The density of a metal sphere is determined using a digital caliper and a mass balance.

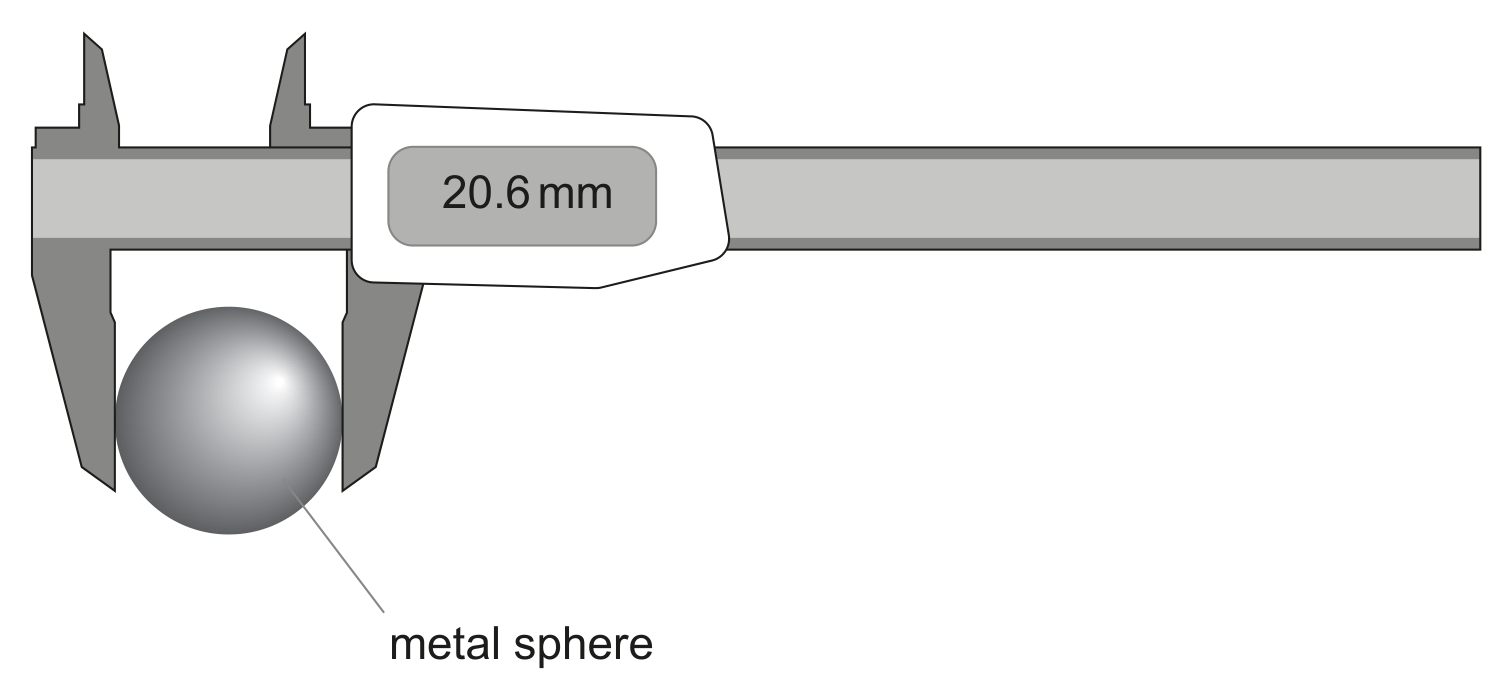
The digital caliper is used to measure the diameter D of the sphere by placing the sphere in the jaws of the digital caliper. This reading is shown.

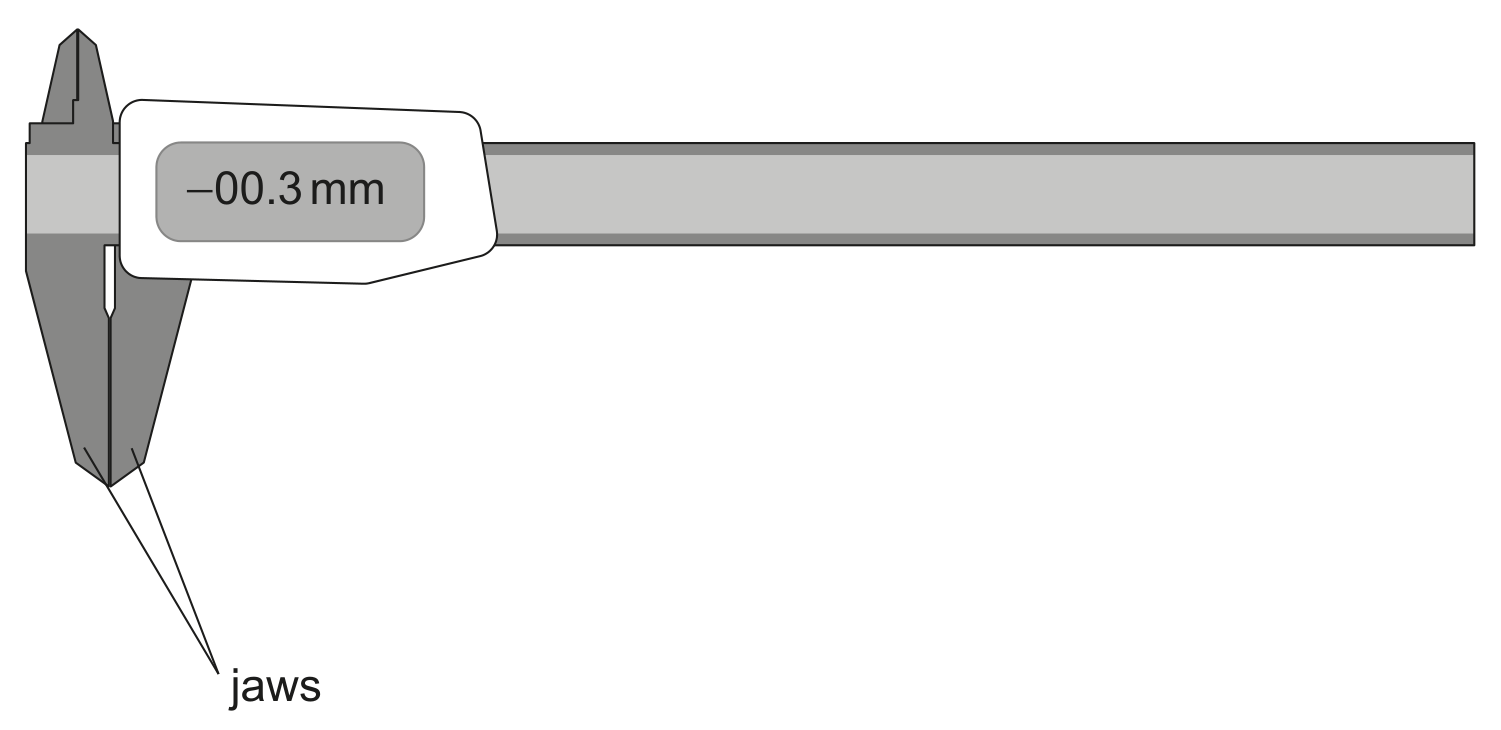
The sphere is then removed and another reading is taken immediately afterwards with the jaws closed.

Question image
Question image

Question 1(a)(ii)

(a)

The manufacturer of the digital caliper states that the uncertainty in the device reading is ±0.1 mm\pm 0.1 \mathrm{~mm}.

Calculate the percentage uncertainty in D.

[ 1 ]

Question 1(c)

(b)

The mass M of the sphere is (54.0±0.2)g(54.0 \pm 0.2) \mathrm{g}.

The density of the sphere ρ\rho is calculated to be 11.3×10³ kg m311.3 \times 10^{3} \mathrm{~kg} \mathrm{~m}^{-3}, using ρ=6MπD3\rho=\frac{6 M}{\pi D^{3}}.

[ 3 ]

Question 1(c)(i)

(i)

Calculate the percentage uncertainty in ρ\rho.

[ 2 ]

Question 1(c)(ii)

(ii)

State the value of ρ\rho, including the absolute uncertainty of ρ\rho.

[ 1 ]

Question 1

[Maximum number: 4]

The density of a metal sphere is determined using a digital caliper and a mass balance.

The digital caliper is used to measure the diameter D of the sphere by placing the sphere in the jaws of the digital caliper. This reading is shown.

The sphere is then removed and another reading is taken immediately afterwards with the jaws closed.

Question image
Question image

Question 1(a)(ii)

(a)

The manufacturer of the digital caliper states that the uncertainty in the device reading is ±0.1 mm\pm 0.1 \mathrm{~mm}.

Calculate the percentage uncertainty in D.

[ 1 ]

Question 1(c)

(b)

The mass M of the sphere is (54.0±0.2)g(54.0 \pm 0.2) \mathrm{g}.

The density of the sphere ρ\rho is calculated to be 11.3×10³ kg m311.3 \times 10^{3} \mathrm{~kg} \mathrm{~m}^{-3}, using ρ=6MπD3\rho=\frac{6 M}{\pi D^{3}}.

[ 3 ]

Question 1(c)(i)

(i)

Calculate the percentage uncertainty in ρ\rho.

[ 2 ]

Question 1(c)(ii)

(ii)

State the value of ρ\rho, including the absolute uncertainty of ρ\rho.

[ 1 ]

Question 1

[Maximum number: 6]

A student determines the resistivity ρ\rho of a metal that is in the form of a cylindrical wire. The student makes the following measurements:

 Length L of the wire =(462±2)mm\text { Length } L \text { of the wire }=(462 \pm 2) \mathrm{mm}
Readings for the diameter d of the wire:

Readings for the diameter d of the wire:

 Resistance R of the wire =13.7Ω±1.5%\text { Resistance } R \text { of the wire }=13.7 \Omega \pm 1.5 \%

Question 1(c)(ii)

(a)

Calculate the fractional uncertainty in the diameter of the wire.

[ 2 ]

Question 1(c)(iii)

(b)

Calculate the fractional uncertainty in the length of the wire.

[ 1 ]

Question 1(d)

(c)

The resistivity of the wire is given by ρ=RAL\rho=\frac{R A}{L} where A is the cross-sectional area of the wire. Calculate the value of ρ\rho and its absolute uncertainty. State your answers to an appropriate number of significant figures.

[ 3 ]

Question 3

[Maximum number: 2]

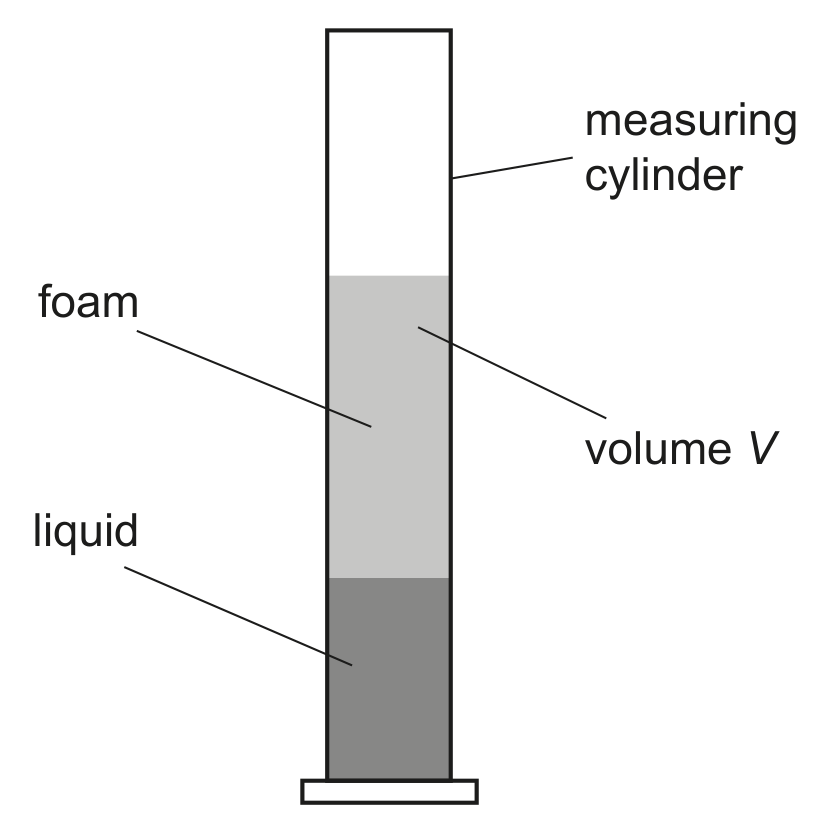
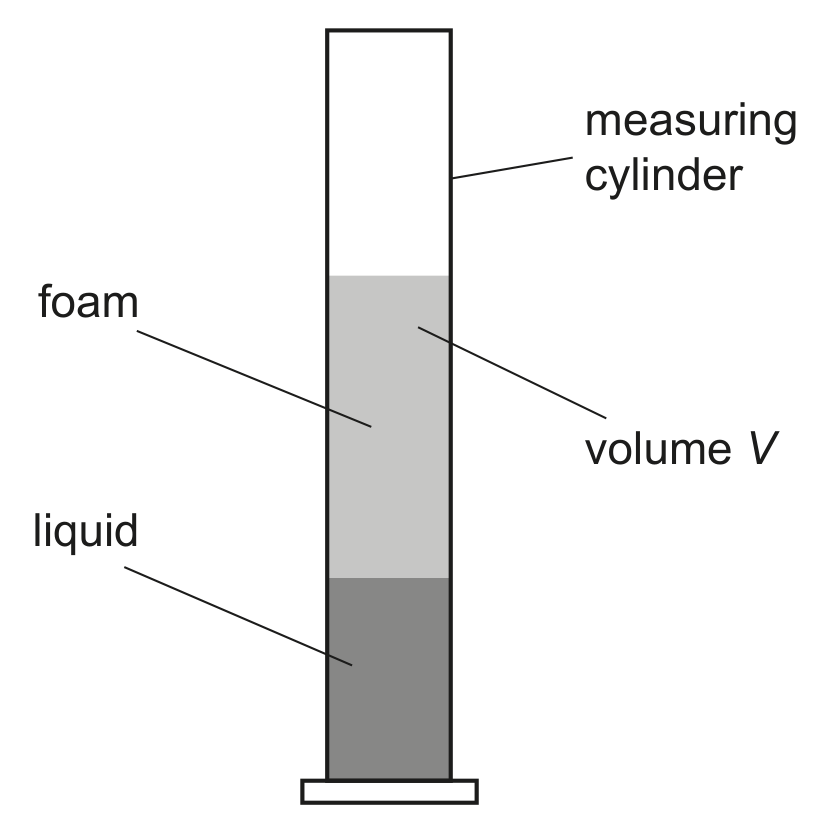
A foam forms above a liquid when the liquid is stirred or poured.

A student investigates the change in volume of a foam with time.
At time t=0, the liquid is poured quickly into a measuring cylinder and a foam forms above the liquid. The student waits one minute for the foam to settle and then records the volume V of the foam and the time t.

The student repeats the measurement every minute.

Question image

Question 3(a)

(a)

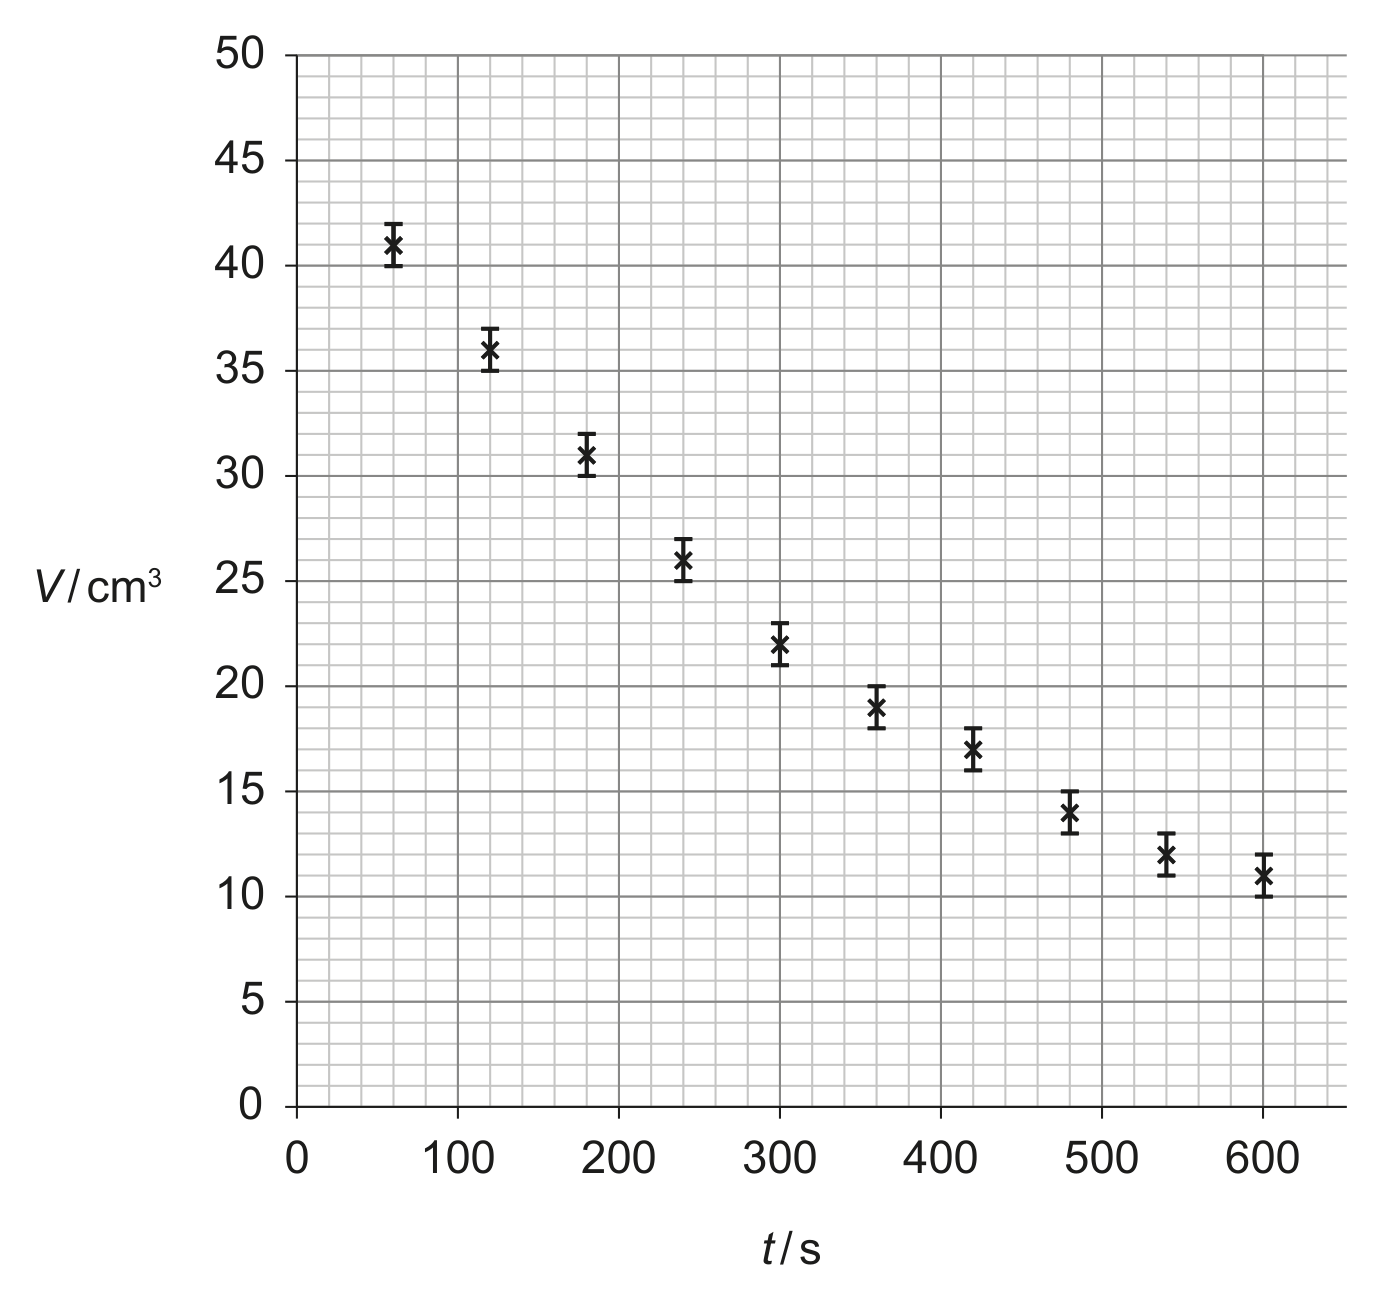
The student plots the data to show how V varies with t. Error bars are given for values of V ;
errors in t are negligible.

Question image
[ 2 ]

Question 3(a)(i)

(i)

Draw the best-fit line for these data on the graph, extrapolating your line to the V-axis.

[ 1 ]

Question 3(a)(ii)

(ii)

Estimate the initial volume of the foam.

[ 1 ]

Question 3(a)(ii)

[Maximum number: 1]

A foam forms above a liquid when the liquid is stirred or poured.

A student investigates the change in volume of a foam with time.
At time t=0, the liquid is poured quickly into a measuring cylinder and a foam forms above the liquid. The student waits one minute for the foam to settle and then records the volume V of the foam and the time t.

The student repeats the measurement every minute.

Question image

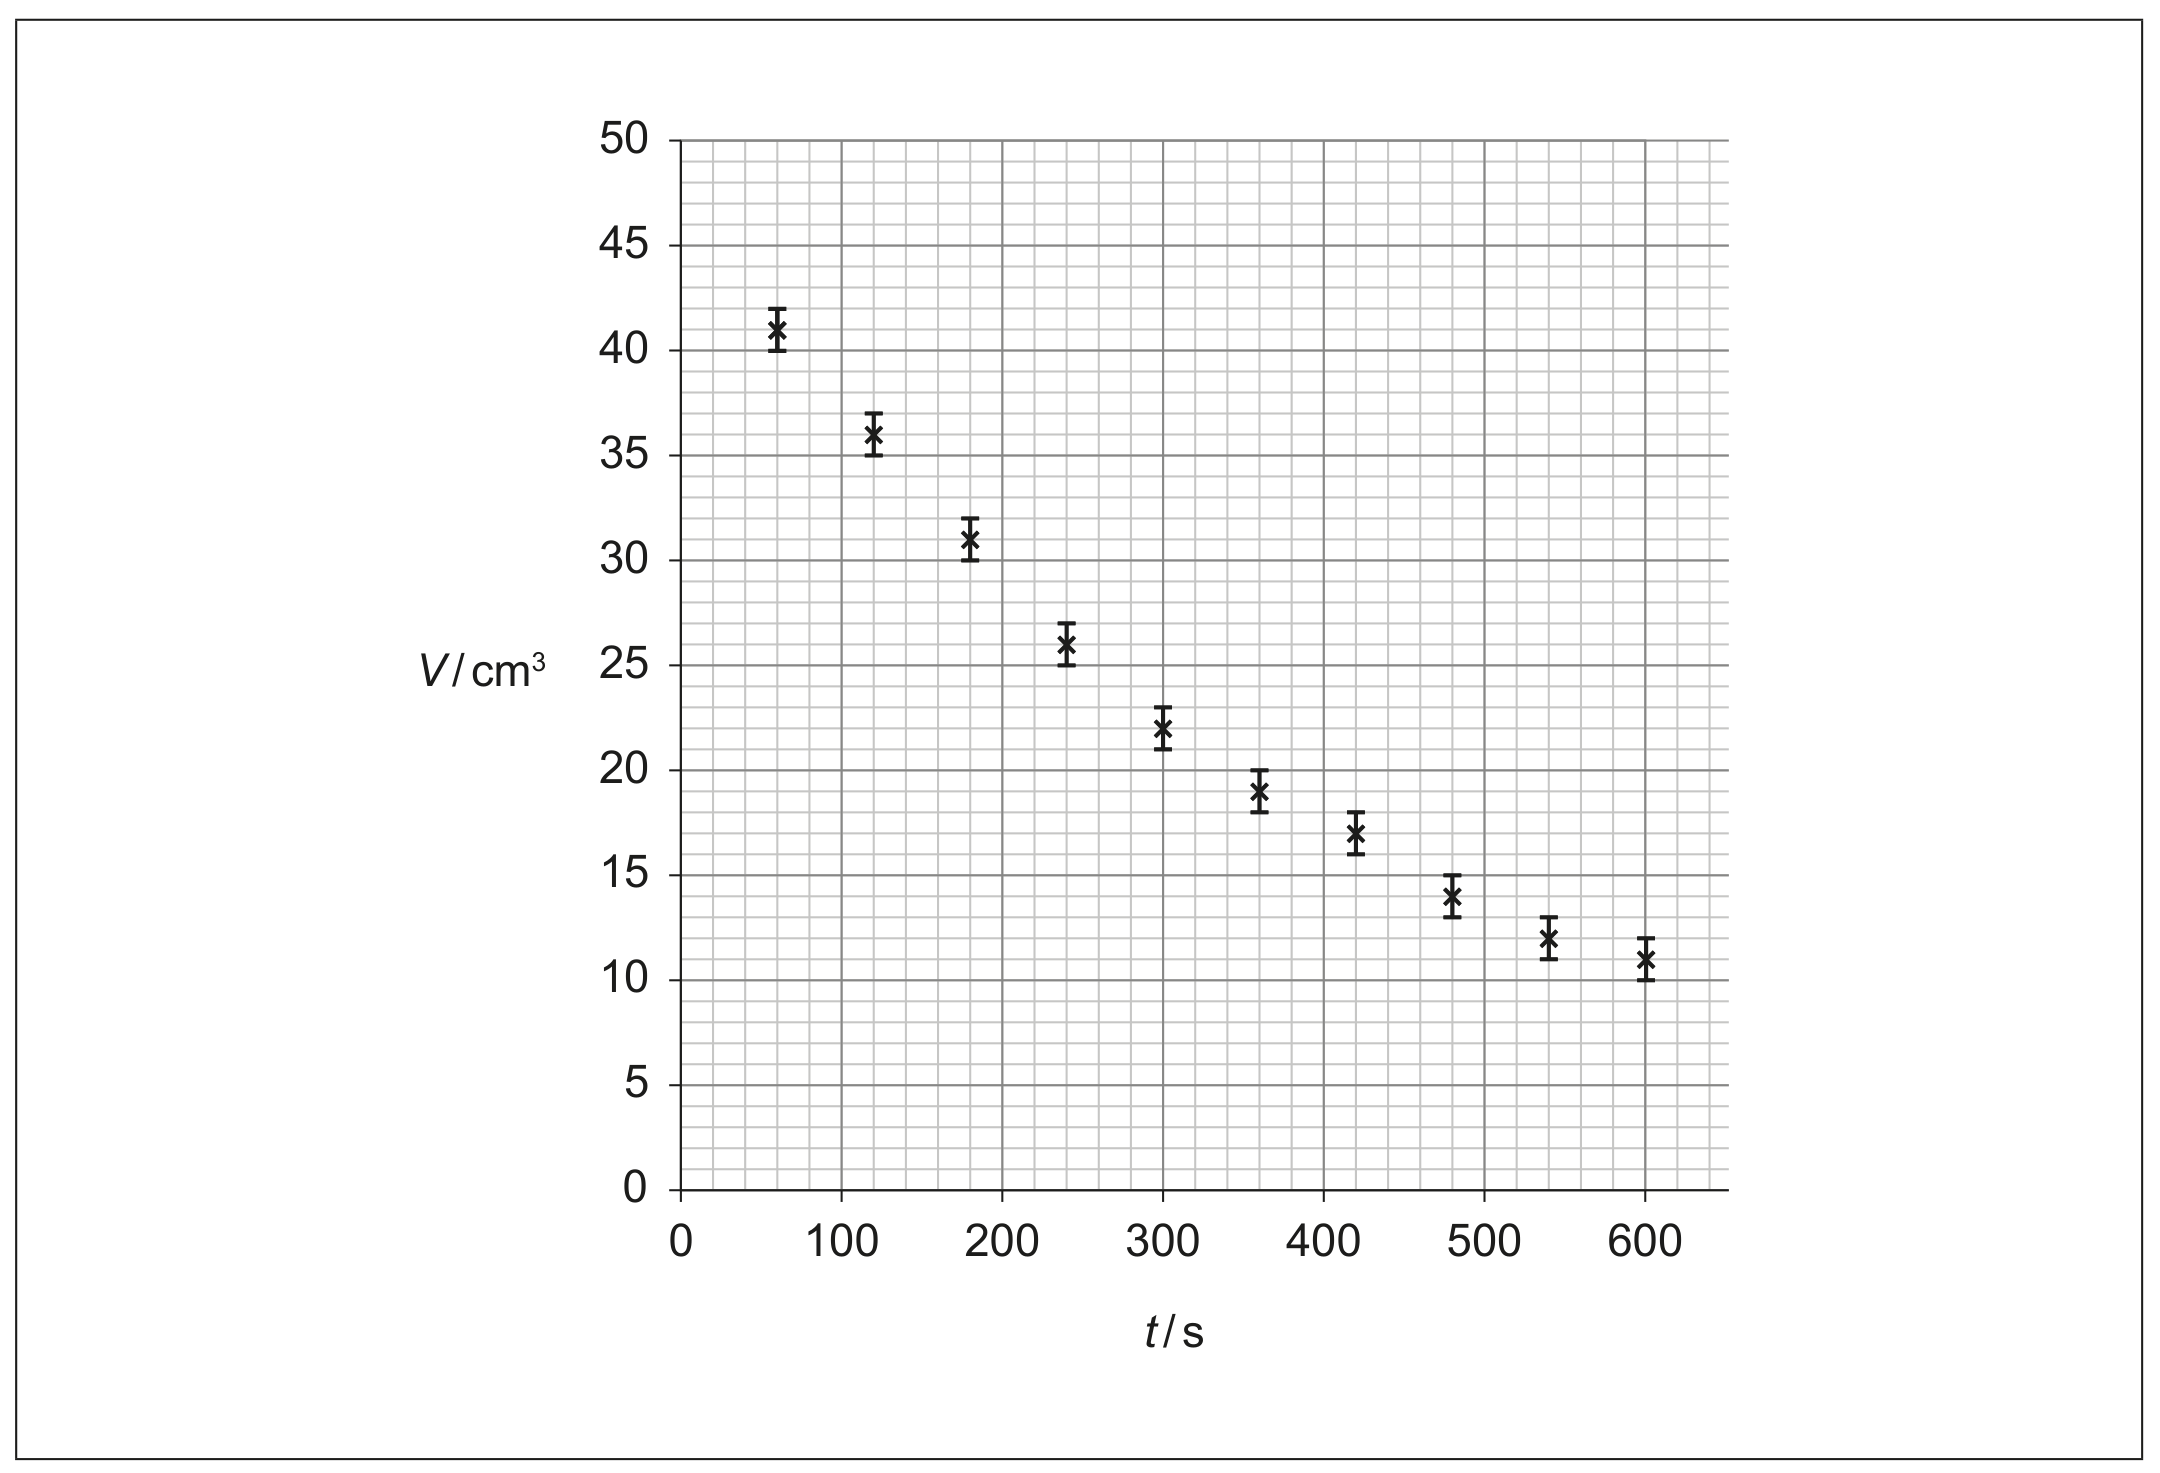
The student plots the data to show how V varies with t. Error bars are given for values of V; errors in t are negligible.

Question image

Estimate the initial volume of the foam.

0 selected