CAIE A-Level Economics 9.3 Employment/unemployment Question Bank

CAIE A-Level Economics 9.3 Employment/unemployment Question Bank
Cambridge International AS & A Level Economics 9708 syllabus for exams in 2026, 2027 and 20282026–2028

Practise interpreting labour market data, classifying unemployment, and linking mobility or policy choices to employment outcomes.

Exam points

  • compare unemployment trends from tables or graphs using the overall change between dates
  • distinguish unemployment types from short scenarios, including cyclical, structural and hysteresis
  • link fiscal, supply-side or benefit policies to likely changes in unemployment and mobility

Question 15

[Maximum number: 1]

Which policy is most likely to lead to a reduction in the natural rate of unemployment?

A

an increase in government expenditure on goods and services

B

an increase in government expenditure on training schemes to address skill shortages

C

an increase in the period when the unemployed are eligible for welfare benefits

D

an increase in the minimum wage
Question 16

[Maximum number: 1]

What is a definition of hysteresis unemployment?

A

people who become temporarily unemployed because it takes a short period of time to find a job after they leave school

B

people who become unemployed when there is a recession but who will find employment as the economy comes out of recession

C

people who become unemployed for a long period of time due to a loss of job skills and work experience while unemployed

D

people who become unemployed when established firms close and new firms are created as technology advances

Question 18

[Maximum number: 1]

What is a likely consequence of an increase in government spending on education?

A

increase in the supply of unskilled labour

B

increase in occupational mobility

C

increase in the rate of unemployment

D

increase in trade union power

Question 21

[Maximum number: 1]

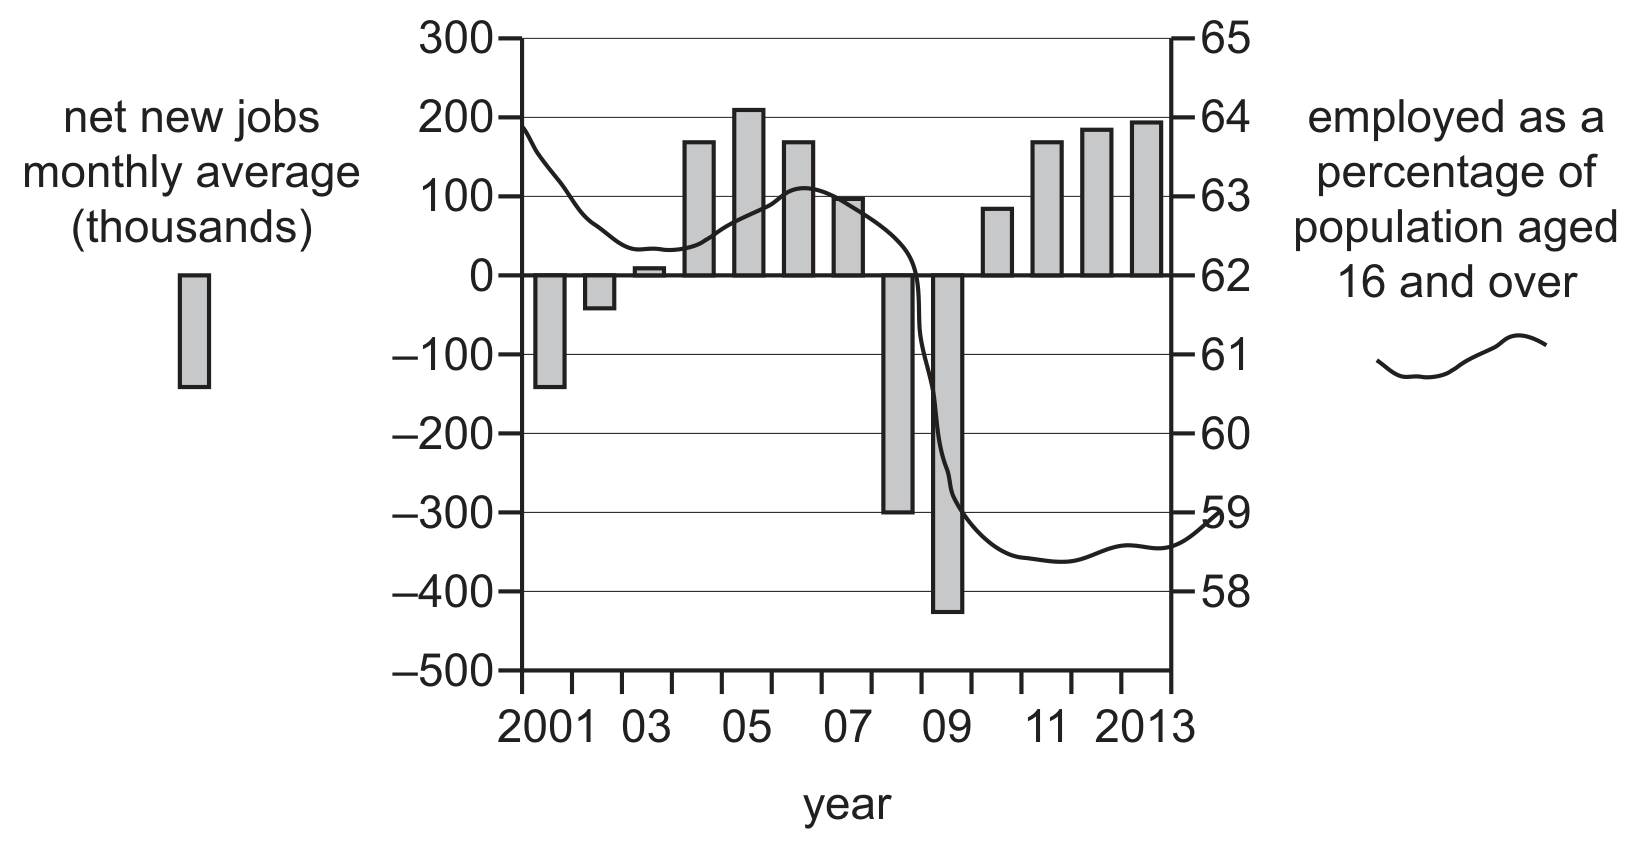
The diagram shows selected US labour statistics from 2001 to 2013.

Figure for Question 21 — CAIE A-Level Economics

What can be concluded from the diagram?

A

Between 2004 and 2005, when the number of net new jobs was rising, the percentage employed increased.

B

Employed as a percentage of the population aged 16 and over declined continuously.

C

The natural rate of unemployment was achieved only in 2008.

D

The number of employed workers rose in all except four years.

Question 22

[Maximum number: 1]

Which type of unemployment can be classified as voluntary?

A

cyclical

B

frictional

C

structural

D

technological