CAIE A-Level Economics 1.5.2 PPC Shape and Opportunity Cost

CAIE A-Level Economics 1.5.2 PPC Shape and Opportunity Cost
Cambridge International AS & A Level Economics 9708 syllabus for exams in 2026, 2027 and 20282026–2028

Practise reading PPC slope and movements to calculate opportunity cost and explaining why specialised resources create increasing costs while a straight curve implies constant…

How this is tested

  • calculate opportunity cost as output forgone divided by additional output gained between points
  • link a straight PPC and its constant slope to constant opportunity cost between the two goods
  • explain increasing opportunity cost through resources becoming less suited to the expanding output

Question 3

[Maximum number: 1]

The diagram shows a production possibility curve for an economy that produces capital goods and consumer goods.
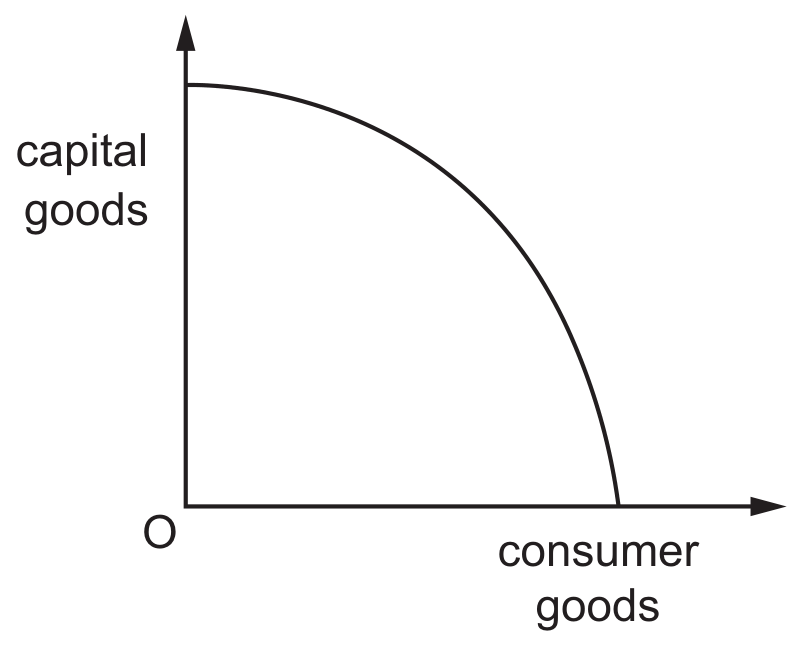
Figure for Question 3 — CAIE A-Level Economics

Why is the production possibility curve drawn concave to the origin?

A

Capital goods are a more labour-intensive output than consumer goods.

B

Consumers always seek to maximise their satisfaction from consumption.

C

Profit maximisation for firms always ensures efficiency in production.

D

Some resources are more efficient in production of some goods than others.