D4.2 Stability and change

Stability and change in ecosystems depend on sustainable resource use, pollution impacts, keystone species, rewilding, and succession processes over time.

Syllabus
First assessment 2025
Topic
D4.2
Level
SL

Learning objectives

D4.2.1Stability of natural ecosystems• Some ecosystems remain stable over long timescales despite local fluctuations• Ancient forests, deserts, and long-lived communities provide evidence of stabilityD4.2.2Requirements for stability• Stability requires energy input, nutrient cycling, biodiversity, and genetic diversity• Abiotic conditions must remain within tolerance ranges for key speciesD4.2.3Amazon rainforest deforestation• Amazon deforestation reduces transpiration, rainfall recycling, and regional cooling• Loss of forest can push rainforest toward savanna-like tipping pointsD4.2.4Mesocosm model• Mesocosms model ecosystem stability under controlled experimental conditions• Closed bottle systems restrict matter exchange but allow light energy inputD4.2.5Keystone species• Keystone species have disproportionate effects on community structure• Removal can trigger trophic cascades and ecosystem instabilityD4.2.6Sustainable resource harvesting• Sustainable harvesting removes biomass at or below replacement rate• Managed plant harvests and marine fish stocks require monitoring population recoveryD4.2.7Agriculture sustainability factors• Agricultural sustainability depends on soil conservation, nutrient balance, and biodiversity• Erosion, leaching, fertilizers, agrochemicals, irrigation, and carbon footprint are key factorsD4.2.8Eutrophication• Eutrophication follows nitrate and phosphate enrichment of water• Algal blooms, decomposition, high biochemical oxygen demand, and hypoxia harm aquatic lifeD4.2.9Biomagnification• Biomagnification increases toxin concentration at higher trophic levels• DDT and mercury show how top predators receive the highest dosesD4.2.10Plastic pollution of oceans• Macroplastics and microplastics persist, fragment, and move through marine ecosystems• Effects include entanglement, ingestion, toxin transport, and food-web impactsD4.2.11Rewilding• Rewilding restores natural processes, trophic interactions, and habitat connectivity• Keystone species reintroductions can restart trophic cascades and reduce intensive management

A Stable Ecosystem Can Fluctuate without Losing Its Identity

Ecosystem stability is the ability to maintain characteristic structures and processes continuously over time, despite ordinary fluctuations or disturbance.

Evidence of stability What may still change?
nutrient cycling continues population sizes vary seasonally
food-web roles persist individuals and local patches turn over
dominant community remains recognizable storms, droughts or fires cause temporary departures

Stable does not mean static. A system can change locally and still be stable if its defining organization persists or recovers.

Long-Term Persistence Is Evidence, Not Proof of Invulnerability

Ancient rainforests, deserts and long-lived communities show that ecosystems can persist over very long timescales when supporting conditions and ecological processes continue.

  • Repeated recovery after disturbance supports resilience.
  • Small fluctuations around a characteristic state support continuity.
  • A long history does not guarantee survival after a new disturbance of greater magnitude or rate.

Always state the timescale and property being judged. A population can decline while nutrient cycling remains stable, or a forest can persist while its species composition changes.

Energy Flows through Ecosystems while Nutrients Must Be Recycled

Requirement Why stability depends on it
continual energy input replaces energy dissipated as heat during metabolism
producer biomass captures light or chemical energy into organic molecules
decomposers and nutrient cycling return mineral nutrients from waste and dead biomass for reuse
matter inputs and retention supply elements needed to build biological molecules

Energy is not recycled: it enters, is transferred and is lost as heat. Chemical elements can cycle repeatedly between organisms and the abiotic environment.

Diversity and Tolerance Ranges Spread Ecological Risk

Stability support Mechanism
species diversity multiple species can occupy different niches or partly replace lost functions
genetic diversity varied alleles increase the chance that some individuals tolerate disease or environmental change
abiotic conditions within tolerance key species can survive, reproduce and maintain their ecological roles

Higher diversity often supports resilience, but it is not a guarantee. Stability still depends on interaction strengths, climate, energy supply and the type of disturbance.

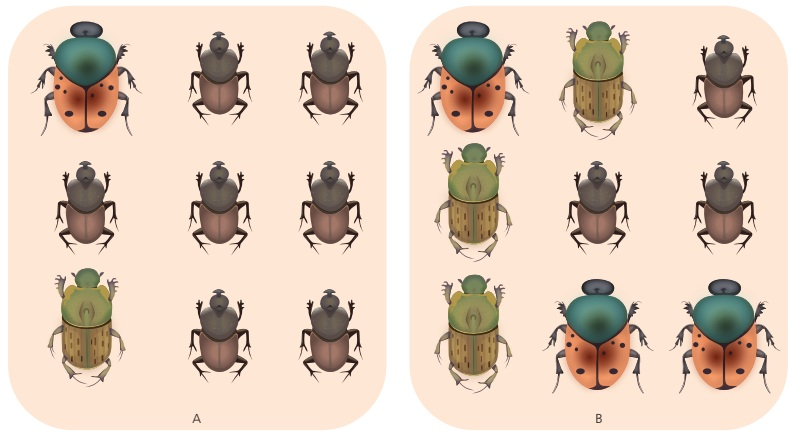
Two beetle communities contain the same three species, but the more even community has higher diversity because no single species dominates.

Positive Feedback Can Push a System across a Tipping Point

A tipping point is a critical threshold beyond which a small additional change can produce a disproportionately large shift to a different ecological state.

  1. A disturbance weakens a stabilizing process.
  2. The weakened process amplifies the original disturbance through positive feedback.
  3. Recovery becomes progressively harder as the system approaches a threshold.
  4. Beyond the threshold, the system may settle into a different equilibrium.

A tipping point is not simply any large change. The defining feature is a threshold response reinforced by feedback, often with difficult or incomplete reversal.

Amazon Forest Recycles Water That Helps Maintain the Forest

  1. Deep-rooted trees take up soil water.
  2. Transpiration transfers water vapour to the atmosphere.
  3. Condensation and air movement support regional cloud formation and rainfall.
  4. Rain replenishes soil water and sustains further forest growth and transpiration.
  • Evapotranspiration cools the regional surface.
  • Continuous canopy and moisture transport extend rainfall beyond local forest patches.
  • Large connected forest areas sustain the loop more effectively than fragmented remnants.

Deforestation Can Shift the Amazon toward a Drier State

  1. Clearing, burning and fragmentation reduce leaf area and transpiration.
  2. Rainfall recycling and regional cooling weaken.
  3. Longer, hotter dry seasons increase drought stress and fire risk.
  4. Fire and tree death remove more forest, reinforcing the original drying.
  5. A forest state can shift toward lower-biomass savanna-like vegetation.

The exact minimum forest area and threshold are uncertain. A possible range is a risk estimate, not a precise prediction that collapse occurs at one universal percentage.

An intact Amazon forest sustains strong transpiration and rainfall recycling, while cleared and burned forest has weaker moisture recycling and moves toward a drier state; an uncertain possible tipping range is marked.

Percentage Change Puts Forest Loss on a Comparable Scale

percentage change = (final forest cover − initial forest cover) ÷ initial forest cover × 100

Quantity Area (km²)
estimated pre-1970 cover 4,100,000
2018 natural forest cover 3,390,835
change −709,165

(−709,165 ÷ 4,100,000) × 100 = −17.3%. The negative sign indicates loss; the chosen initial year determines what the percentage describes.

A percentage of area lost does not by itself prove a tipping point. The ecological inference also needs evidence about fragmentation, rainfall feedback, fire and recovery.

A Mesocosm Trades Ecological Realism for Experimental Control

Mesocosm strength Mesocosm limitation
isolates one manipulated variable small scale omits migration and large food webs
allows replication and repeated measurements container boundaries alter light, heat and movement
reduces damage to a natural ecosystem short experiments may miss slow feedbacks

A sealed bottle can restrict matter exchange while still receiving light energy and losing heat. Producers, consumers and decomposers must together recycle matter within the model.

A mesocosm can test a mechanism under controlled conditions; transferring its result to nature requires cautious comparison with field evidence.

A Fair Mesocosm Test Changes One Factor and Tracks a Response

Design element Nutrient-enrichment test
independent variable phosphate added to treatment only
control addition equal volume of water without phosphate
controlled variables starting culture, vessel, light, temperature, mixing and sampling
dependent variables algal cell density and dissolved oxygen over time
reliability replicate treatment and control vessels

The design must also prevent escape or disposal of organisms and nutrients into natural water, and it must protect organisms from avoidable heat, starvation or oxygen stress.

Matched phosphate-treatment and control mesocosms receive equal light and stirring; only the treatment receives phosphate while algal cell density and oxygen concentration are logged.

A Keystone Species Is Defined by Effect, Not Abundance

A keystone species has a disproportionately large effect on community structure relative to its abundance or biomass.

Observation after removal Keystone inference
many indirect population changes the species controlled a trophic or habitat-forming interaction
loss of functions or community reorganization its role was not readily replaced by other species
effect far exceeds its biomass share impact is disproportionate, the defining criterion

A common or dominant species can be important without being a keystone. “Keystone” compares ecological effect with abundance; it does not simply mean rare, large or charismatic.

Agoutis Link Brazil-Nut Recruitment to the Wider Forest Community

  1. Agoutis open Brazil-nut pods that most animals cannot access.
  2. They carry and bury seeds as food stores.
  3. Some buried seeds are not recovered and germinate away from the parent tree.
  4. Brazil-nut recruitment supports forest structure, nesting sites, food and human livelihoods.
  5. Removing agoutis therefore affects more than one predator–prey pair.

The keystone role here is seed dispersal and recruitment. The prediction follows the controlled interaction: fewer agoutis → fewer successfully dispersed Brazil-nut seeds → long-term decline of trees and dependent species.

The largest effect may be delayed because adult Brazil-nut trees are long-lived. Short-term persistence of mature trees would not show that seed dispersal and future recruitment are secure.

Stability Emerges from Flows, Diversity and Feedback

continued energy input + nutrient recycling + diversity + tolerable abiotic conditions → ecological functions persist or recover; disturbance that weakens these supports can trigger reinforcing change and a new state

Question Evidence to seek
Is the ecosystem stable? persistence or recovery of named structures and processes over a stated timescale
Is a tipping point plausible? threshold-like response plus reinforcing feedback
Does one species have a keystone role? disproportionate community change after its removal
Does a mesocosm support the mechanism? replicated treatment–control difference with variables held constant

Do not equate stable with unchanged, old with invulnerable, or correlated change with a demonstrated feedback mechanism.

A Renewable Resource Is Sustainable Only When Removal Fits Replacement

Long-term harvesting is sustainable when removal, natural mortality and habitat damage do not exceed recruitment, growth and recovery of a viable reproducing population.

  1. Estimate stock size and its uncertainty.
  2. Measure recruitment, growth, age or size structure and natural mortality.
  3. Record harvested biomass, by-catch and habitat damage.
  4. Compare removal with replacement across many years.
  5. Reduce harvest when recovery indicators weaken.

Renewable does not mean inexhaustible. A population can replenish itself only while enough breeding individuals and suitable habitat remain.

Fishery Sustainability Depends on Recruitment and Age Structure

Stock observation Likely interpretation
many juveniles reaching reproductive age recruitment can support future stock, if they survive
few large breeding adults reproductive capacity may be weakened
catch stays high while fishing effort rises stock may be declining despite similar landings
by-catch or habitat damage increases harvest cost extends beyond the target stock

Maximum sustainable yield is an estimated long-term catch near the balance between stock growth and losses. It depends on uncertain, variable recruitment and should be updated with long time-series data.

A single year’s catch cannot establish sustainability. Illegal discarding or poor age data can bias stock estimates and make a quota unsafe.

Forest Harvest Must Replace Timber without Degrading the Next Forest

Measure Sustainable direction
extracted timber volume no greater than replacement growth over the management period
replanting and natural regeneration enough surviving trees of suitable species and age classes
soil disturbance and erosion minimized so future productivity is retained
habitat structure and carbon storage maintained across the managed landscape

Seedlings planted today are not immediate replacements for mature trees. Assessment must use the time needed to restore biomass, habitat and carbon, not just a count of stems planted.

High short-term yield can coexist with falling long-term forest capacity. Sustainability prioritizes the continuing system over one harvest cycle.

Soil Loss Can Turn Agricultural Production into a Short-Lived Gain

  1. Vegetation removal exposes soil to rain and wind.
  2. Soil particles and organic matter are detached and transported.
  3. Topsoil depth, structure, water retention and nutrient stores decline.
  4. Crop growth becomes more dependent on irrigation and external fertilizer.
  5. Further poor cover or tillage accelerates the loss.
Practice Stability benefit
cover crops or residue retention shields soil and adds organic matter
contouring and reduced tillage slows runoff and soil detachment
rotations and mixed vegetation supports soil biota and interrupts pest cycles

Fertile soil can form far more slowly than it is eroded, so it is effectively non-renewable on human farming timescales.

Agricultural Sustainability Is a Multi-Criterion Judgment

Decision Potential gain Sustainability cost to monitor
fertilizer use replaces limiting nutrients and raises yield leaching, eutrophication and energy cost
pesticide use reduces crop loss non-target effects, resistance and biomagnification if persistent
irrigation maintains growth during water shortage aquifer depletion, salinization and energy use
local seasonal supply can reduce transport yield, storage and production method still affect total footprint
  • maintain soil depth, structure and nutrient balance
  • protect water quality and biodiversity
  • keep greenhouse-gas emissions and fossil-energy use within long-term limits
  • judge yield together with external inputs and damage

No single favourable indicator proves sustainability. A high yield can depend on soil depletion, pollution or carbon emissions shifted outside the field boundary.

Eutrophication Converts Nutrient Enrichment into Oxygen Loss

  1. Nitrate and phosphate inputs remove a nutrient limit on algae or cyanobacteria.
  2. A bloom reduces light penetration, so submerged plants die.
  3. Bloom cells also die, increasing dead organic matter.
  4. Decomposer populations and aerobic respiration increase.
  5. Biochemical oxygen demand rises as dissolved oxygen is consumed.
  6. Hypoxia or anoxia kills or excludes oxygen-dependent animals.

Algae do not directly “use up all the oxygen” simply by growing. The key oxygen-loss step is respiration, especially by decomposers processing dead biomass.

A nutrient-enrichment sequence shows nitrate and phosphate runoff, an algal bloom, shading and plant death, decomposer growth, higher biochemical oxygen demand, falling dissolved oxygen and fish death or migration.

BOD Measures Oxygen Consumed while Organic Matter Is Decomposed

Biochemical oxygen demand (BOD) is the amount of dissolved oxygen used by aerobic biological activity while organic matter in a measured volume of water is broken down.

  1. Measure dissolved oxygen in a known water sample.
  2. Incubate the sealed sample in darkness at 20 °C for five days.
  3. Measure dissolved oxygen again.
  4. Initial oxygen − final oxygen gives the five-day BOD.

Darkness prevents photosynthesis from replacing oxygen during incubation. High BOD indicates much respirable organic matter and/or strong decomposer activity, not high oxygen availability.

Use matched volume, temperature, time and handling. BOD is an indirect pollution measure and does not identify the pollutant by itself.

Eutrophication Changes More Than Dissolved Oxygen

Ecosystem property Typical eutrophication change
light penetration falls as algal biomass and turbidity rise
submerged macrophytes decline when photosynthesis becomes light-limited
producer diversity often falls as bloom-forming species dominate
food-chain length can shorten as habitats and oxygen-sensitive consumers disappear
net production may rise initially even while stability and diversity fall

Early nutrient enrichment can produce high primary production; later death, decomposition and hypoxia create the ecological damage. Sampling at only one time point can miss this sequence.

High productivity is not the same as a healthy or stable ecosystem. Composition, oxygen regime and food-web structure must also be judged.

Bioaccumulation Happens within Organisms; Biomagnification Happens across Trophic Levels

Process Comparison being made
bioaccumulation toxin concentration in one organism increases over time because uptake exceeds breakdown and excretion
biomagnification toxin concentration per unit biomass increases from one trophic level to the next

Persistence prevents rapid degradation; fat solubility and poor excretion retain compounds such as DDT; predators consume contaminant loads from many prey.

A food-chain pyramid shows DDT concentration increasing from producers to primary and secondary consumers and a top predator, alongside one fish accumulating more toxin over time.

A Dilute Persistent Pollutant Can Reach a Toxic Dose in Top Predators

  1. A dilute persistent pollutant enters producers from water or soil.
  2. Primary consumers eat many contaminated producers.
  3. Predators retain pollutant faster than they eliminate it and consume many contaminated prey.
  4. Concentration per gram of tissue increases at successive trophic levels.
  5. Long-lived top predators receive the greatest dose and may suffer reproductive or neurological harm.
DDT property or effect Consequence
persistent and fat-soluble retained in animal tissues
biomagnifies birds of prey receive high tissue concentrations
disrupts calcium deposition thin eggshells crack more easily, reducing breeding success

The pollutant does not create extra mass at each trophic level. Concentration rises because predators assimilate contaminants from many prey while biomass and energy are lost between levels.

Ocean Plastics Persist, Fragment and Move between Compartments

Plastic class Operational size and examples Dominant exposure route
macroplastic greater than 5 mm; bags, bottles, line and packaging entanglement, obstruction and ingestion as visible debris
microplastic less than 5 mm; fragments, fibres and industrial particles ingestion by small organisms and food-web transfer
  1. Wind, rivers and ships deliver plastic to surface water and coasts.
  2. UV radiation and wave action fragment items but do not mineralize them rapidly.
  3. Biofouling can make particles sink; resuspension can return them to water.
  4. Plastic and associated chemicals enter organisms and food webs.

Fragmentation is not biodegradation. It redistributes the same persistent material into smaller particles with greater surface area and access to smaller organisms.

Plastic Harms Marine Animals through Physical and Chemical Routes

Route Example consequence
entanglement restricted movement, injury, drowning or impaired feeding
mistaken ingestion gut blockage, false satiation and starvation
transfer to offspring albatross adults feed floating plastic to chicks that cannot regurgitate it
chemical transport additives or persistent pollutants associated with plastic can enter tissues and food webs

Sea turtles can mistake plastic bags for jellyfish. Albatrosses skim food from the ocean surface, where floating debris accumulates; mechanism and feeding behavior explain exposure better than a generic pollution claim.

Not every effect requires biomagnification. Entanglement and blockage are direct physical harms; chemical accumulation is a separate pathway that needs pollutant evidence.

Rewilding Restores Processes Rather Than Reconstructing a Static Snapshot

  • reconnect habitat fragments so organisms can disperse and breed
  • remove or control invasive species that block native recovery
  • reintroduce missing keystone species or apex predators where risks are understood
  • reduce intensive harvesting and allow succession, predation and decomposition to operate

The goal is a more self-sustaining system whose interactions maintain diversity and function with less continuous human control.

Rewilding is not simply “leave everything alone.” Reintroductions, invasive removal and corridors require monitoring for animal welfare, conflict, disease and unintended trophic effects.

Hinewai Uses Minimal Intervention after Removing Barriers to Recovery

  1. Formerly cleared land is protected from renewed intensive use.
  2. Alien trees and vines that suppress native regeneration are removed.
  3. Native plants recolonize and succession rebuilds forest structure.
  4. Habitat and food resources permit endemic fauna to re-establish.
  5. Management monitors recovery while allowing natural processes to do most of the work.

Minimal intervention occurs after key pressures are removed. Hinewai therefore links restoration to succession: management creates conditions in which native community change can proceed.

Success is not measured only by tree cover. Native composition, connectivity, regeneration, fauna and ecological processes are also evidence of recovery.

Human Use Is Sustainable Only When Ecological Recovery Remains Possible

measure stock and ecosystem condition → keep removal and pollution within recovery capacity → monitor delayed and indirect effects → reduce pressure or restore processes when indicators deteriorate

Pressure Mechanism to name
excess nutrient input bloom → dead biomass → decomposer respiration → high BOD → hypoxia
persistent toxin retention within organisms plus concentration across trophic levels
marine plastic persistence, fragmentation, entanglement, ingestion and chemical transfer
harvesting removal relative to recruitment, growth, age structure and habitat condition
degraded habitat connectivity, species interactions and succession restored through rewilding

A resource being renewable, a crop yield being high or a restoration site becoming greener is not enough. Sustainability claims require evidence that future ecological capacity is retained.

Requirements for stability

4 marks

Outline the features of ecosystems that make them sustainable.

Mesocosm model

3 marks

Mesocosm experiments using water from Narragansett Bay were completed in the laboratory during a six month period. Discuss advantages and limitations of carrying out mesocosm investigations. be marked.

Keystone species

6 marks

Explain how an ecological community structure could be affected by the removal of a keystone species.

Sustainable resource harvesting

4 marks

Discuss the impact of overfishing in Lake Kariba and how sustainable harvesting of resources can be assessed.

Agriculture sustainability factors

6 marks

Discuss the risks and benefits associated with the use of phosphate fertilizers in agriculture.

Eutrophication exam focus

6 marks

Discuss the causes and consequences of eutrophication.

Biomagnification exam focus

6 marks

Discuss the use of DDT (dichlorodiphenyltrichloroethane) in the control of the malarial parasite.

Plastic pollution of oceans

4 marks

Explain the consequences of plastic pollution in marine environments.

Rewilding exam focus

2 marks

Outline two methods of restoration of natural processes in ecosystems by rewilding, other than reintroducing a keystone species.
1.
2.