
Question 10(c)(iv)
[Maximum number: 2]
Diagram 1 shows the apparatus a student uses to investigate the bending of a wooden strip.
Part of the wooden strip is clamped to a table.
A load is fixed to the free end of the wooden strip, causing it to bend.
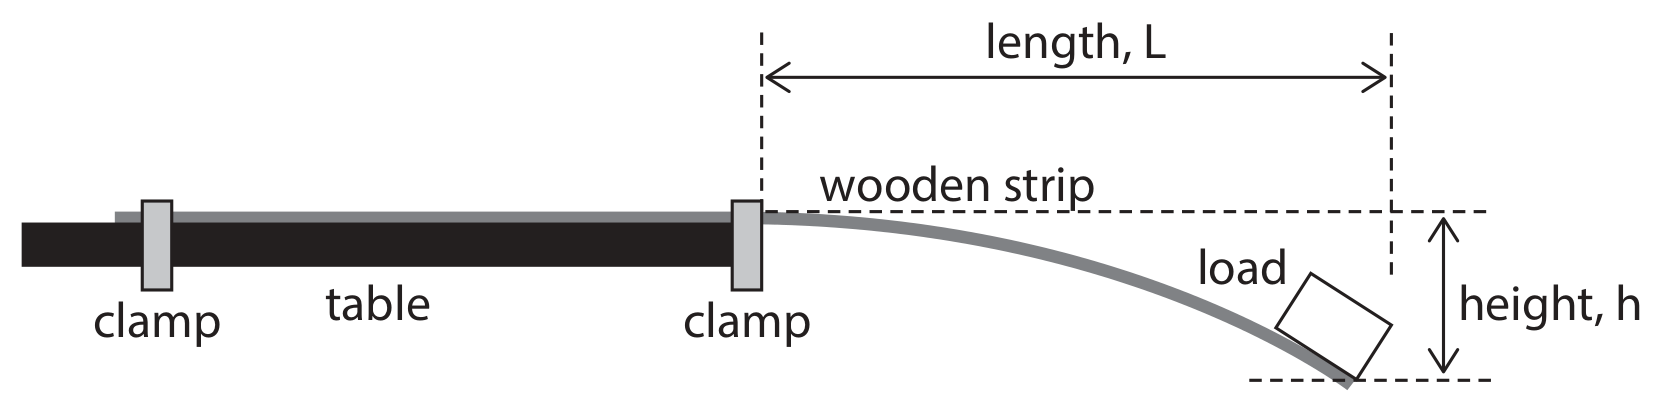
Diagram 1
The free end of the wooden strip is positioned a length, L , beyond the edge of the table, as shown in diagram 1.
The weight of the load causes the end of the wooden strip to move down through a height, h.
A student investigates how the length, L , affects the height, h .
The table shows the results of the investigation.
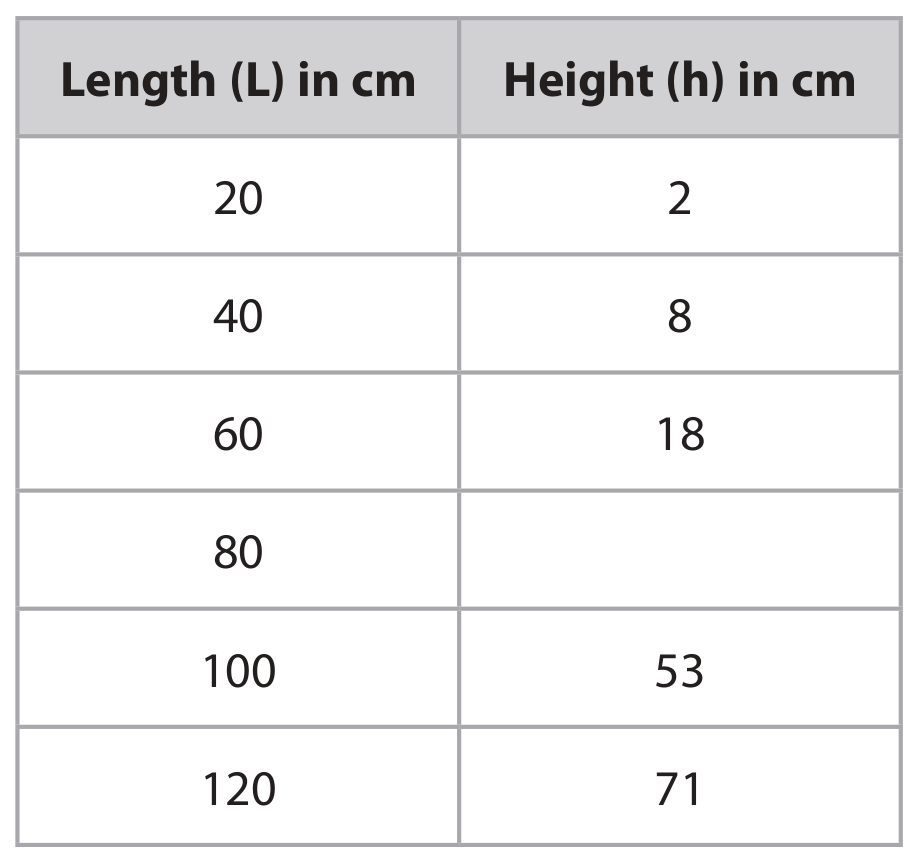
The student concludes that h is directly proportional to L .
Evaluate the student's conclusion.