CAIE IGCSE Mathematics Extended E9.7.1 Draw & interpret histograms.
Practise drawing and completing histograms from grouped frequency tables, with correct bar widths and heights on the grid.
- Syllabus
- 2028–2030
- Objective
- E9.7.1
- Level
- Extended
Practise drawing and completing histograms from grouped frequency tables, with correct bar widths and heights on the grid.
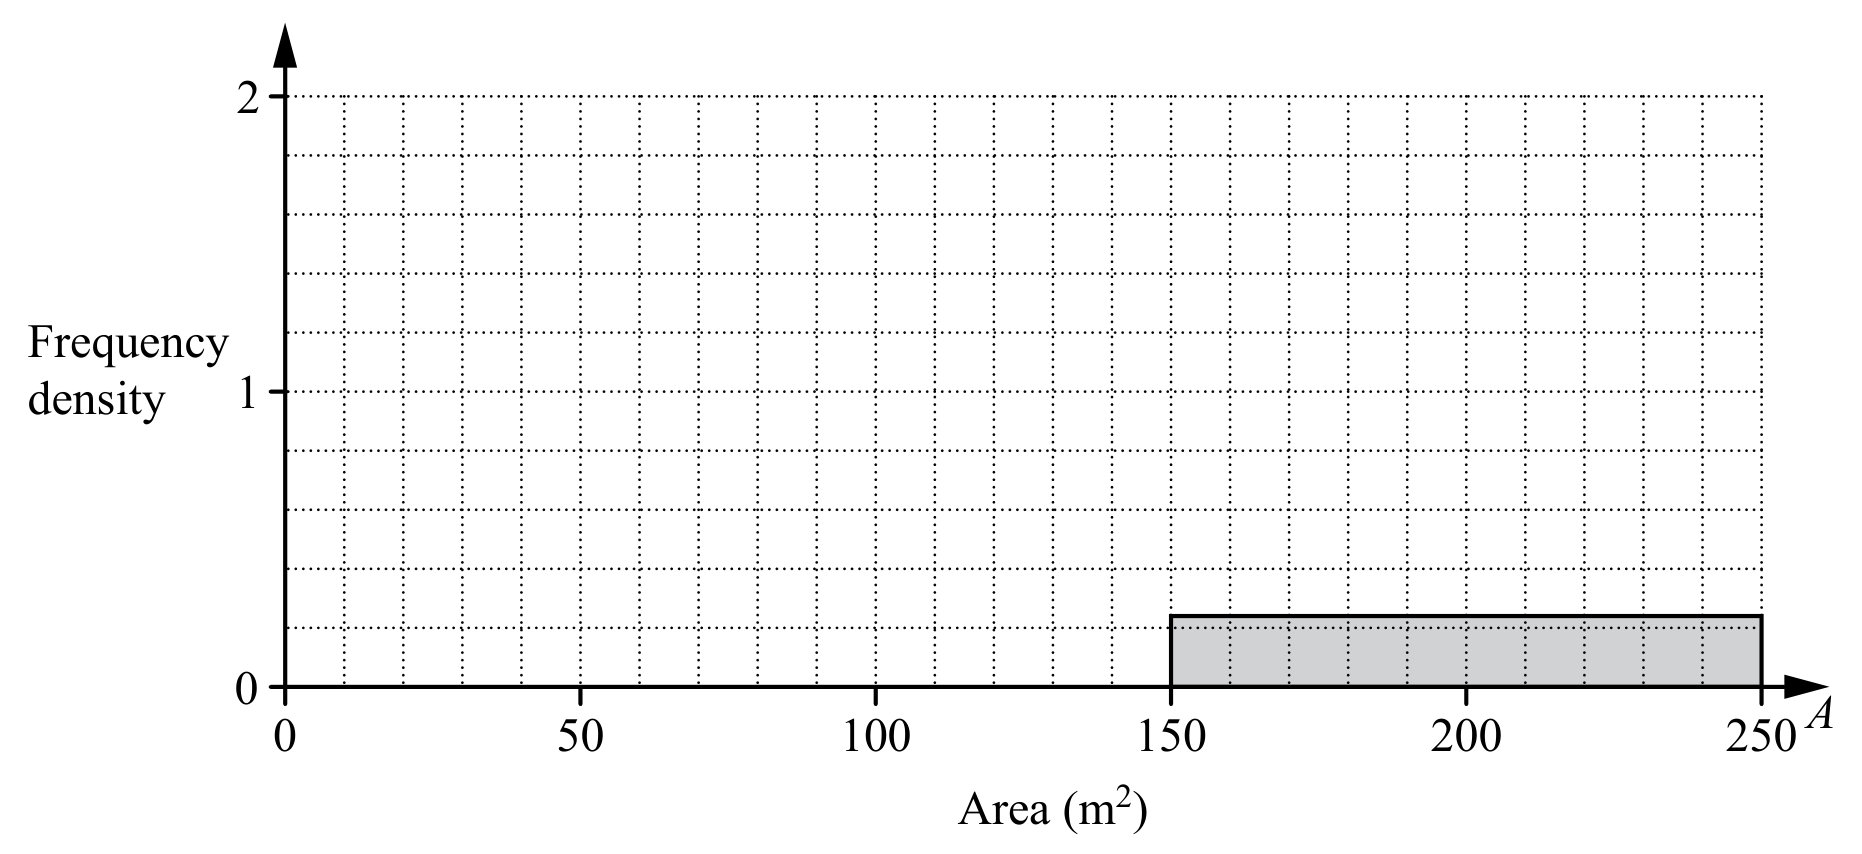
The 200 students also estimate the total area, , of the windows in the classroom. The table shows their results.

Complete the histogram to show the information in the table.