CAIE IGCSE Mathematics Extended Statistical Charts

Practise turning frequencies or summary statistics into accurate pie-chart sectors, ordered stem-and-leaf displays and scaled box-and-whisker plots.

Syllabus
2028–2030
Objective
E9.4.1
Level
Extended

Exam points

  • calculate a category's pie-chart angle as its fraction of the total multiplied by 360°
  • sort the raw observations into ordered leaves and provide a key showing their place value
  • draw the box, median and whiskers at the five-number-summary positions on the given scale

E9.4.1 Draw and interpret: (a) bar charts (b) pie charts (c) pictograms (d) question 1

[Maximum number: 4]

Question (a)

(a)

The list shows 15 midday temperatures, in degrees Celsius, in Suntown.

Table for Question (a) — CAIE IGCSE Mathematics Extended
[ 4 ]

Question (i)

(i)

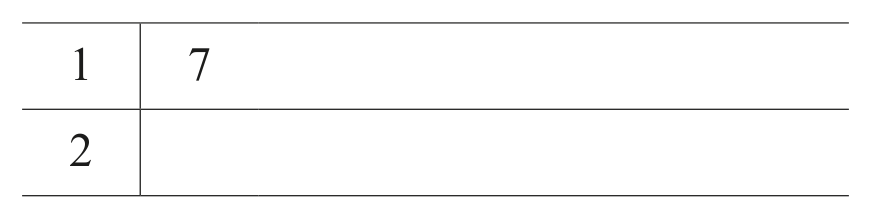
Complete the stem-and-leaf diagram to show this information.

Table for Question (i) — CAIE IGCSE Mathematics Extended

Key: 171 \mid 7 represents 17C17^{\circ} \mathrm{C}

[ 2 ]

Question (ii)

(ii)

Rahul draws a pie chart to show this information.

Calculate the sector angle for the number of days the temperature is 18C18^{\circ} \mathrm{C}.

[ 2 ]
All question bank results loaded