EduNinja

IGCSE Mathematics ExtendedE2.9.3 Apply the idea of rate of change to simple kinematics involvingTopic Practice

E2.9.3 Apply the idea of rate of change to simple kinematics involving

• Apply the idea of rate of change to simple kinematics involving distance–time and speed–time graphs, acceleration and deceleration.

Question 2

[Maximum number: 3]

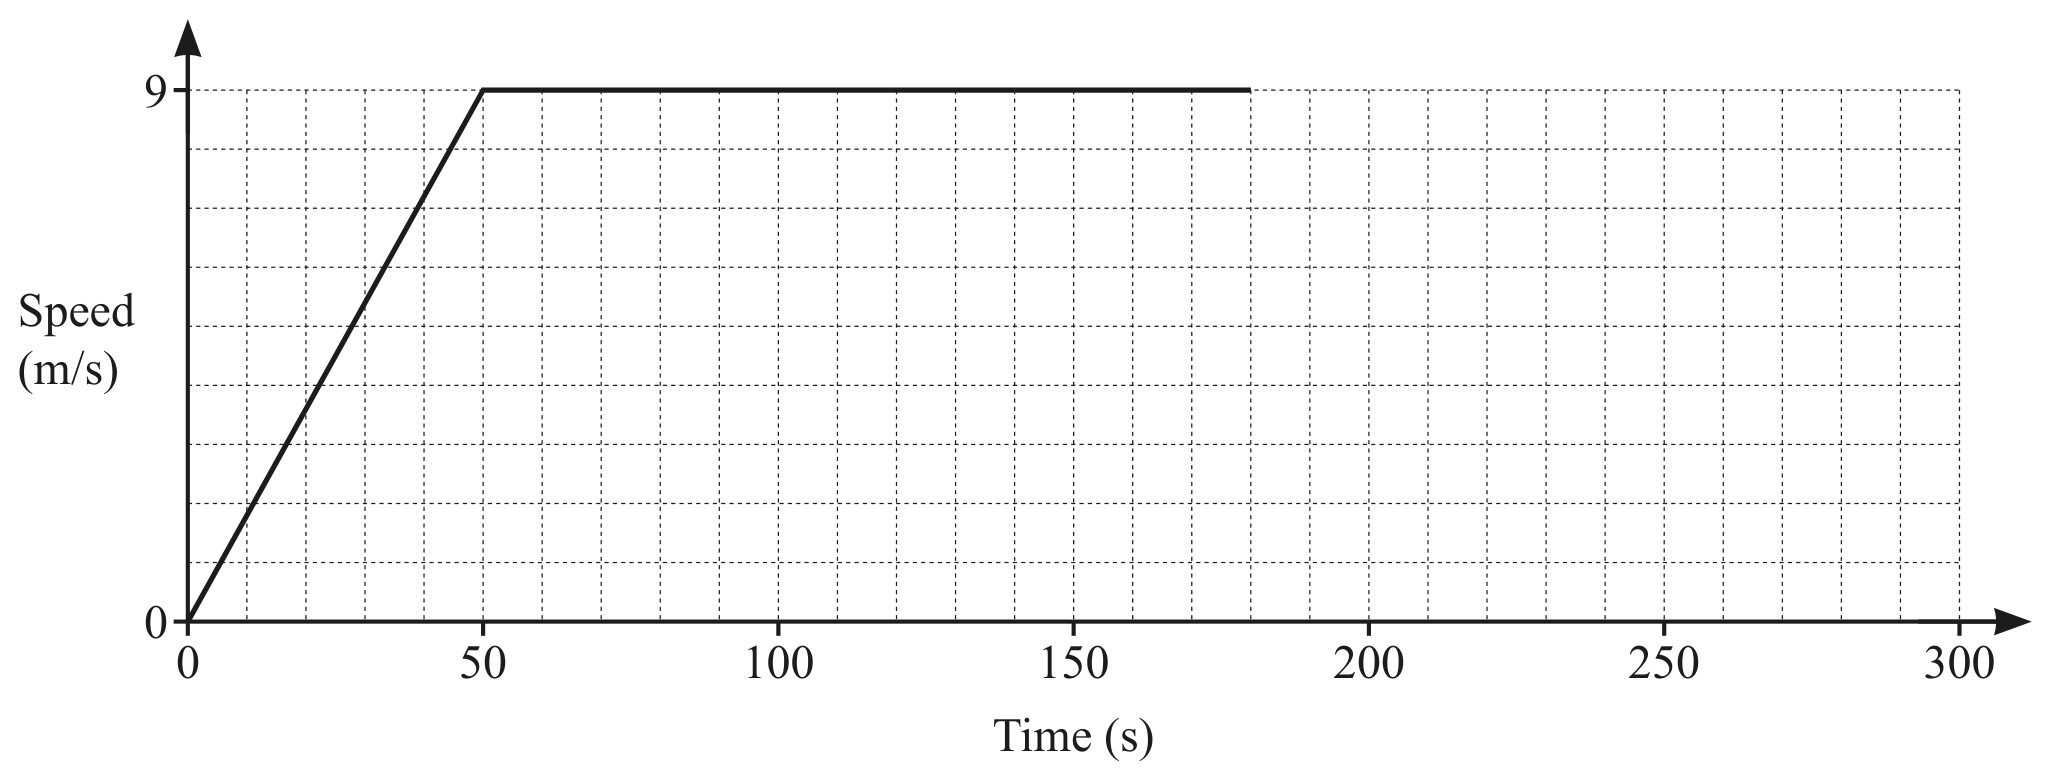
The diagram shows the speed-time graph for the first 180 seconds of a train journey.
Question image

Question 2(a)

(a)

Find the acceleration, in m/s2\mathrm{m} / \mathrm{s}^{2}, of the train during the first 50 seconds. m/s2\mathrm{m} / \mathrm{s}^{2}

[ 1 ]

Question 2(b)

(b)

After 180 seconds, the train decelerates at a constant rate of 1944 km/h21944 \mathbf{~ k m} / \mathbf{h}^{\mathbf{2}}.

Show that the train decelerates for 60 seconds until it stops.

[ 2 ]
Question 11

[Maximum number: 3]

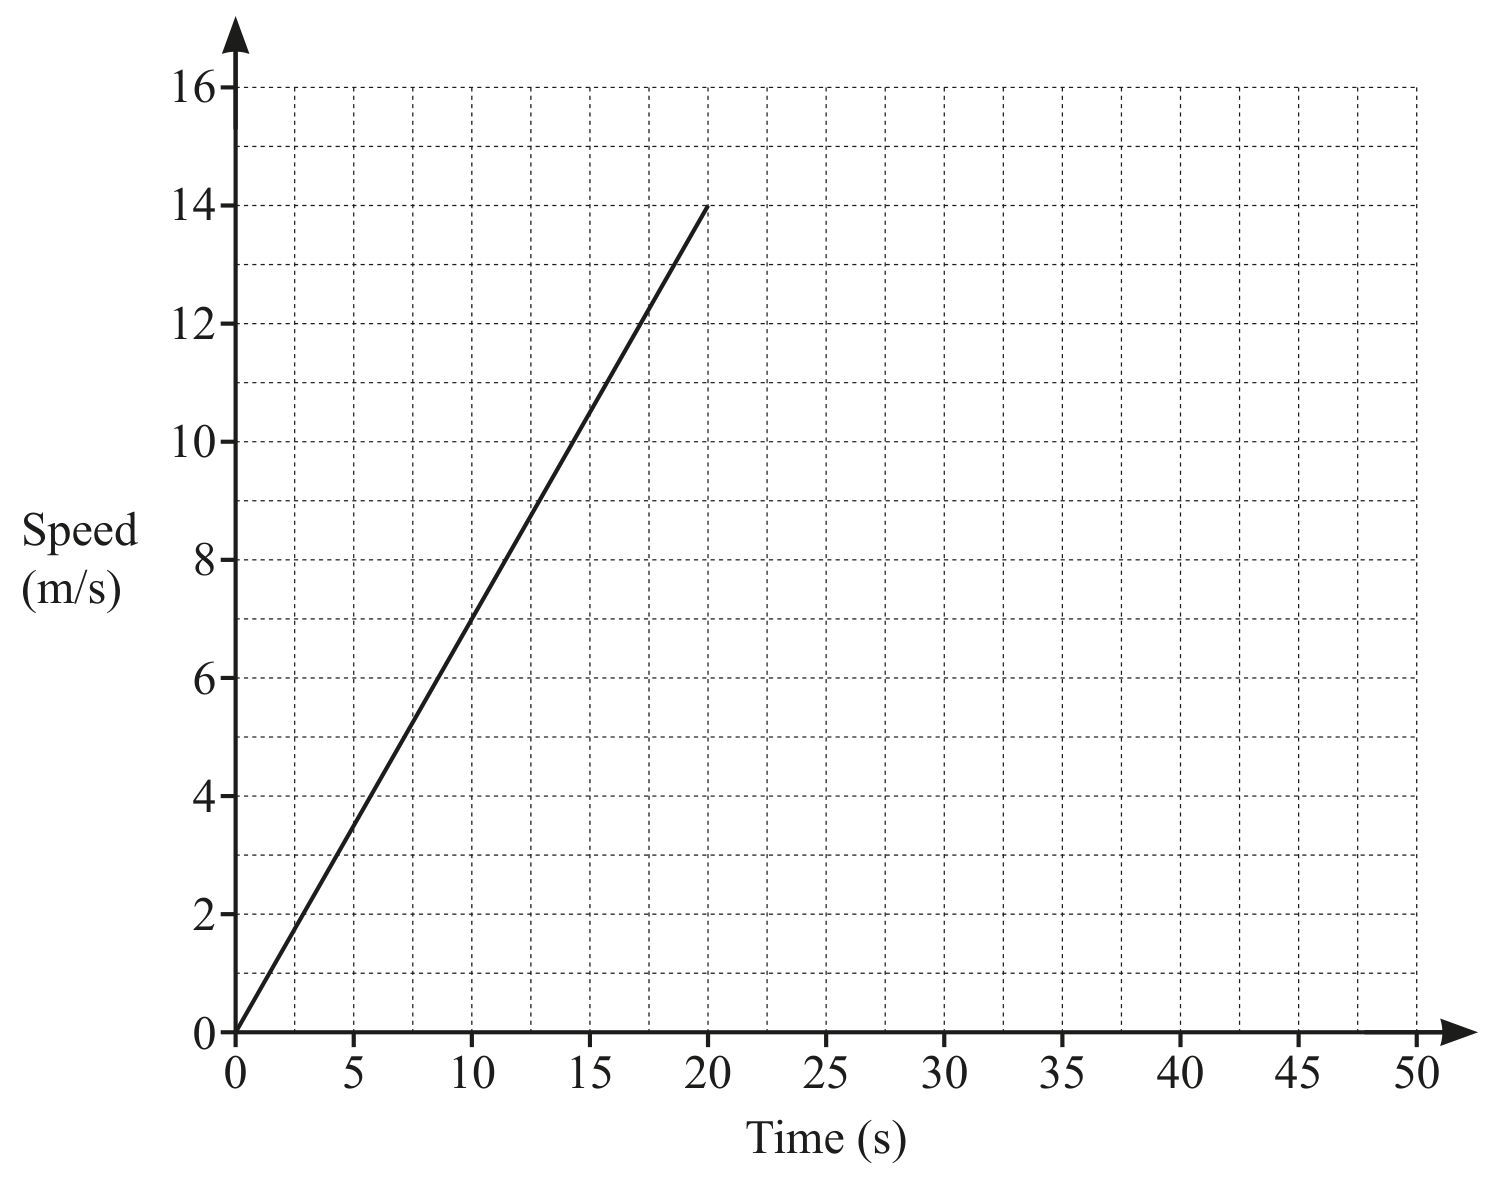
A car starts its journey by accelerating from rest at a constant rate of 0.7 m/s20.7 \mathrm{~m} / \mathrm{s}^{2} for 20 seconds, before reaching a constant speed of 14 m/s14 \mathrm{~m} / \mathrm{s}.
It then travels at 14 m/s14 \mathrm{~m} / \mathrm{s} for a distance of 210 m .
The car then decelerates at a constant rate of 1.4 m/s21.4 \mathrm{~m} / \mathrm{s}^{2}, before coming to a stop.

On the grid, complete the speed-time graph for the car's journey.

Question image

Question 12(a)

[Maximum number: 1]
Question image
 NOT TO  SCALE \begin{aligned} & \text { NOT TO } \\ & \text { SCALE } \end{aligned}

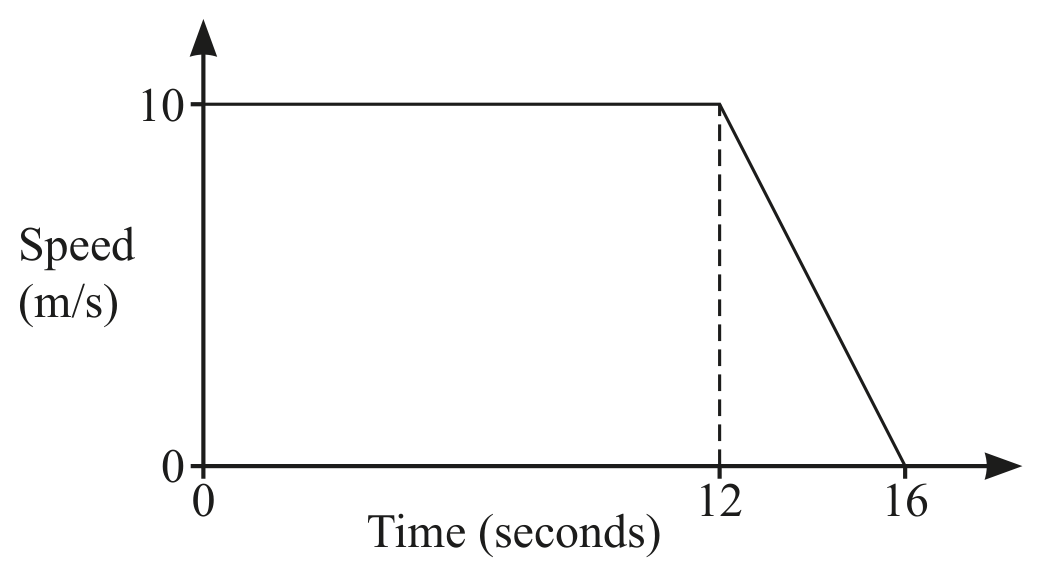
The diagram shows a speed-time graph for 16 seconds of a car journey.

Find the deceleration of the car in the final 4 seconds. m/s2\mathrm{m} / \mathrm{s}^{2}

Question 14(a)

[Maximum number: 1]

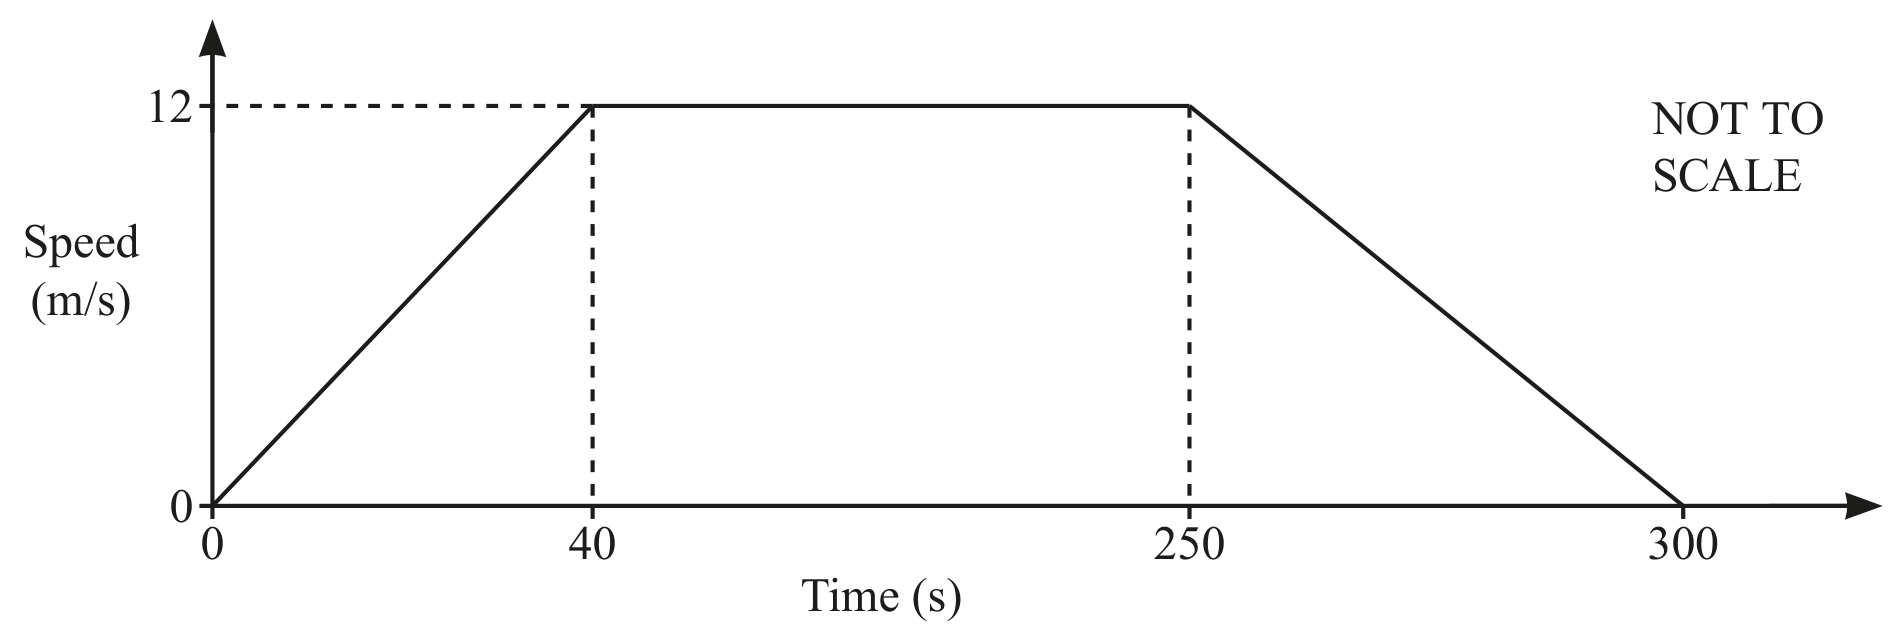
The diagram shows the speed-time graph of a train journey between two stations.

Question image

Find the acceleration of the train during the first 40 seconds. m/s2\mathrm{m} / \mathrm{s}^{2}

Question 13(a)

[Maximum number: 1]
Question image

NOT TO SCALE

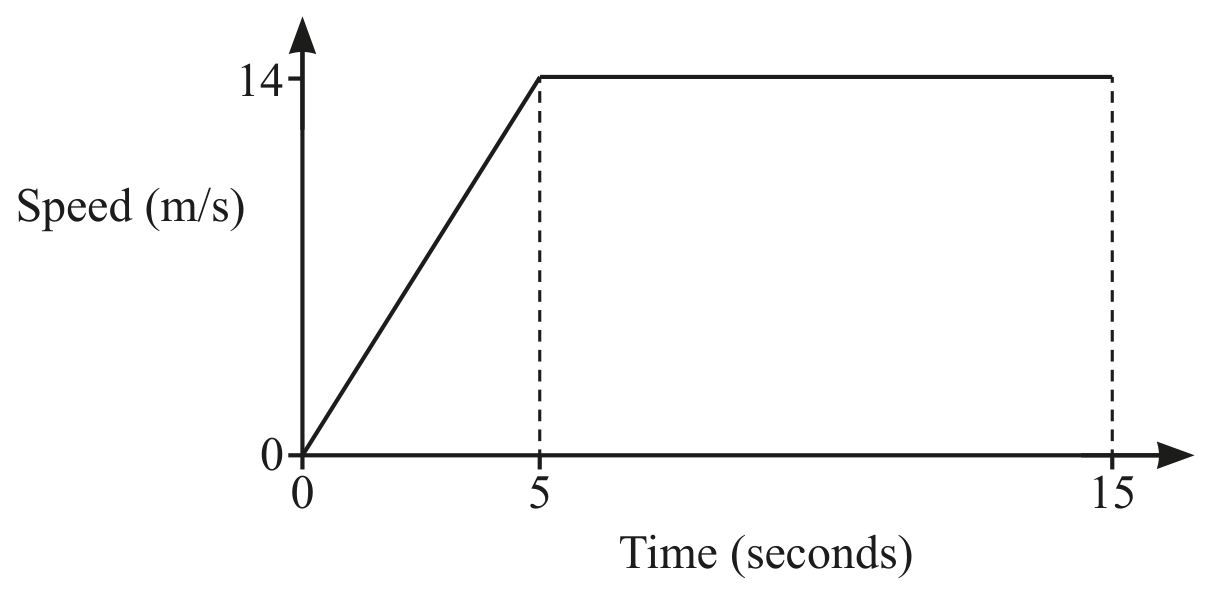
The diagram shows the speed-time graph of the first 15 seconds of a car journey.

Find the acceleration of the car during the first 5 seconds. m/s2\mathrm{m} / \mathrm{s}^{2}

Question 9(a)

[Maximum number: 1]
Question image

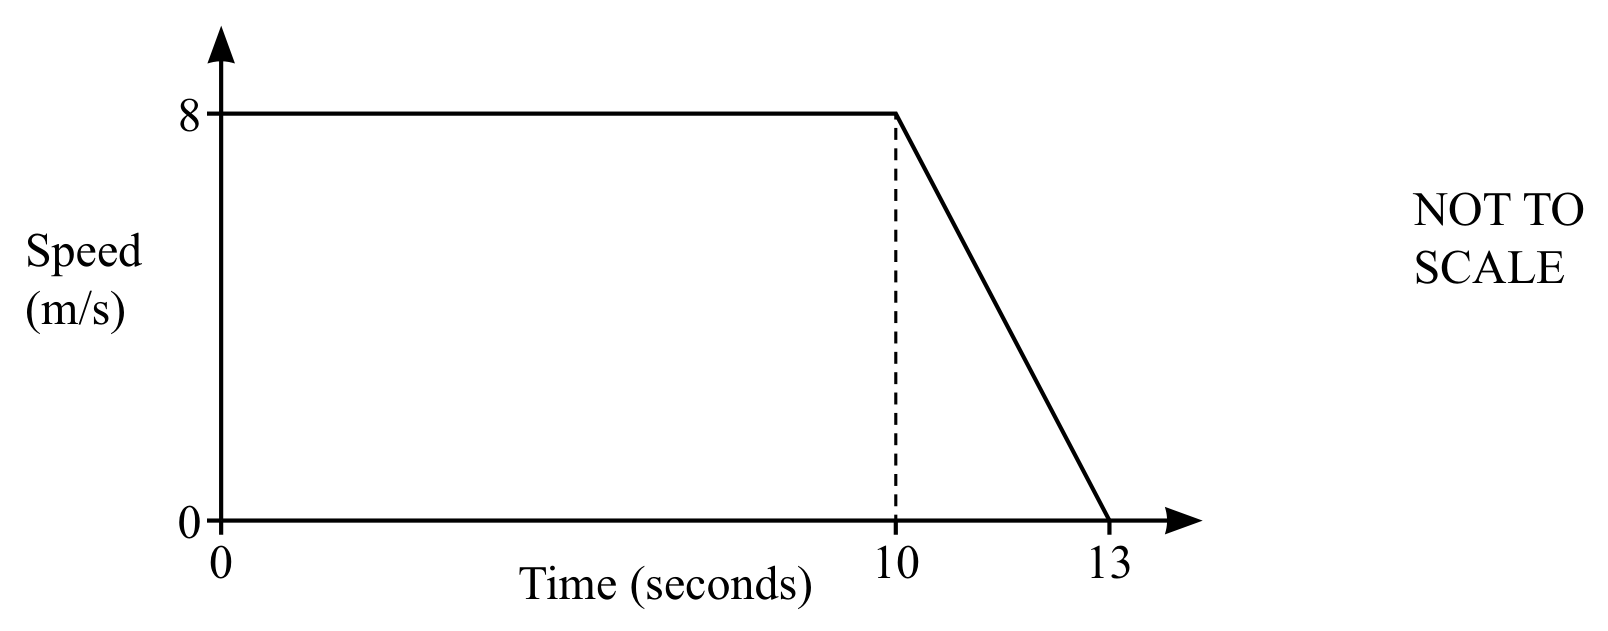
The diagram shows the speed-time graph of part of a car journey.

Find the deceleration of the car between 10 and 13 seconds. m/s2[1]\mathrm{m} / \mathrm{s}^{2}[1]

Question 15(a)

[Maximum number: 1]

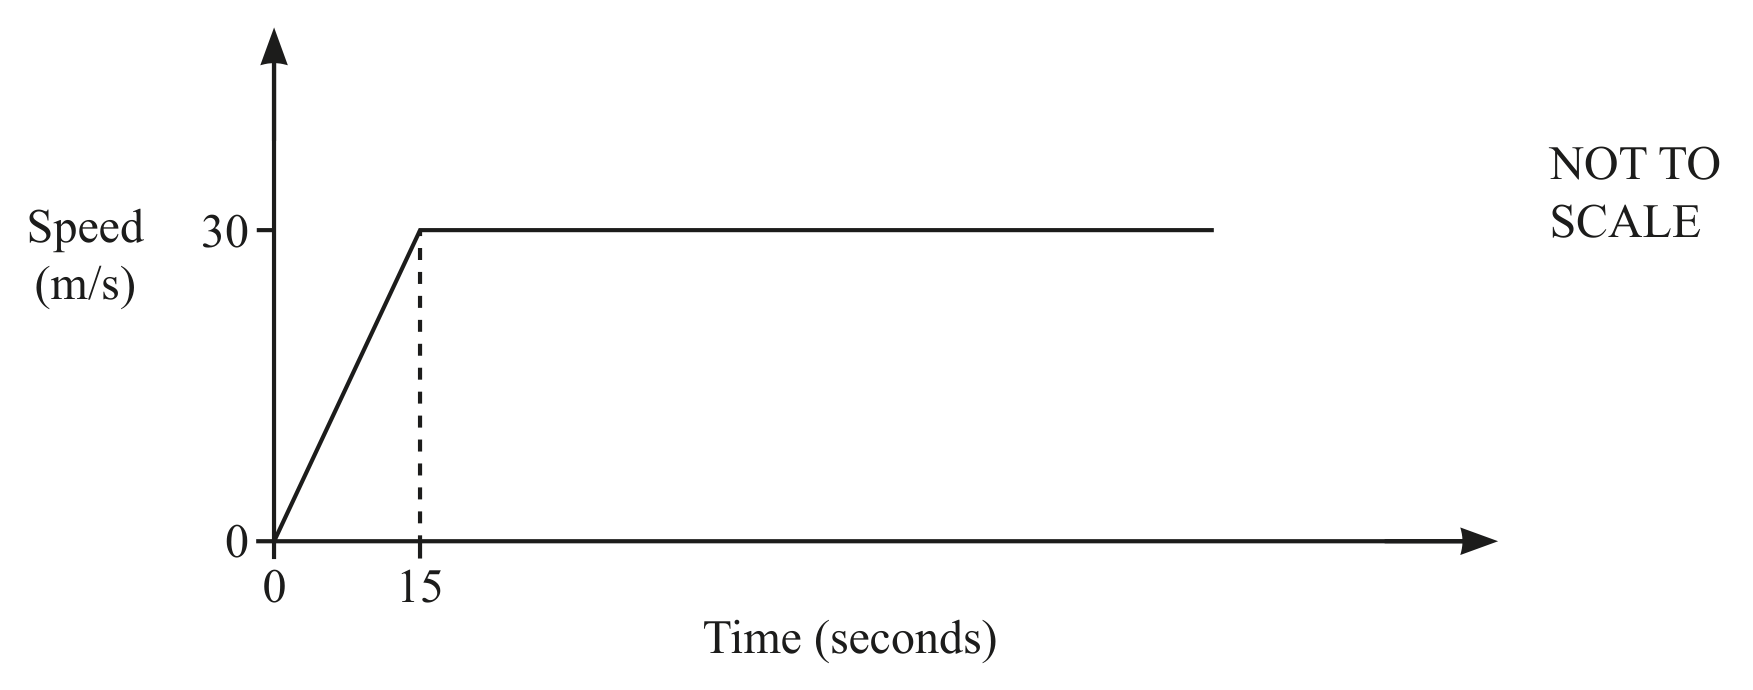
The diagram shows the speed-time graph for part of the journey of a car.

Question image

The car starts from rest and accelerates at a uniform rate for 15 seconds before reaching a constant speed of 30 m/s30 \mathrm{~m} / \mathrm{s}.

Calculate the acceleration for the first 15 seconds. m/s2\mathrm{m} / \mathrm{s}^{2} [1]

Question 14(a)

[Maximum number: 1]
Question image

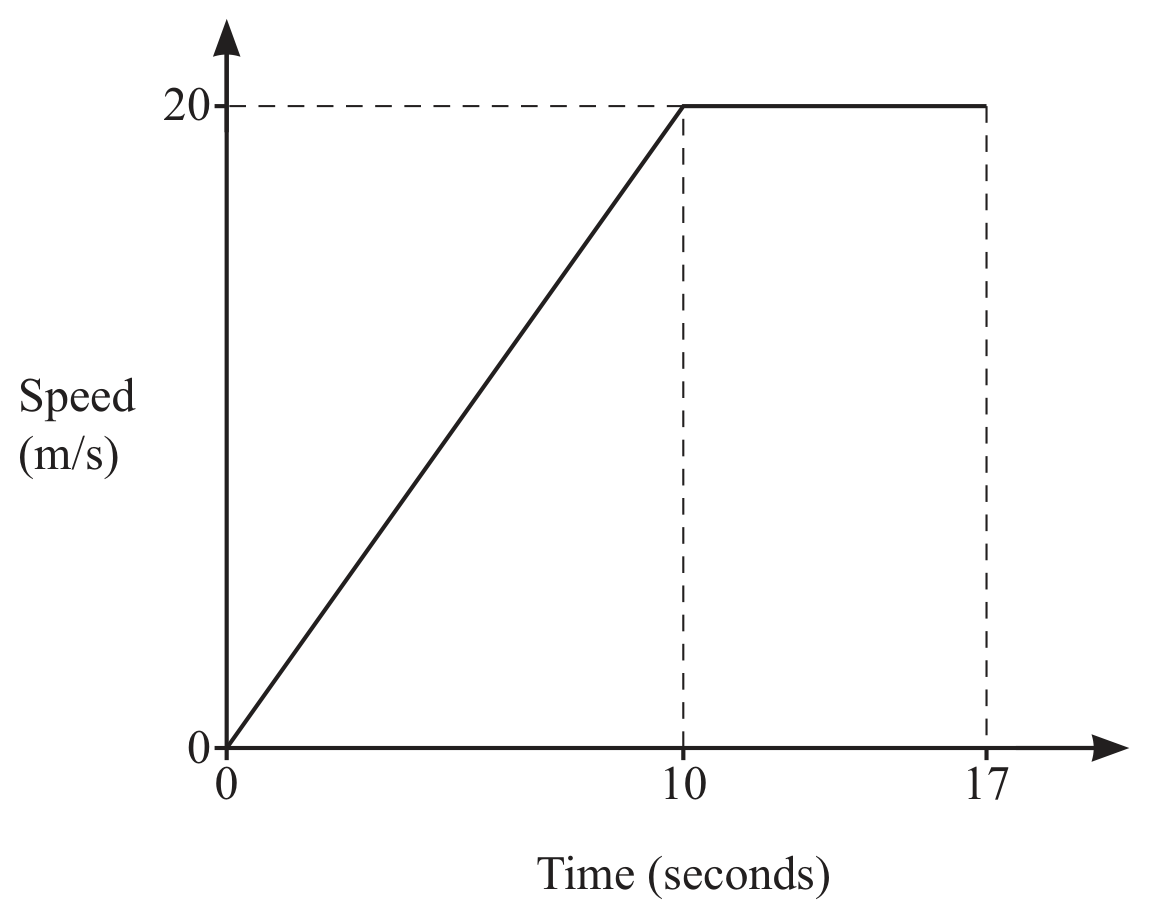
The diagram shows the speed-time graph for 17 seconds of a car journey.

Find the acceleration of the car during the first 10 seconds. m/s2\mathrm{m} / \mathrm{s}^{2}

Question 15(a)

[Maximum number: 1]
Question image

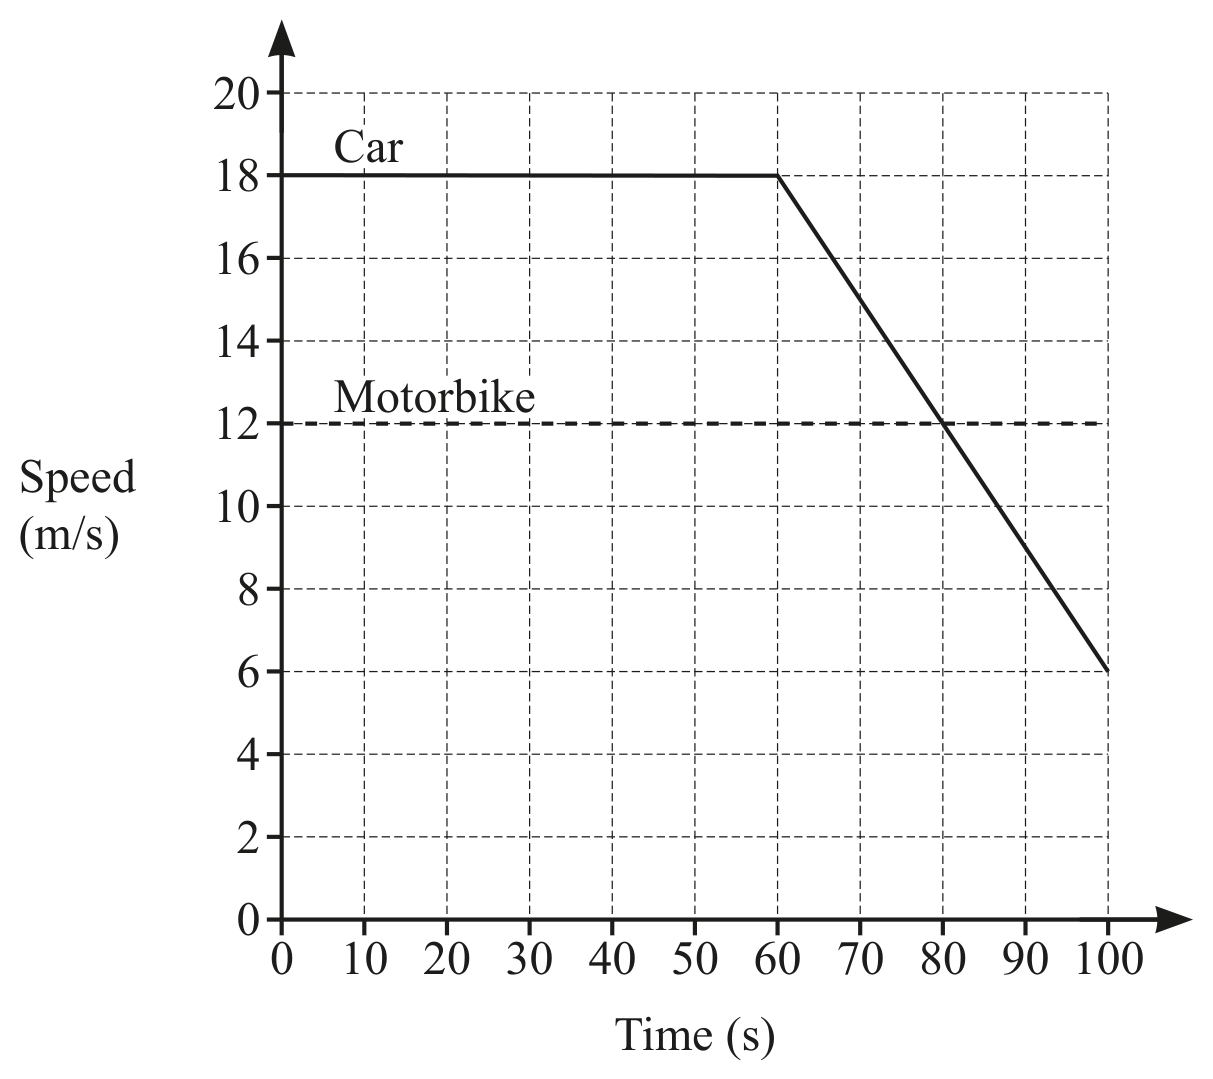
The diagram shows the speed-time graph for 100 seconds of the journey of a car and of a motorbike.

Find the deceleration of the car between 60 and 100 seconds. m/s2\mathrm{m} / \mathrm{s}^{2}

Question 20(a)

[Maximum number: 1]
Question image

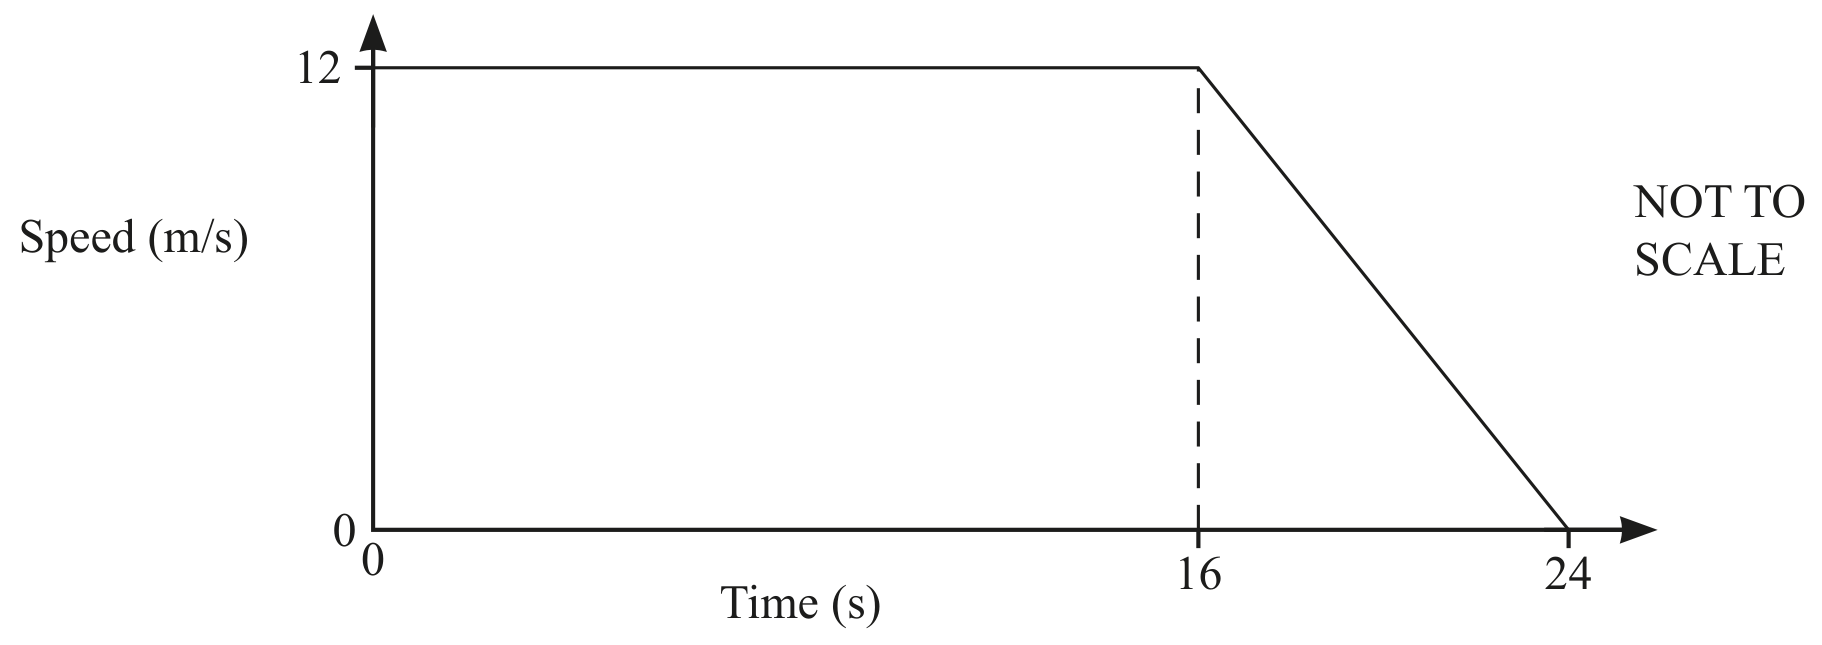
The diagram shows the speed-time graph for 24 seconds of a car journey.
Calculate

the deceleration of the car in the final 8 seconds, m/s2\mathrm{m} / \mathrm{s}^{2}

0 selected