CAIE IGCSE Mathematics Extended Drawing Practical Graphs from Data

Practise converting journey data into coordinates and joining them with ruled moving, stopping or returning sections on travel graphs.

Syllabus
2028–2030
Objective
E2.9.2
Level
Extended

Exam points

  • convert the stated start time, speed and distance into the correct endpoint coordinate
  • join constant-speed journey points with ruled straight lines at the graph's scale
  • draw horizontal rest intervals and connect later return or onward journey sections

E2.9.2 Draw graphs from given data. question 1

[Maximum number: 1]

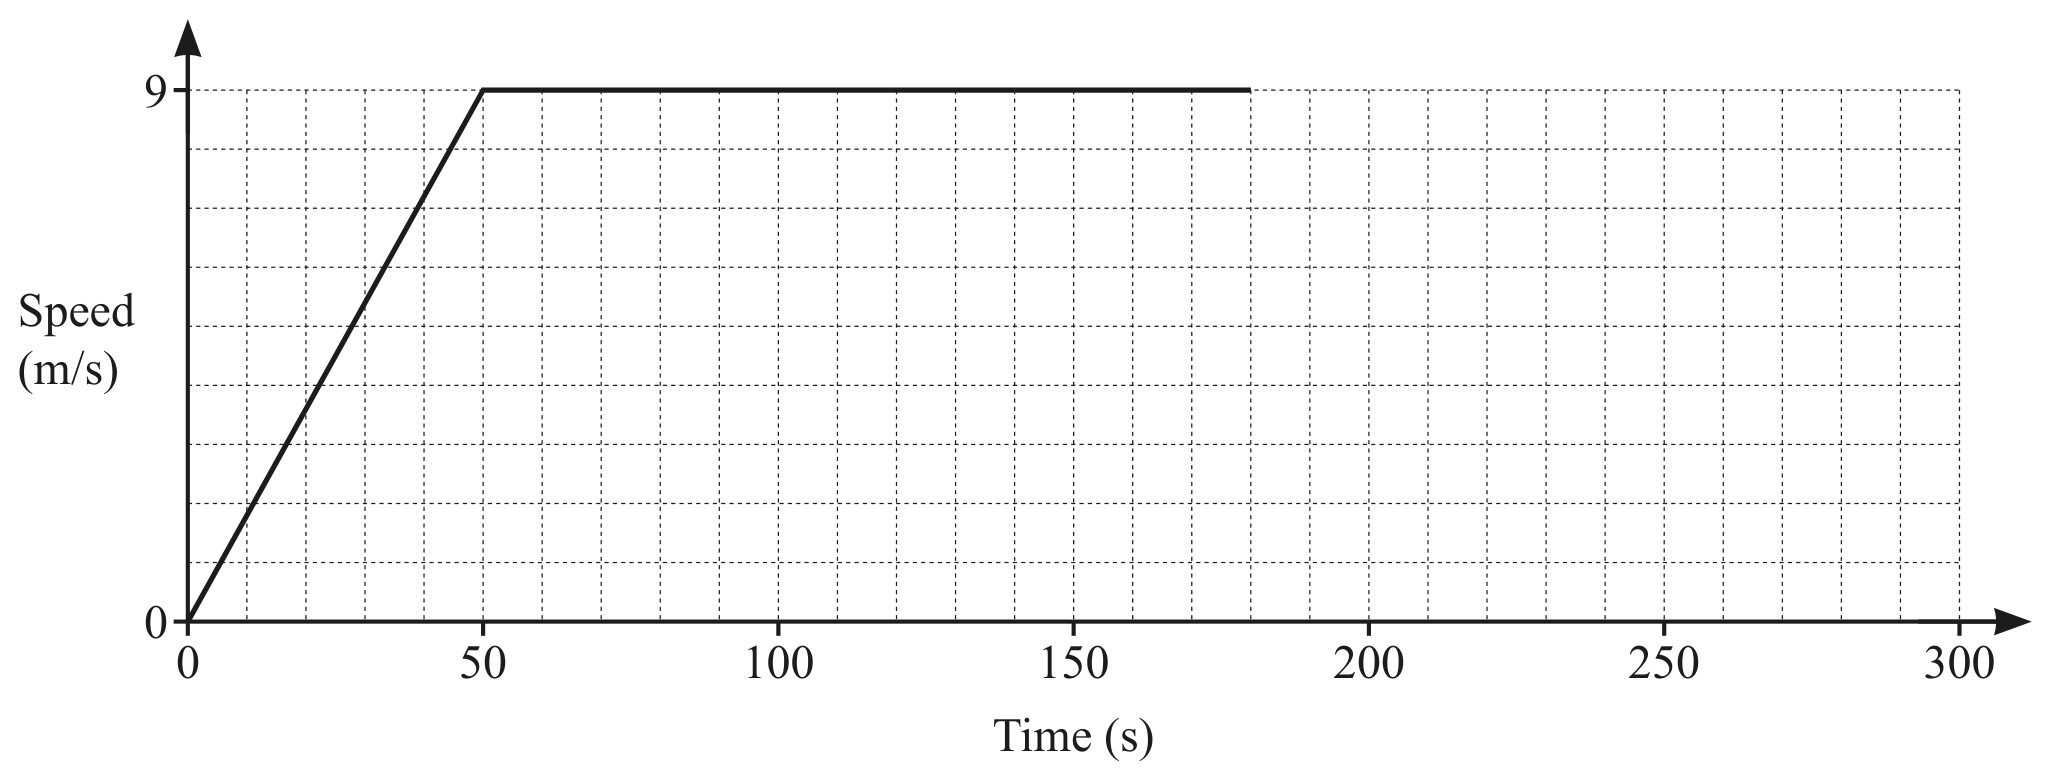
The diagram shows the speed-time graph for the first 180 seconds of a train journey.

Figure for Question E2.9.2 Draw graphs from given data. question 1 — CAIE IGCSE Mathematics Extended

Complete the speed-time graph.

All question bank results loaded