EduNinja

IGCSE Biology Extended19.4 PopulationsTopic Practice

19.4 Populations

CAIE IGCSE Biology Extended 19.4 Populations question practice helps you revise this syllabus point with the course map in view. Use this page to focus on one topic, check the style of questions available, and connect each attempt back to the knowledge area it is testing.

EduNinja keeps Biology practice aligned to CAIE at Extended level, so you can move from topic review into exam-style question bank work without losing the syllabus structure. Start with a small set, mark the weak steps, then return to nearby topic links when a definition, graph, calculation, or explanation needs repair.

Question 2

[Maximum number: 4]

Carp are a type of fish. Researchers in Brazil measured the body lengths of a population of carp in a river in 1998 and again in 2008.

Histograms of their results are shown in Fig. 2.1.
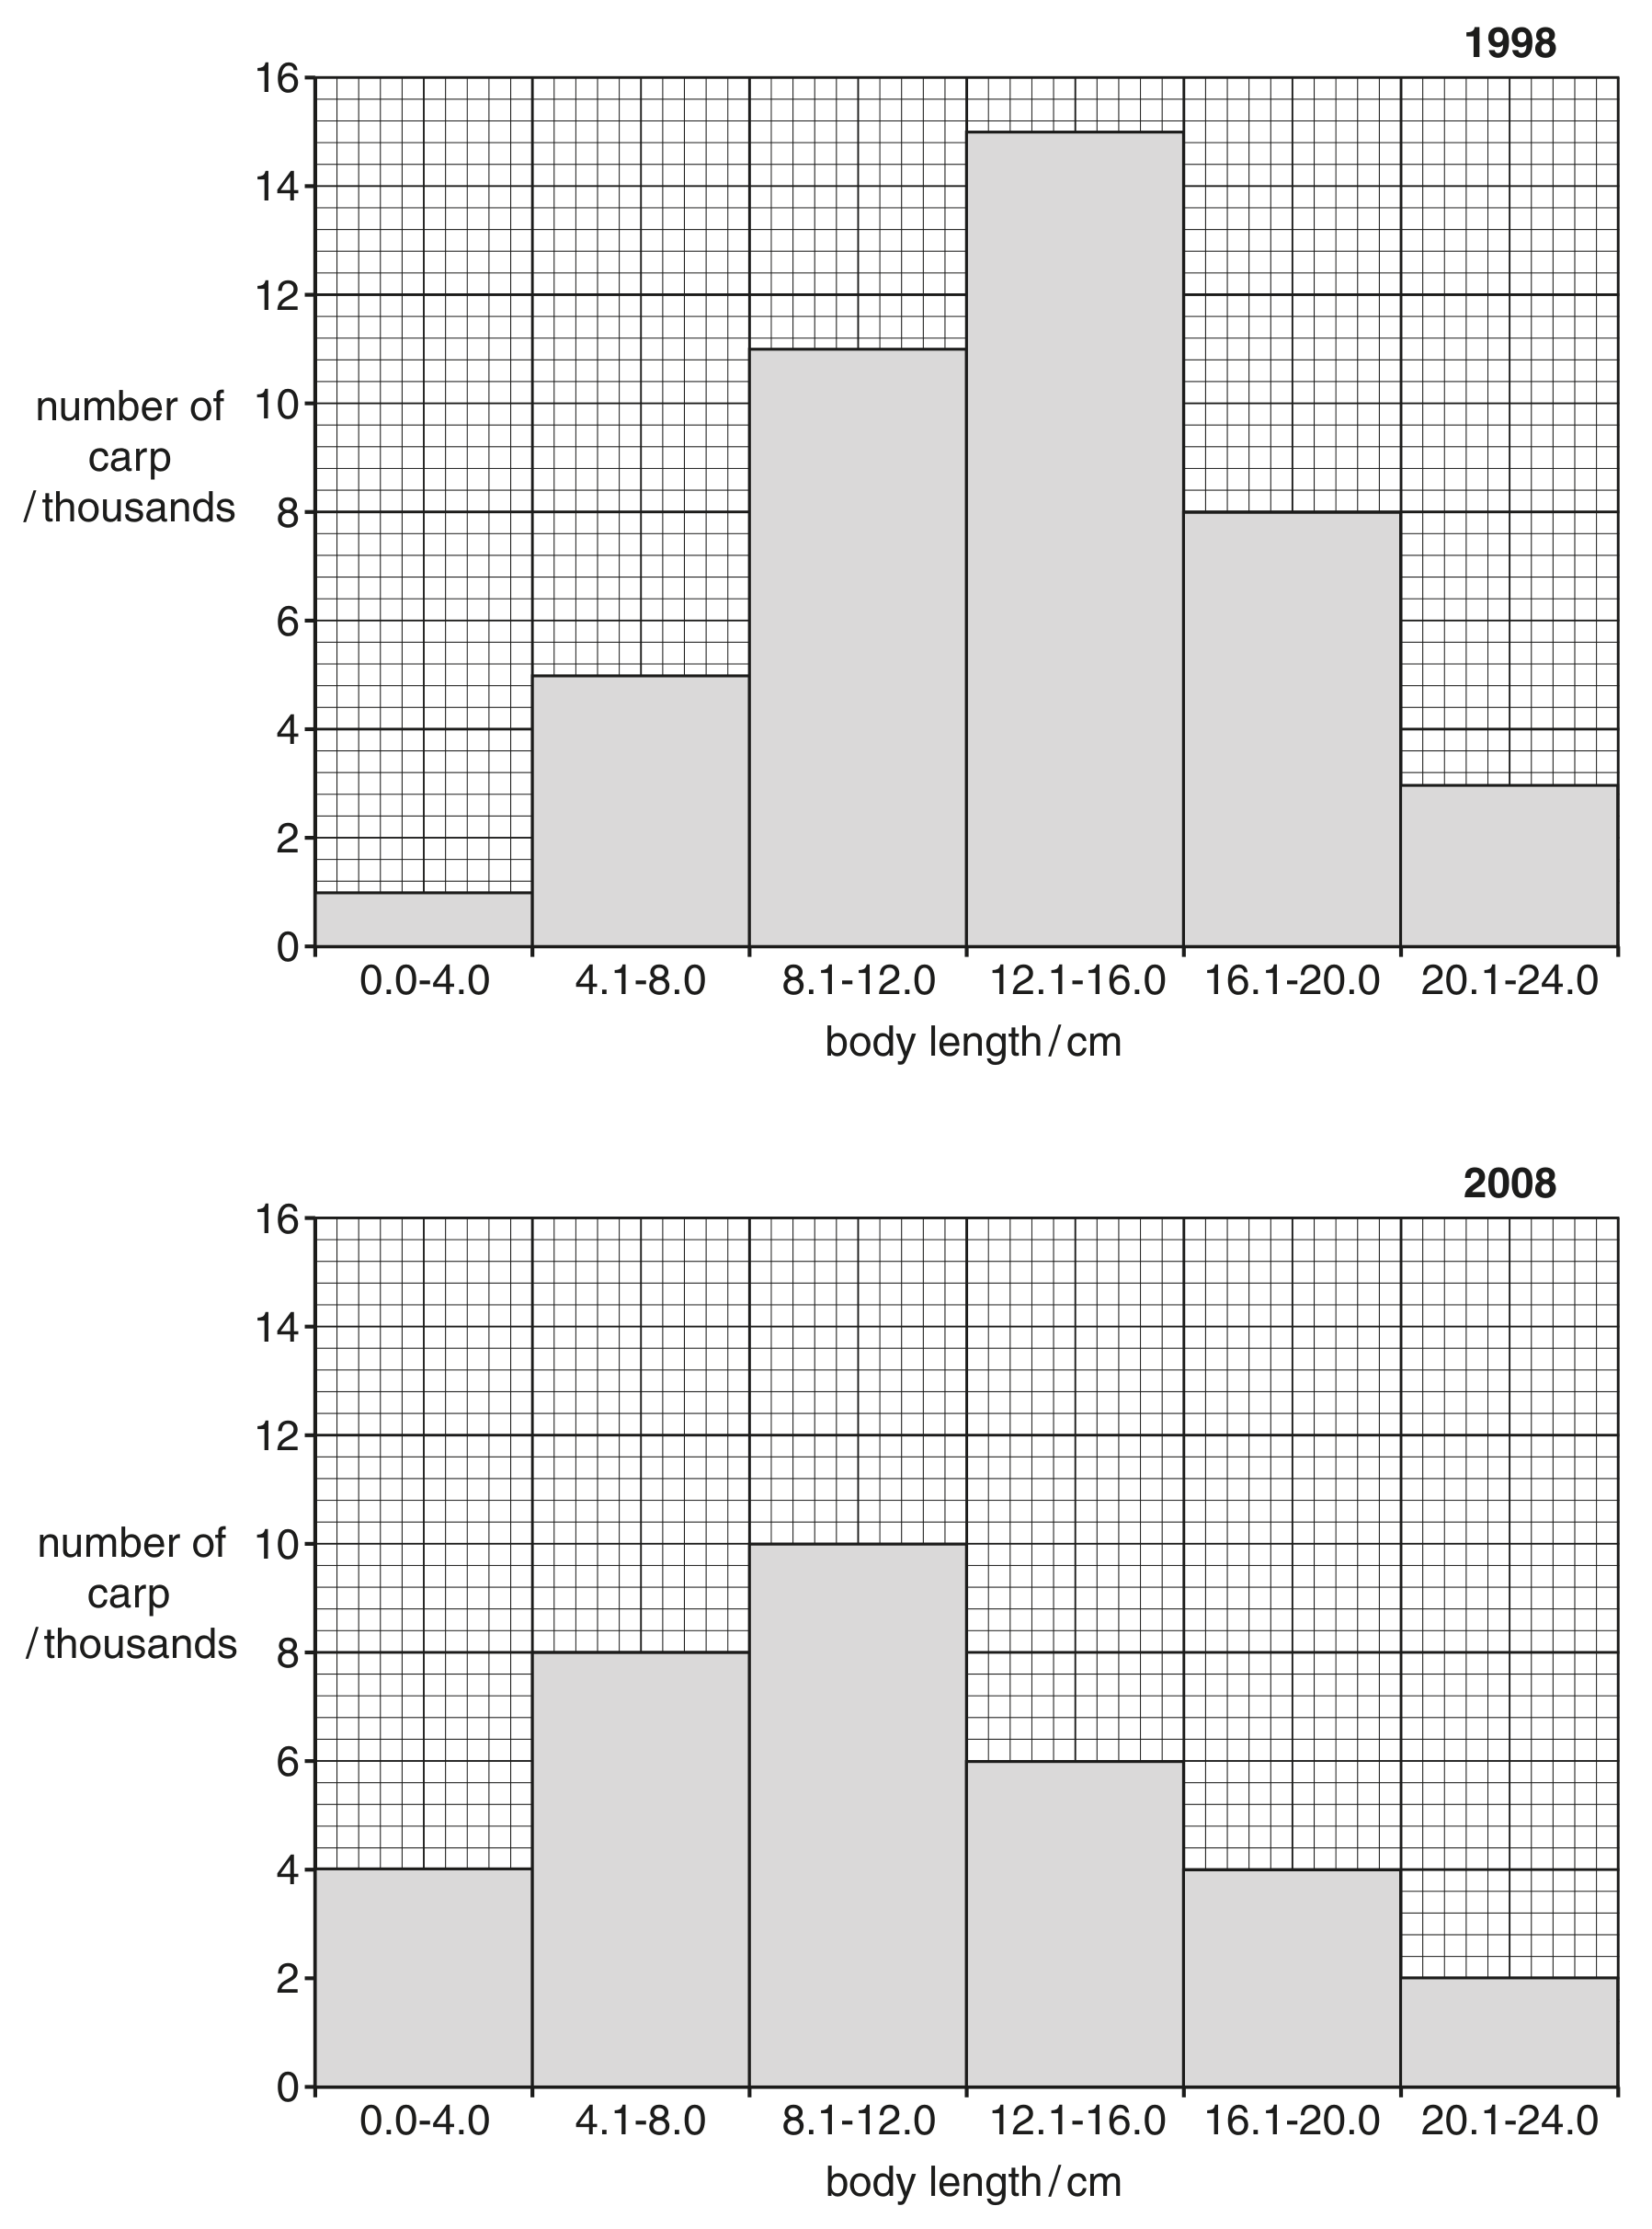
Fig. 2.1

Fig. 2.1

Question 2(a)

(a)

Define the term population.

[ 2 ]

Question 2(c)

(b)

The total population of carp in 1998 was 43000 fish.

[ 2 ]

Question 2(c)(i)

(i)

Calculate the total population of carp in 2008.

Show your working.

[ 2 ]
Question 2(a)

[Maximum number: 6]

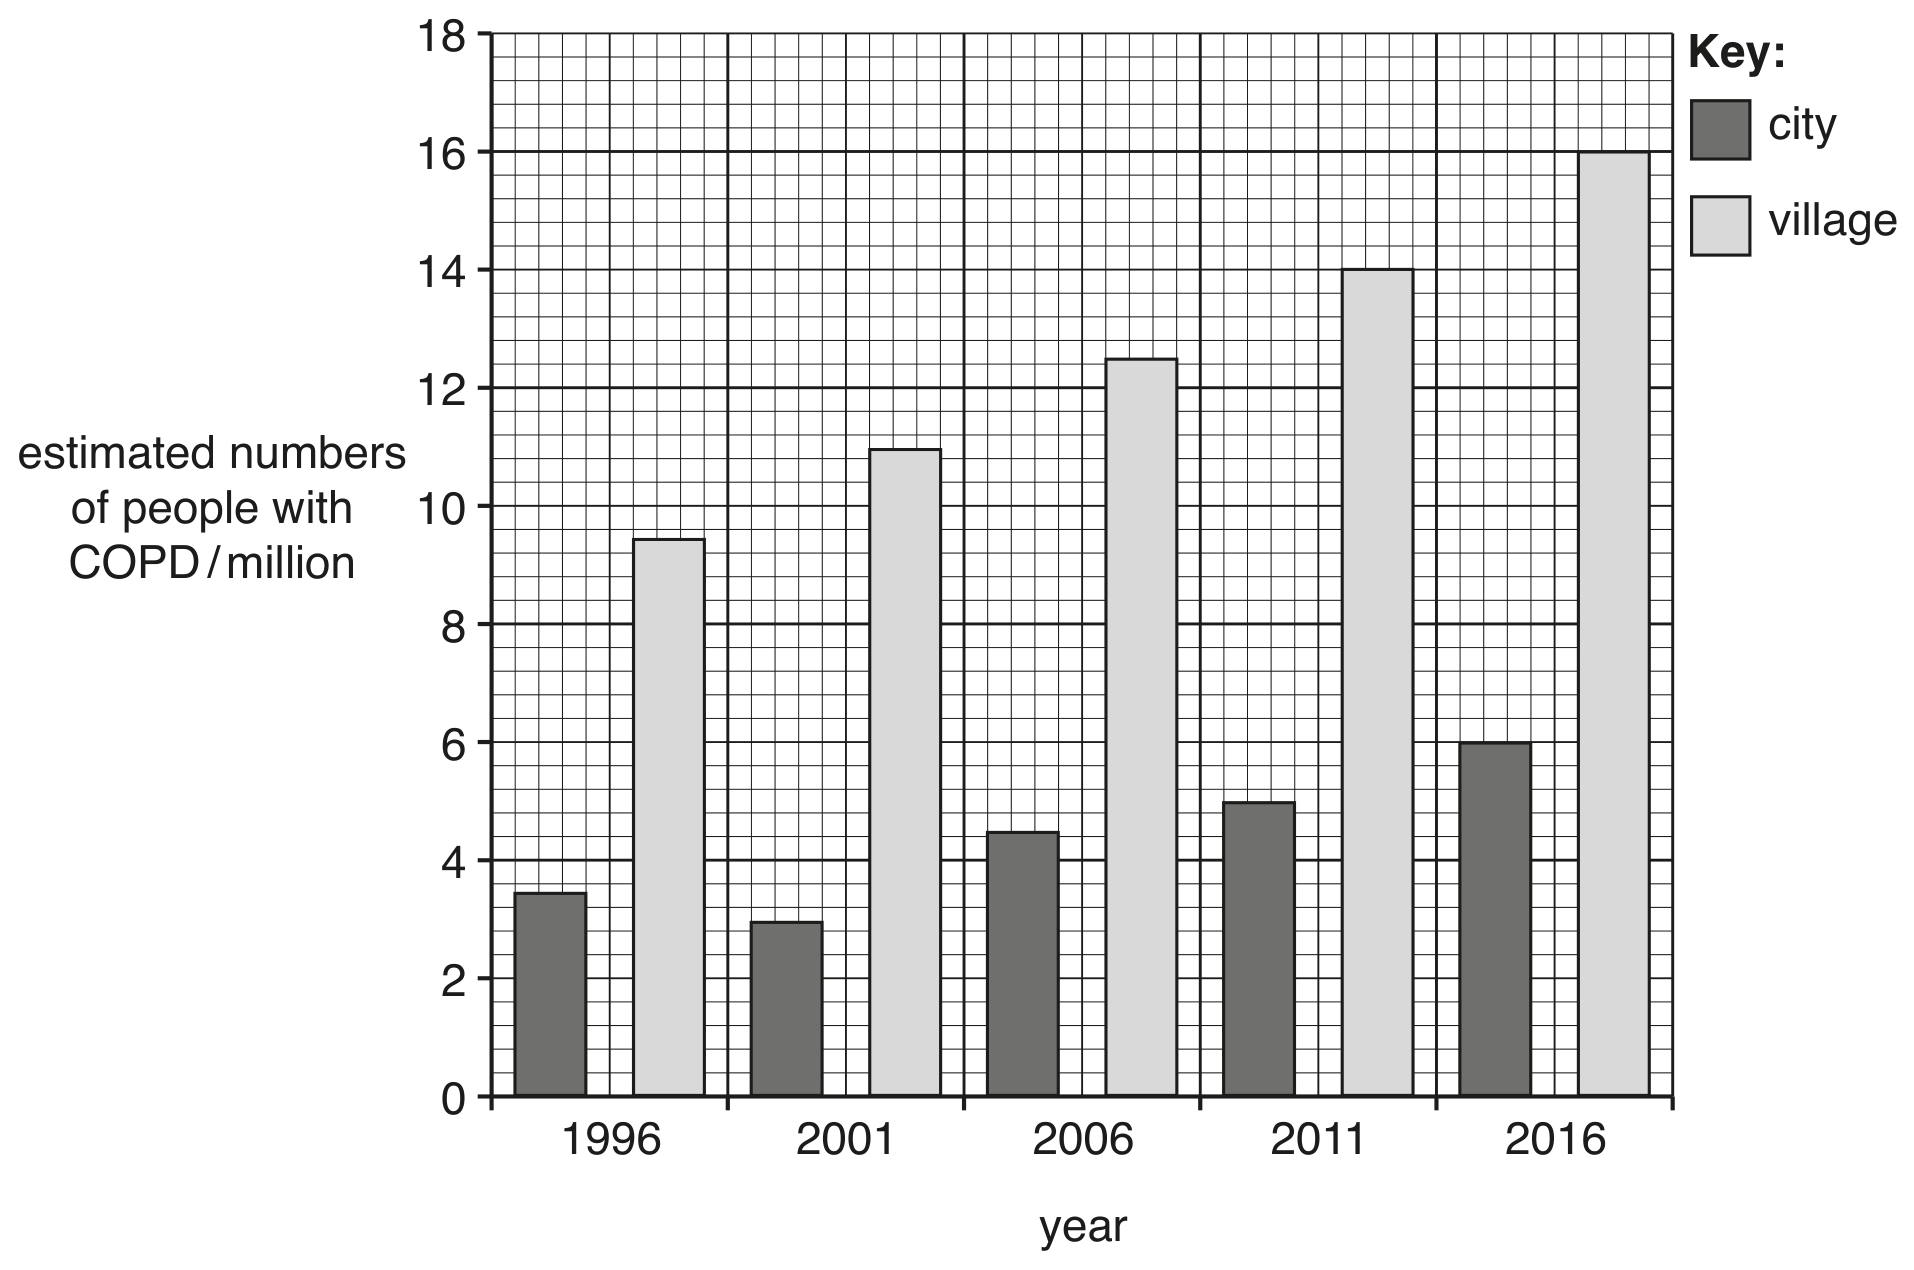
A study estimated the number of people with chronic obstructive pulmonary disease (COPD) in India. Data were collected from two groups of people, those who lived in cities and those who lived in villages.

Fig. 2.1 shows the results.

Fig. 2.1 shows the results.

Compare the number of people with COPD in cities with the number of people with COPD in villages and suggest reasons for the differences.

Use the data in Fig. 2.1 to support your answer.

Question 2

Question 2(a)

(a)

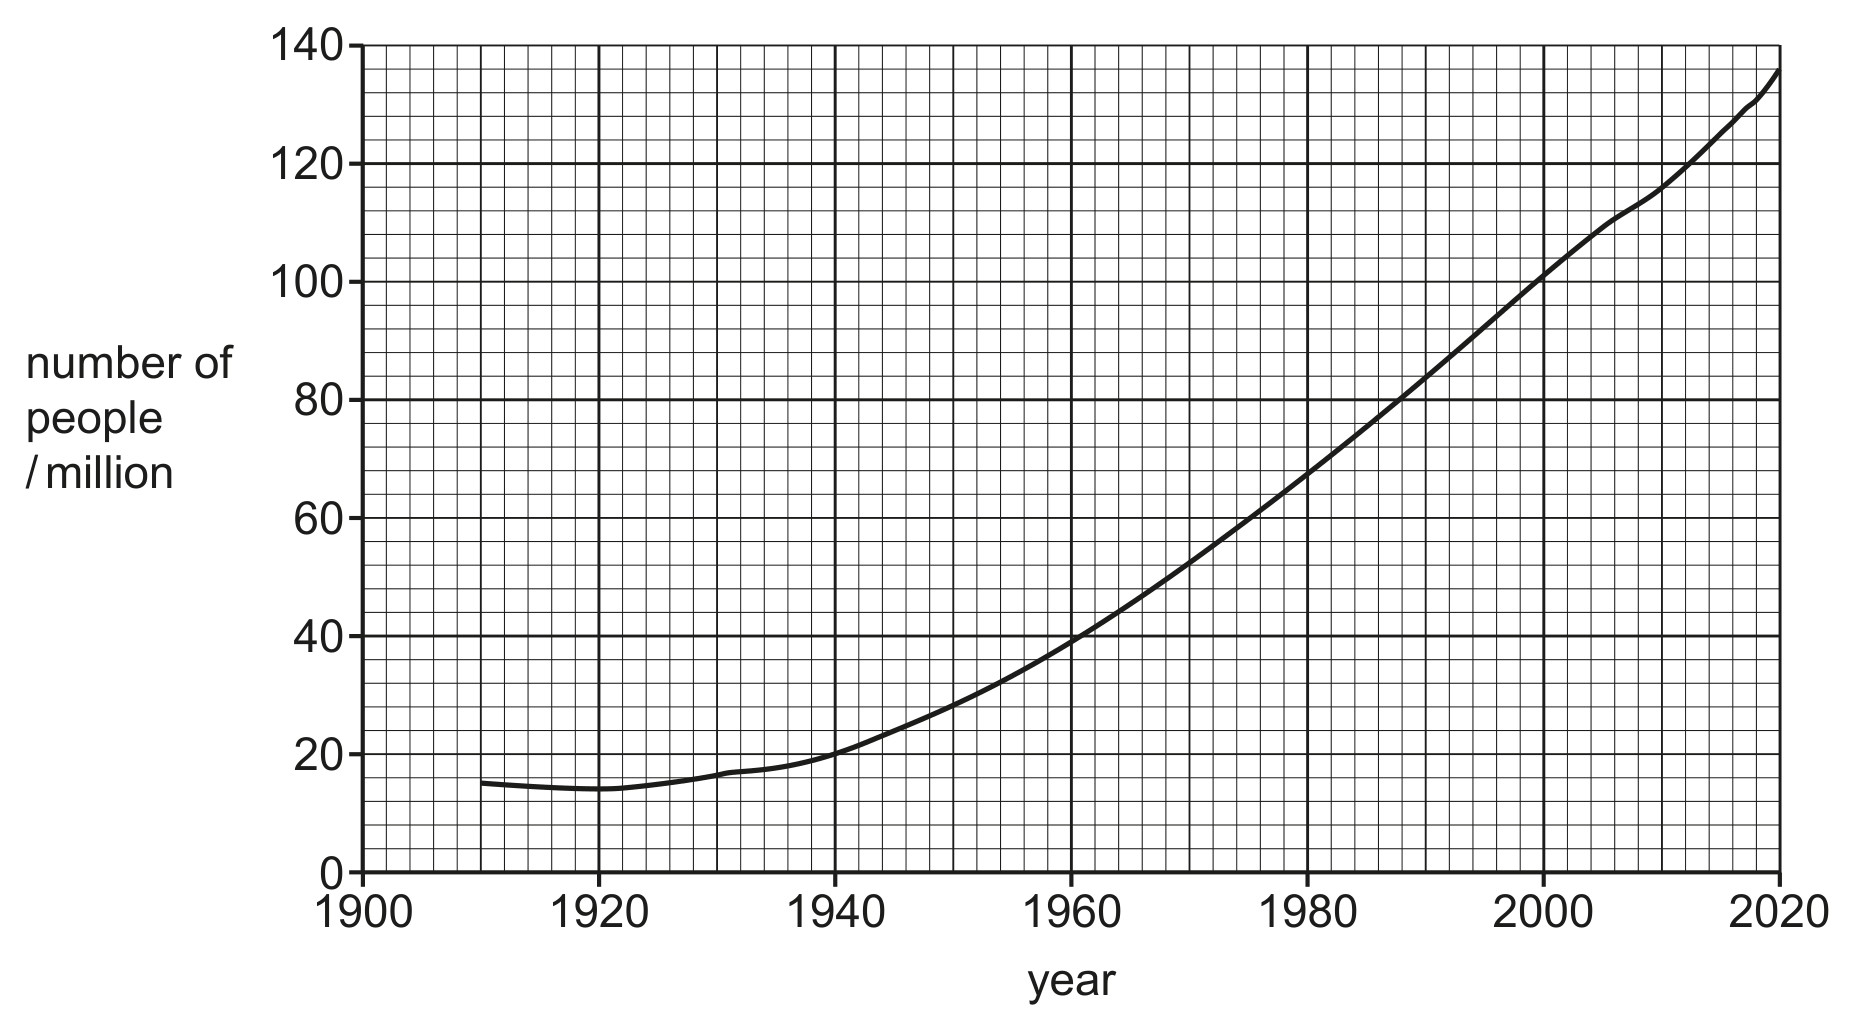
Fig. 2.1 shows the human population of a country between 1910 and 2020.

Fig. 2.1

Fig. 2.1

[ 6 ]

Question 2(a)(i)

(i)

Calculate the percentage increase in the population of the country between 1940 and 2020.
.

[ 3 ]

Question 2(a)(ii)

(ii)

Describe the factors that could cause the change in the population size between 1940 and 2020, shown in Fig. 2.1.

[ 3 ]

Question 3(a)

[Maximum number: 3]

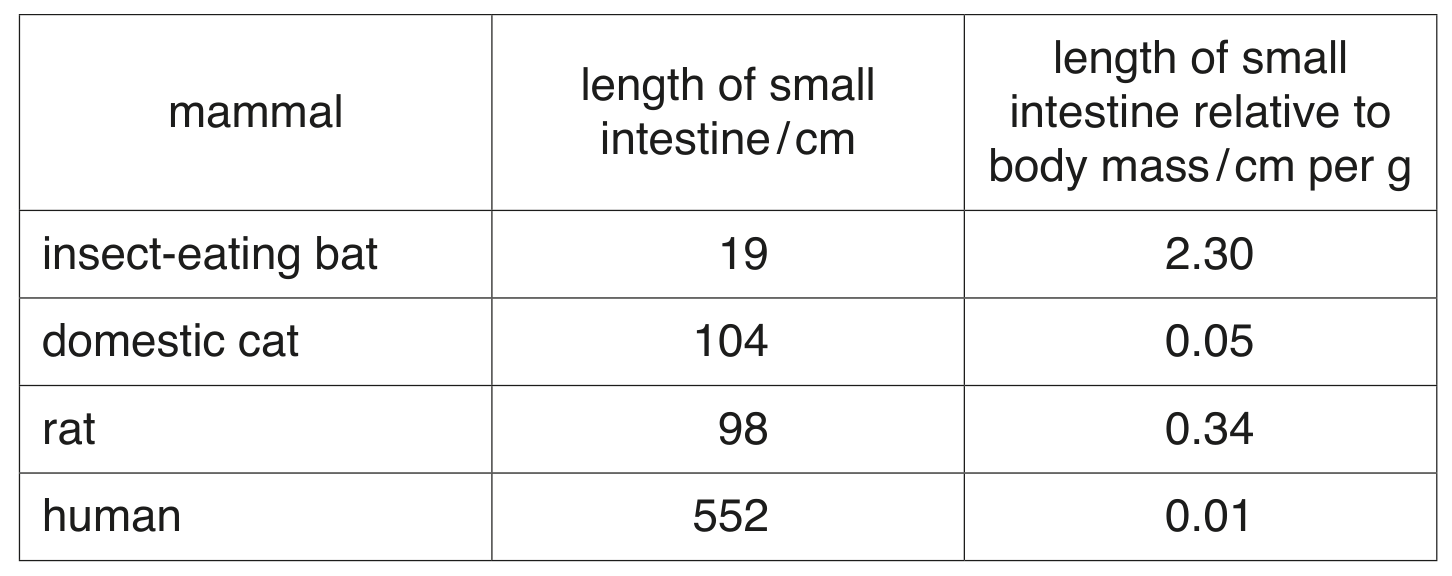
The length of the small intestine was measured in four types of mammal. The results are shown in Table 3.1.

Table 3.1

Table 3.1

Use the information in Table 3.1 to compare the length of the small intestine of the four mammals.

Question 3

[Maximum number: 6]

Bacteria are used in many biotechnological processes.

Question 3(c)

(a)

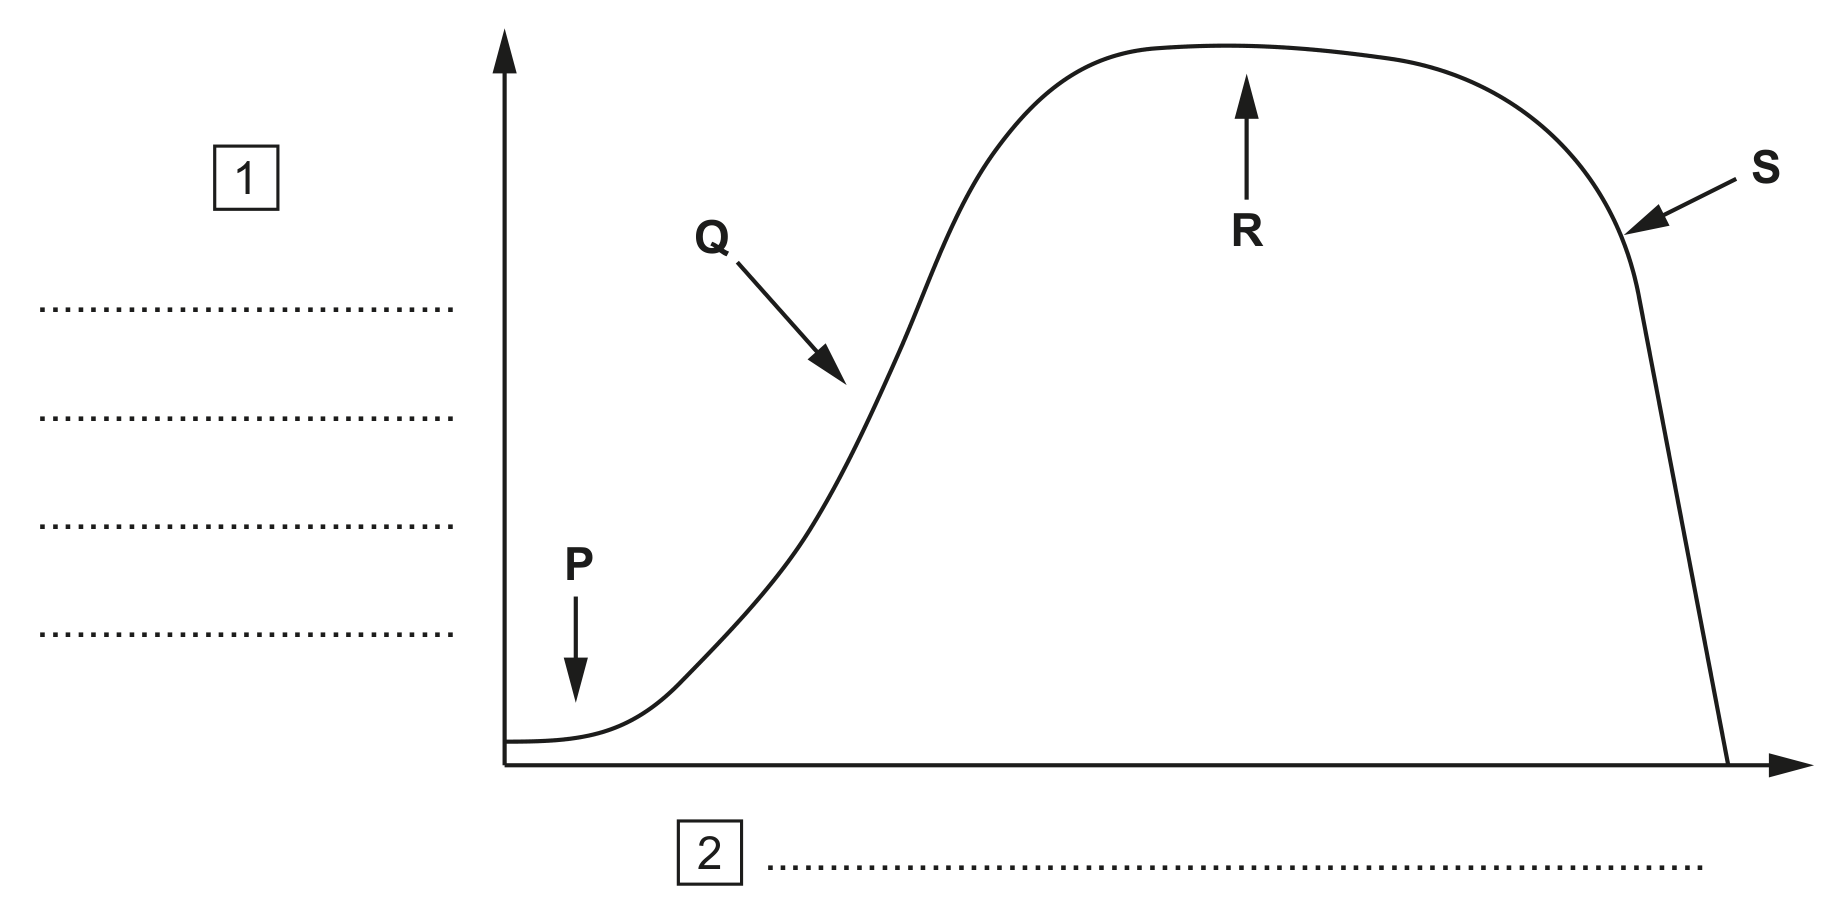
Genetically engineered bacteria that are used to make insulin were grown in a fermenter for five days.

Samples were taken from the fermenter every six hours and the number of bacteria in 1.0 mm31.0 \mathrm{~mm}^{3} of the nutrient solution were counted.

Changes in the numbers of living bacteria in the samples taken from the fermenter are shown in Fig. 3.1.

Fig. 3.1

Fig. 3.1

[ 6 ]

Question 3(c)(i)

(i)

Complete Fig. 3.1 by adding labels for the axes at 1 and 2 .

[ 1 ]

Question 3(c)(ii)

(ii)

State the names of the stages of population growth of the bacteria labelled P to S.

P
Q
R
S

[ 2 ]

Question 3(c)(iii)

(iii)

Explain, with reference to Fig. 3.1, why the bacteria did not grow in the fermenter for longer than five days.

[ 3 ]

Question 3

[Maximum number: 3]

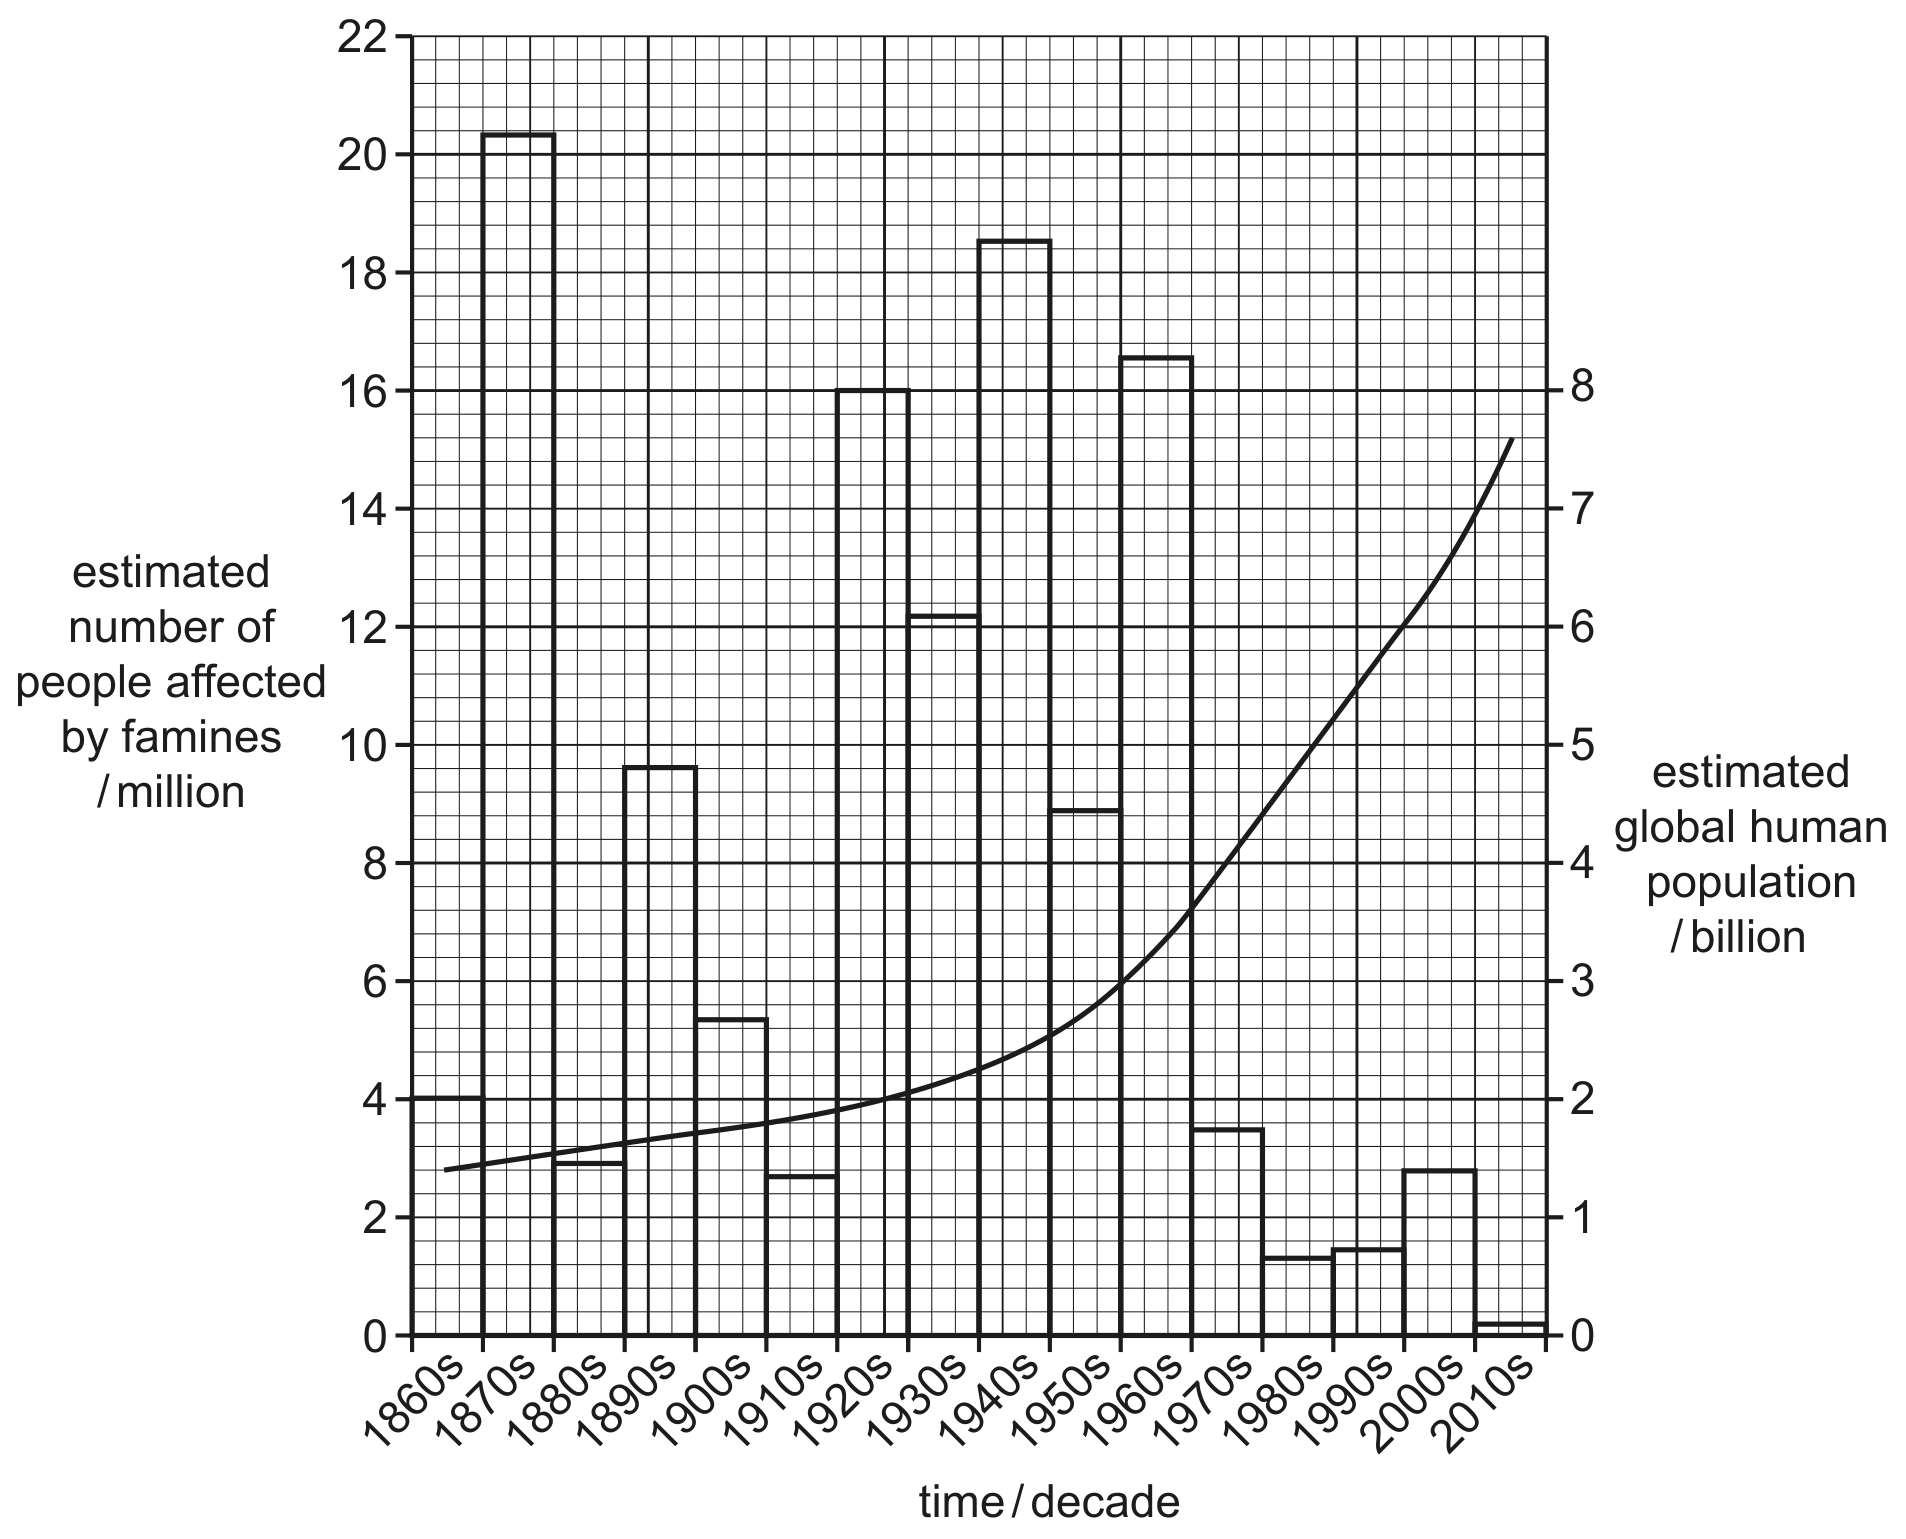
Fig. 3.1 shows the estimated growth of the global human population between the 1860s and 2010s.

It also shows the estimated number of people that were affected by famines between these dates.

Fig. 3.1

Fig. 3.1

1 billion = 1000000000

Key: estimated number of people affected by famines estimated global human population

Question 3(a)(i)

(a)

State the final size of the estimated global human population shown in the 2010s in Fig. 3.1.

[ 1 ]

Question 3(a)(ii)

(b)

Using the information in Fig. 3.1, calculate the percentage of the estimated global human population that was affected by famine during the 1860s.

Give your answer to one significant figure.

[ 2 ]

Question 3

[Maximum number: 6]

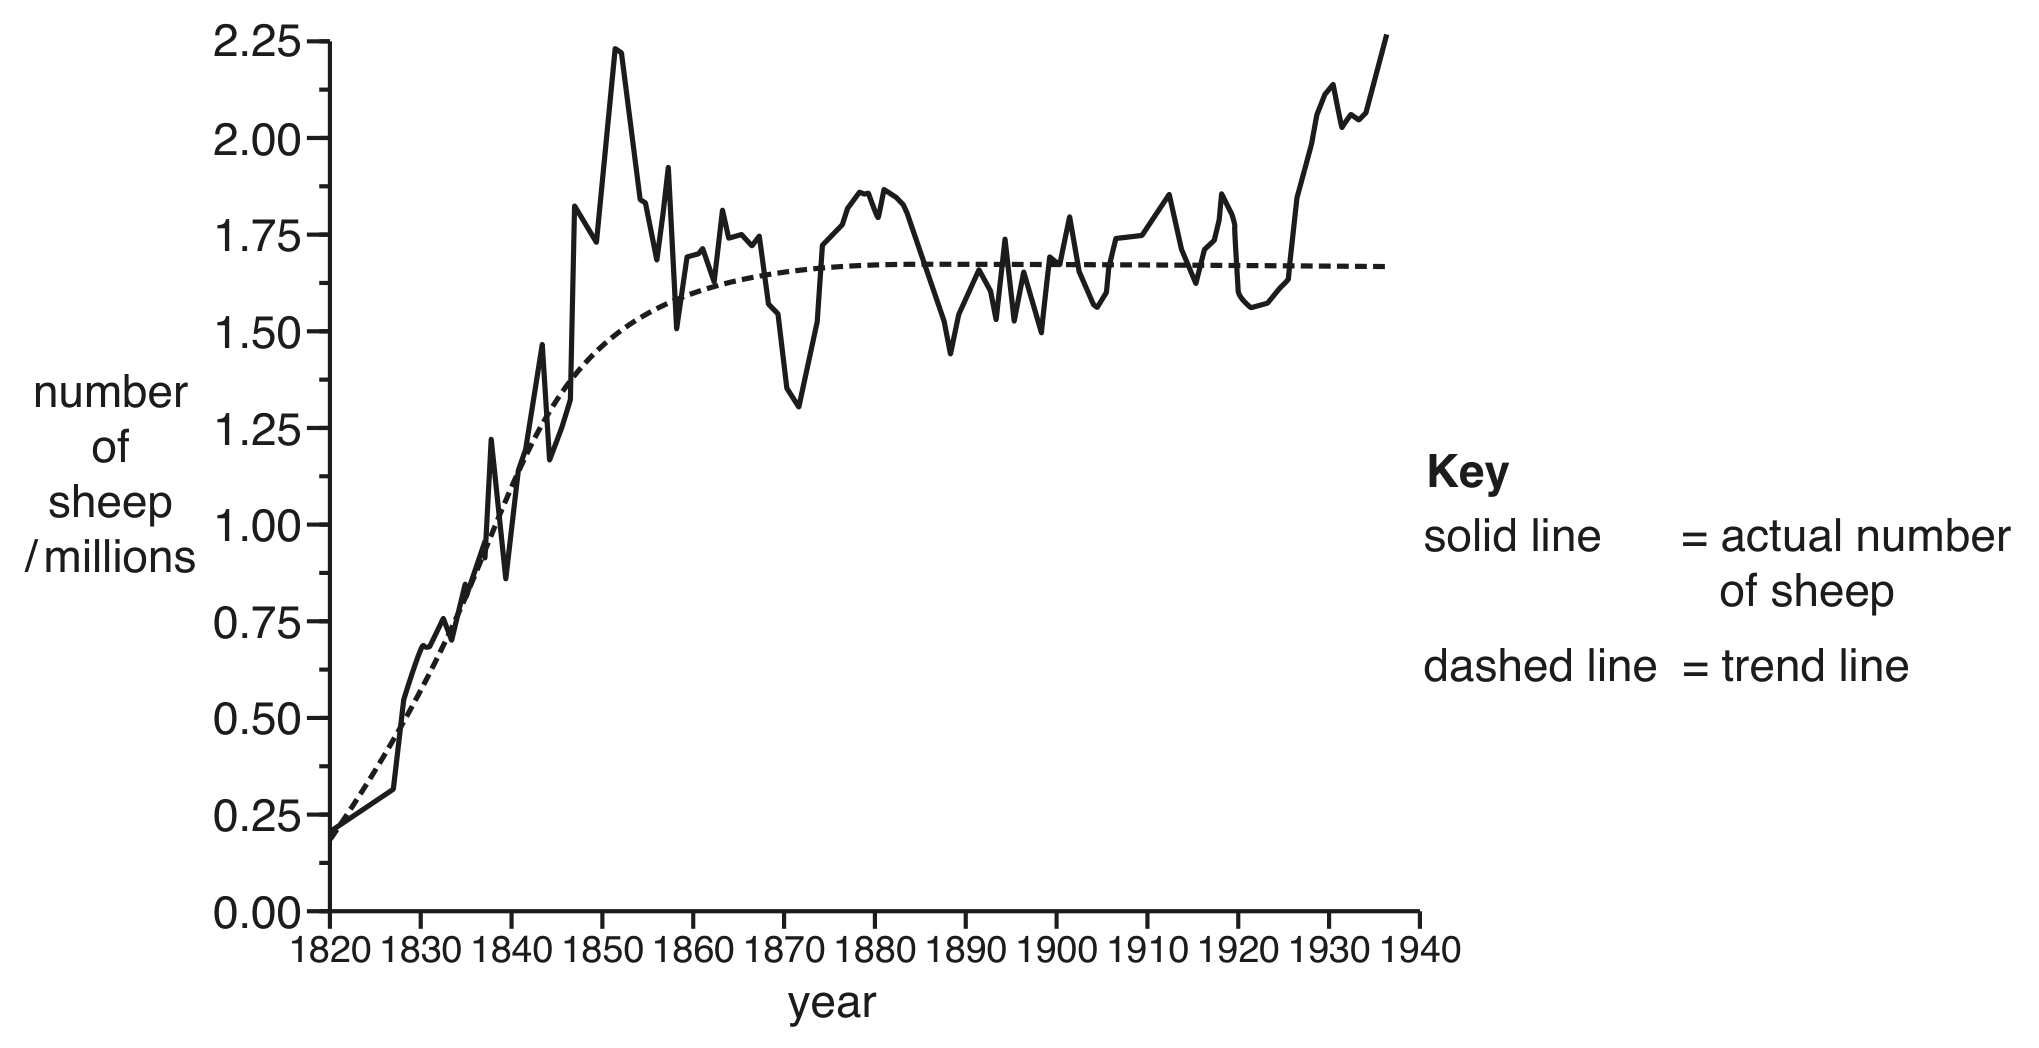
Tasmania is an island off the south coast of Australia. Sheep were introduced to Tasmania in the nineteenth century.

Fig. 3.1 shows the population of sheep in Tasmania from 1820 to 1940. The dashed line shows the trend in the population growth.

Fig. 3.1 shows the population of sheep in Tasmania from 1820 to 1940. The dashed line shows the trend in the population growth.

Question 3(a)

(a)

Describe the trend in the population of sheep in Tasmania between 1820 and 1940, using the information in Fig. 3.1.

[ 3 ]

Question 3(b)

(b)

Explain the change in the trend of the population that you described in 3(a).

[ 3 ]

Question 3(c)

[Maximum number: 2]

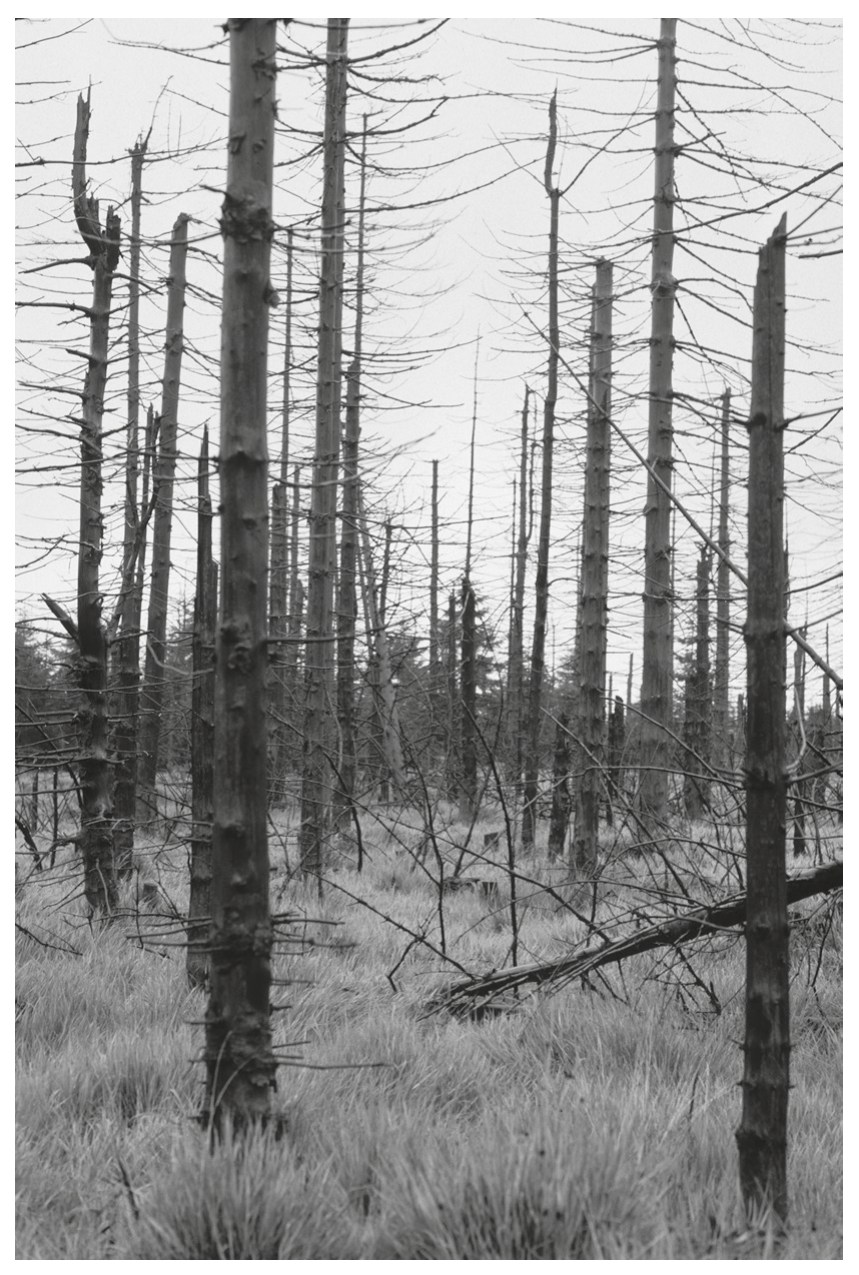
Acid rain has destroyed many forests including the forest shown in Fig. 3.1.

Fig. 3.1

Fig. 3.1

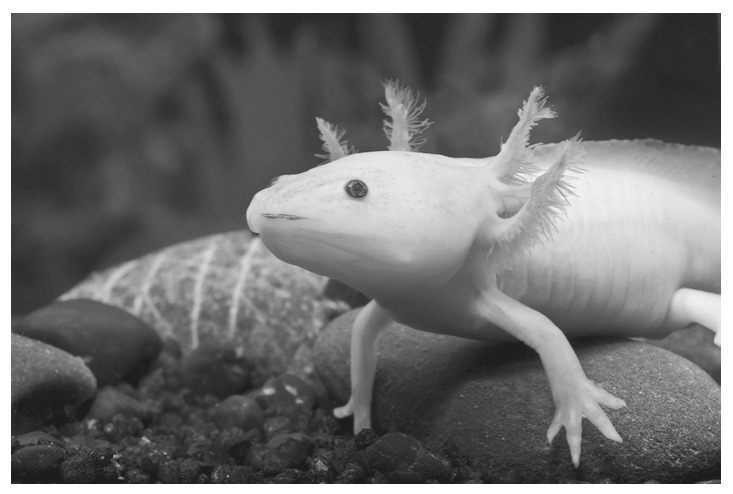
Acid rain can also damage aquatic organisms such as the amphibian shown in Fig. 3.2.

Fig. 3.2

Fig. 3.2

Suggest why amphibians are vulnerable to pollutants such as acid rain.

Question 4

[Maximum number: 3]

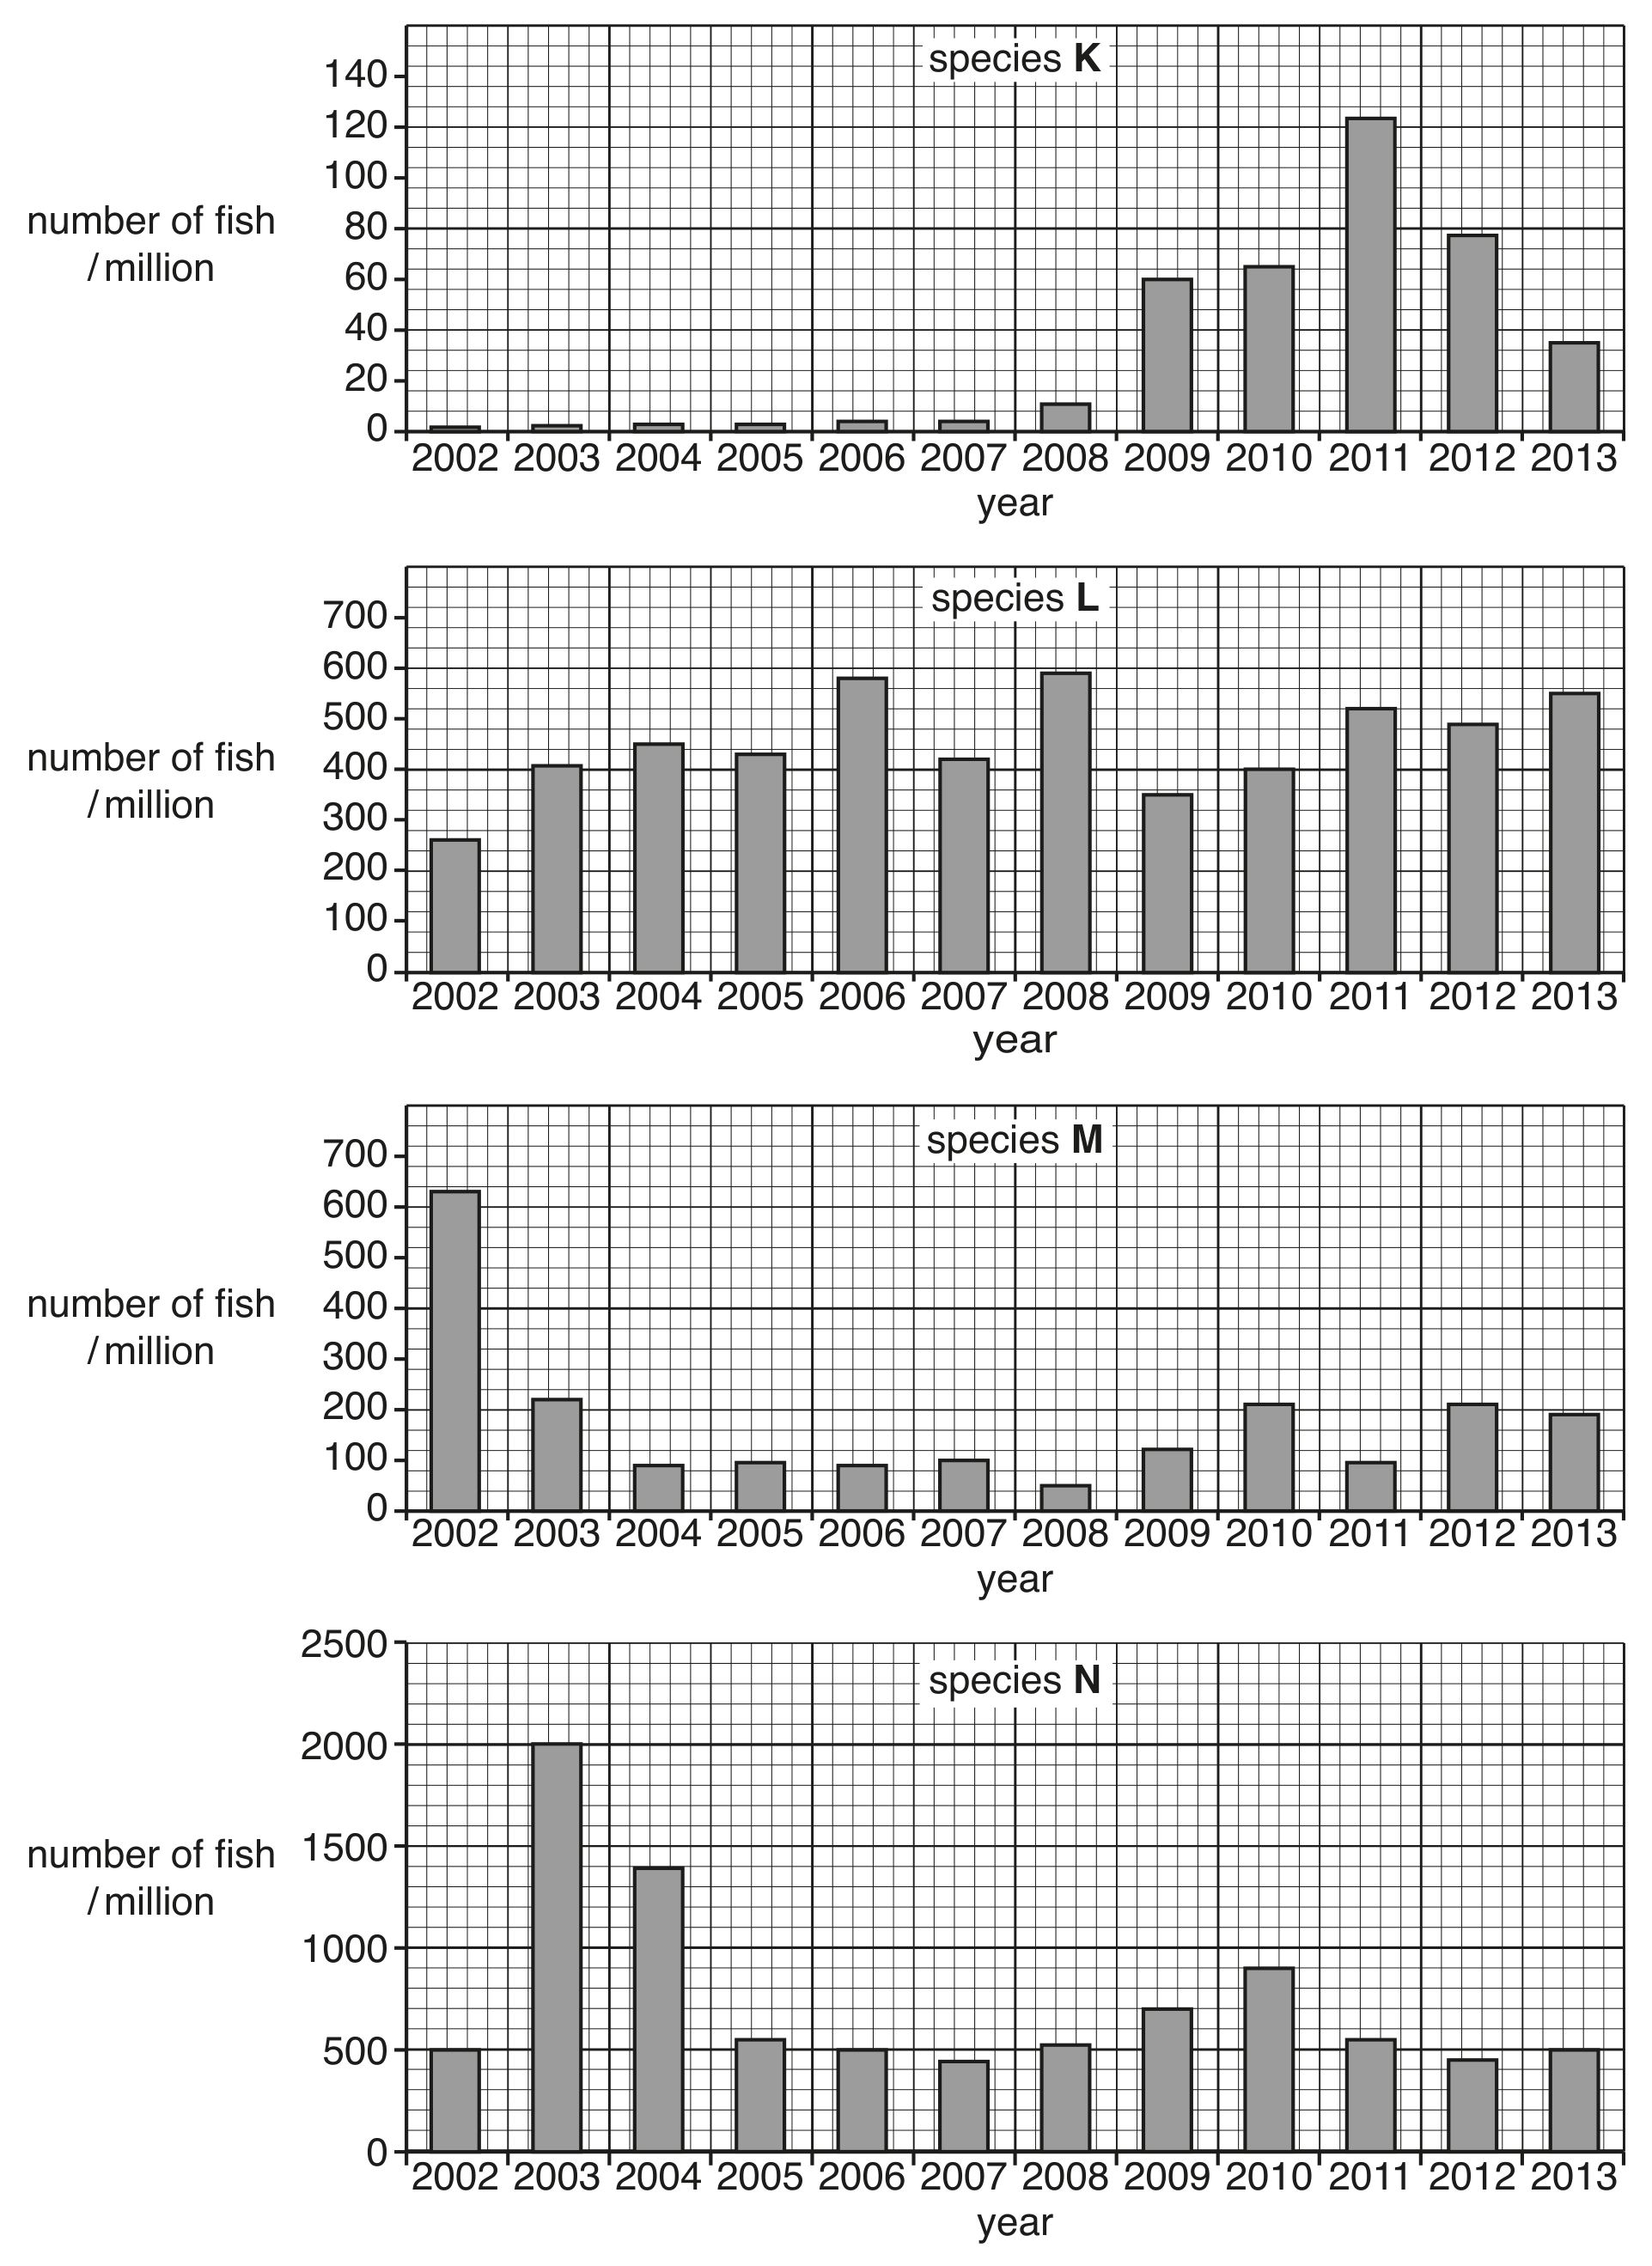
The Canadian Government were concerned about overfishing at the Grand Banks in the Atlantic Ocean.

As a result, commercial fish stocks were monitored from 2002 until 2013.
The population data for four species of fish are shown in Fig. 4.1.

Fig. 4.1

Fig. 4.1

Question 4(a)

(a)

Use the information in Fig. 4.1 to:

[ 1 ]

Question 4(a)(i)

(i)

state the most abundant fish species in 2002

[ 1 ]

Question 4(b)

(b)

Overfishing is a possible reason for the decrease of the population of species M between 2002 and 2003.

State two other reasons that could have caused this decrease.

1

2

[ 2 ]

Question 5

[Maximum number: 6]

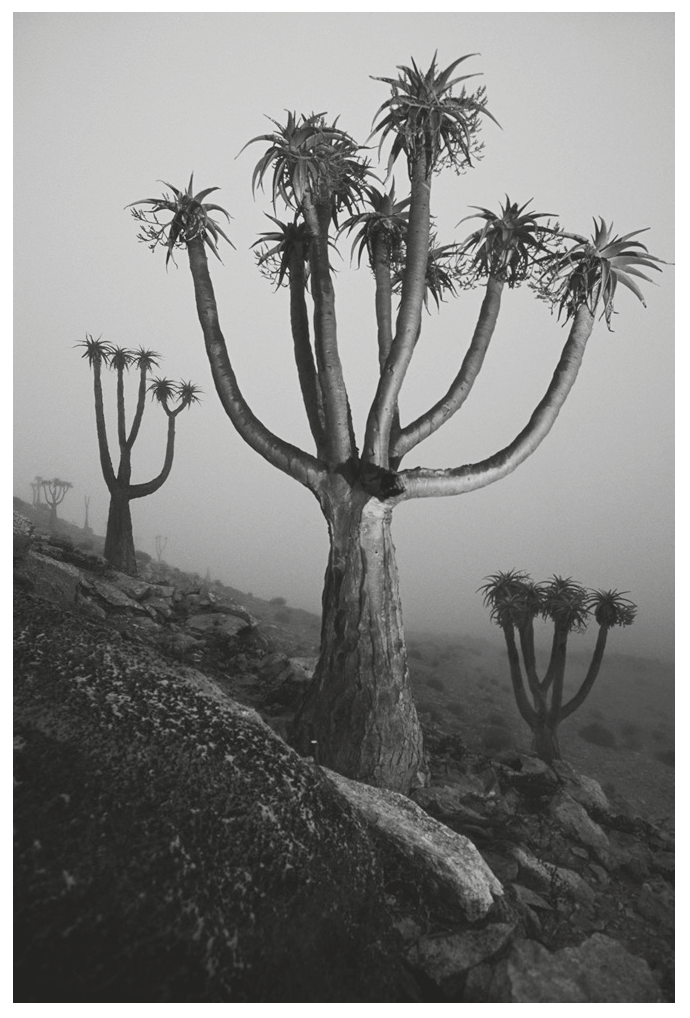
The giant quiver tree, Aloe pillansii, shown in Fig. 5.1, is an endangered species.
These long-lived trees grow in harsh environments. Some populations of A. pillansii are found within the Richtersveld National Park, but one population is found just outside on a mountain called Cornell's Kop in southern Africa.

Fig. 5.1

Fig. 5.1

Question 5(a)(ii)

(a)

Explain why the A. pillansii trees on Cornell's Kop represent a population.

[ 3 ]

Question 5(d)

(b)

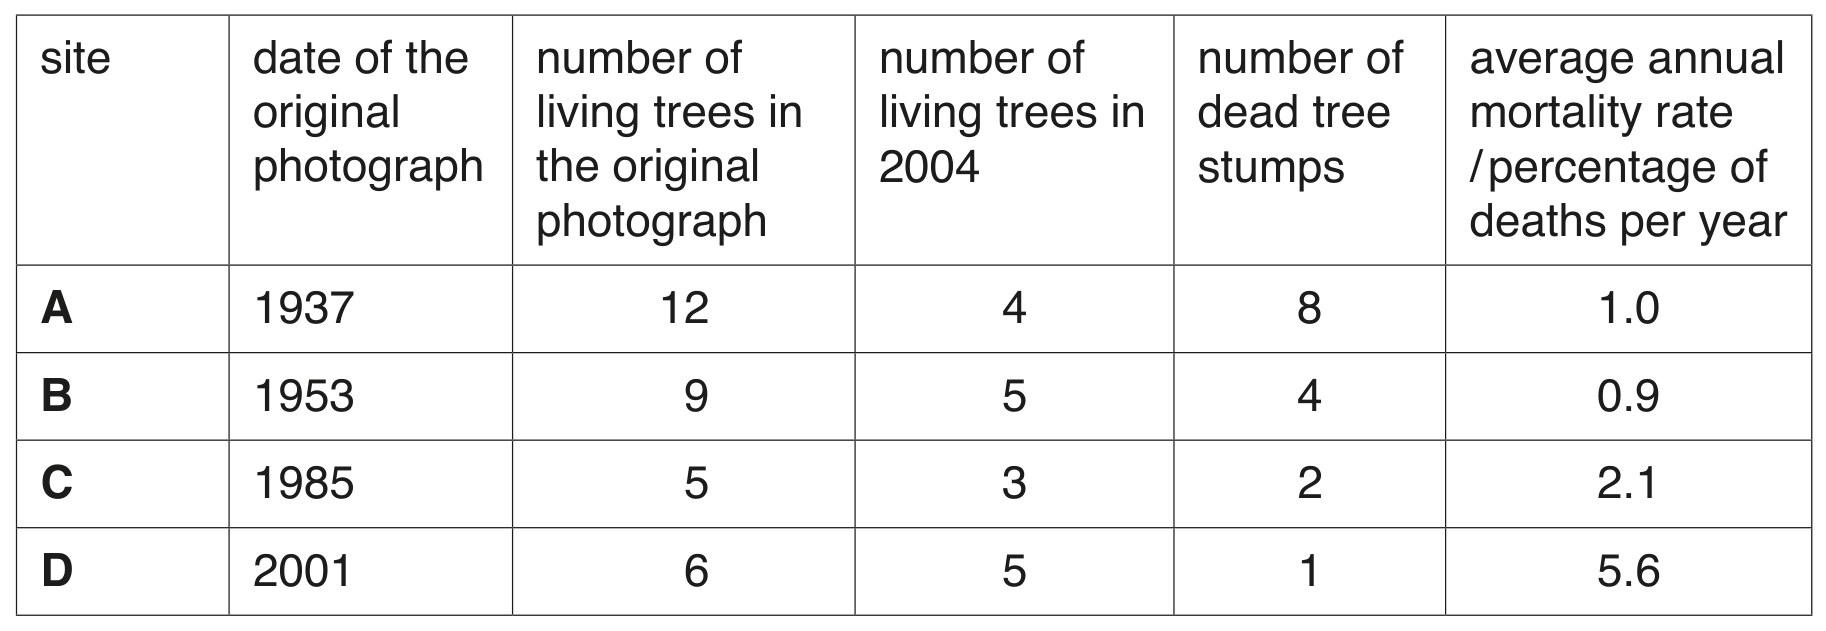
The population of A. pillansii trees on Cornell's Kop was surveyed and photographed at four sites, A to D, from 1937 onwards. Researchers took photographs at all four sites in 2004 and compared them with the original photographs.

The results are shown in Table 5.1.

Table 5.1

Table 5.1

[ 3 ]

Question 5(d)(ii)

(i)

Describe what the analysis of the photographs shows about the population of A. pillansii on Cornell's Kop.

[ 3 ]
0 selected