Question 1(d)
[Maximum number: 3]
Fig. 1.1 is a diagram of part of a cross-section of a leaf.
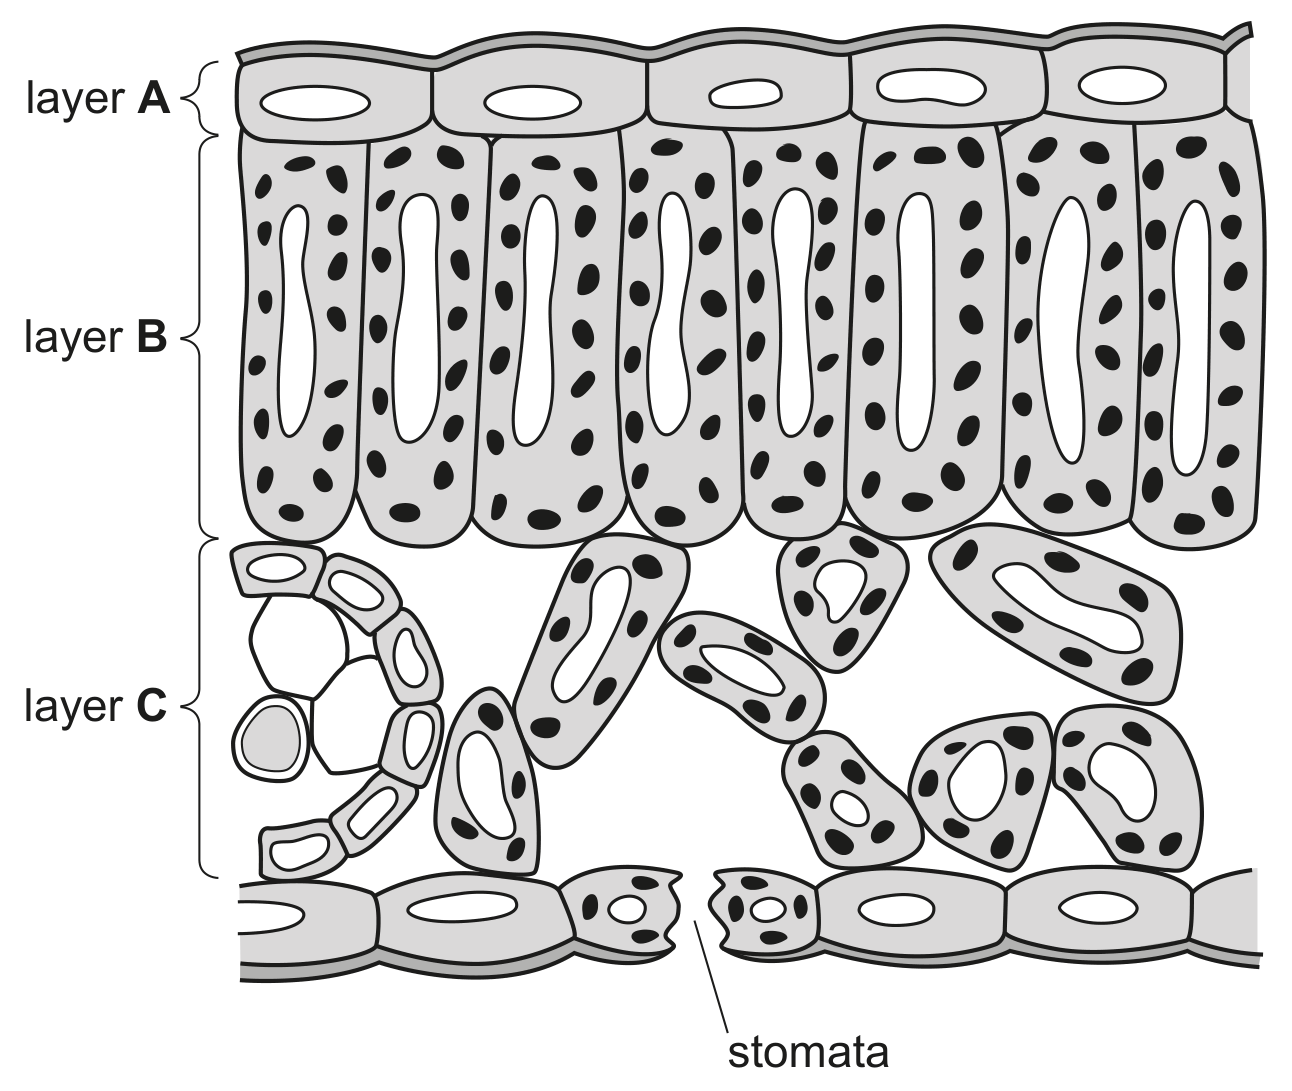
Fig. 1.1
The student increased the humidity in the room and repeated the investigation.
Predict and explain the effect of high humidity on the stomata.
 EduNinja
CAIE IGCSE Biology Extended 8.3 Transpiration question practice helps you revise this syllabus point with the course map in view. Use this page to focus on one topic, check the style of questions available, and connect each attempt back to the knowledge area it is testing.
EduNinja keeps Biology practice aligned to CAIE at Extended level, so you can move from topic review into exam-style question bank work without losing the syllabus structure. Start with a small set, mark the weak steps, then return to nearby topic links when a definition, graph, calculation, or explanation needs repair.
Fig. 1.1 is a diagram of part of a cross-section of a leaf.
Fig. 1.1
The student increased the humidity in the room and repeated the investigation.
Predict and explain the effect of high humidity on the stomata.
Transpiration is the loss of water vapour from the leaves of a plant.
Complete the sentence describing transpiration.
Water evaporates from the surfaces of the cells into the air spaces and then out of the leaves, through the stomata, as water vapour.
Explain how water moves upwards in the xylem.
A student investigated the effect of wind speed on the rate of transpiration in a small Pachira aquatica tree.
They measured the rate of transpiration when the plant was placed in different wind speeds in both the light and the dark. The tree was given an adequate supply of water.
The results of this investigation are shown in Fig. 2.1.
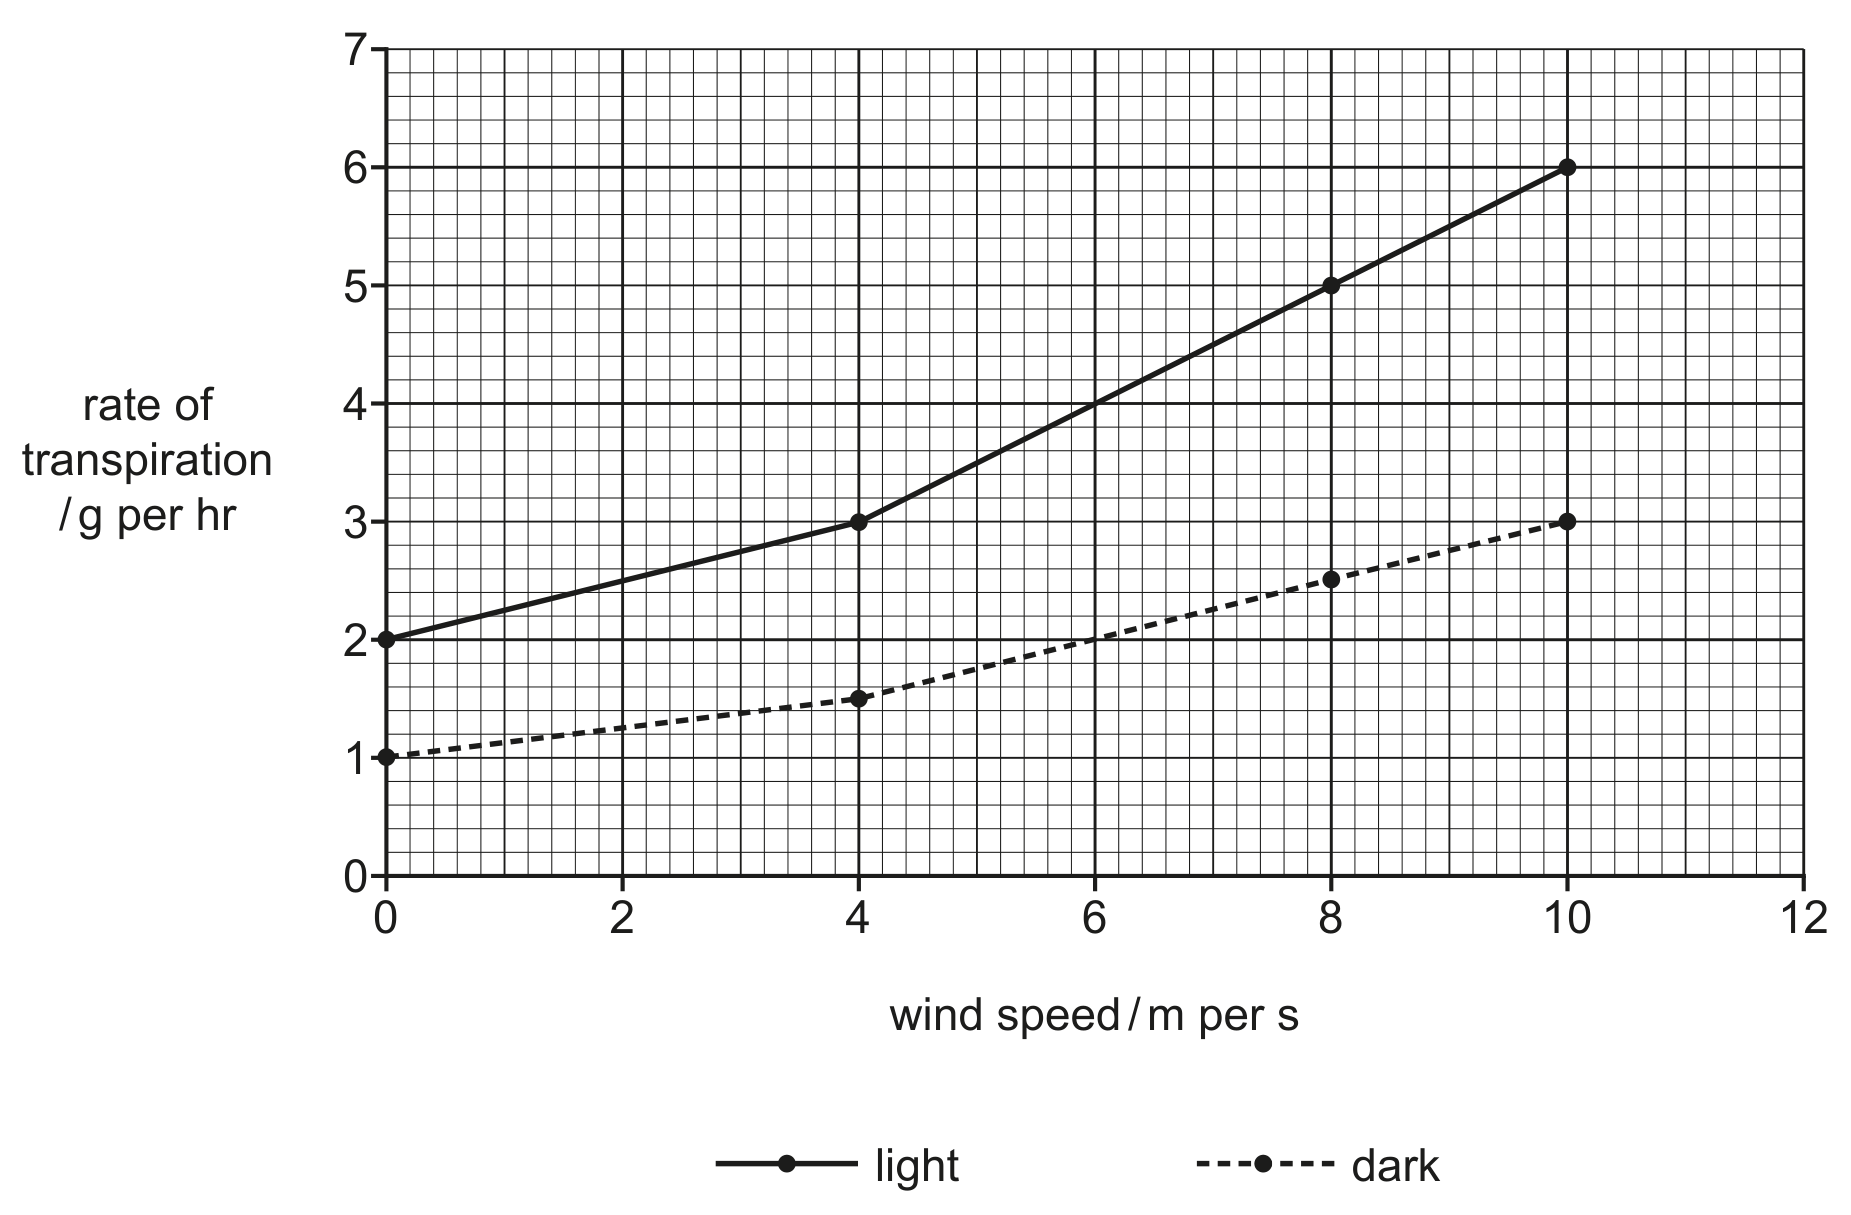
Fig. 2.1
Describe and explain the results shown in Fig. 2.1.
The investigation was repeated in the light with the same species of tree in an environment where the humidity was higher.
Draw a line on Fig. 2.1 to predict the results in the light with increased humidity.
The investigation described in 2(c) was repeated (different wind speeds in both the light and the dark).
However, the tree was not given an adequate supply of water during the investigation.
Predict the result and explain your prediction.
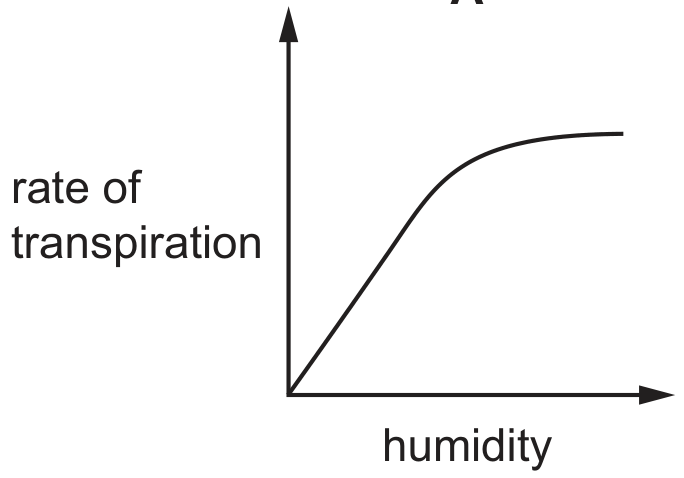
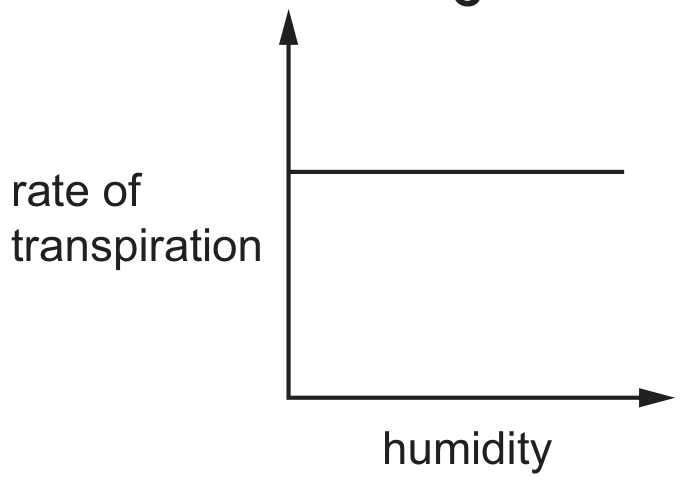
Which graph shows most clearly what will happen to the rate of transpiration as humidity increases?
A
transpiration
C
transpiration
On a dry, sunny day, how does water vapour move through the stomata of a leaf?
into the leaf by diffusion
into the leaf by respiration
out of the leaf by diffusion
out of the leaf by respiration
The graph shows daily carbon dioxide uptake and transpiration by the plant Agave americana.
The plant is adapted to live in very dry conditions.
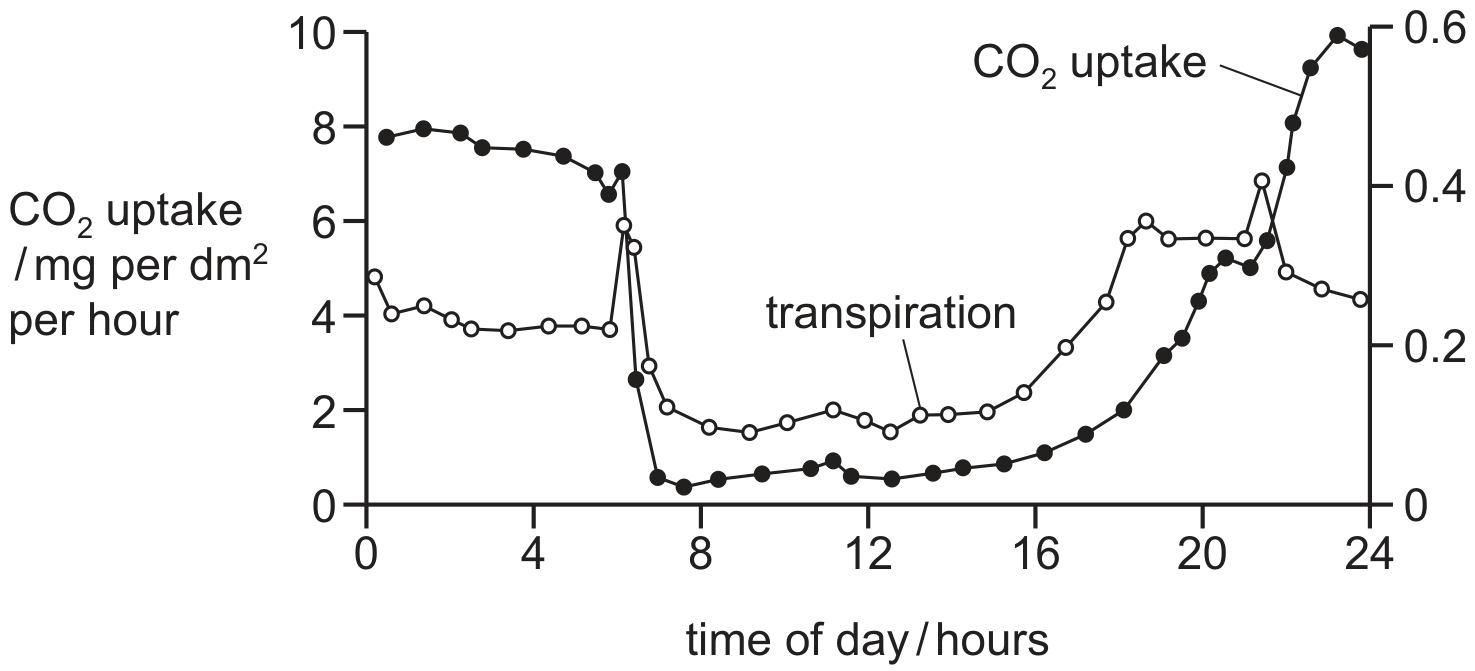
transpiration / per per hour
What can be concluded from this graph?
More stomata are closed during dark periods.
More stomata are closed during light periods.
There is no carbon dioxide uptake during dark periods.
There is no water uptake during light periods.
The graph shows daily carbon dioxide uptake and transpiration by the plant Agave americana.
The plant is adapted to live in very dry conditions.
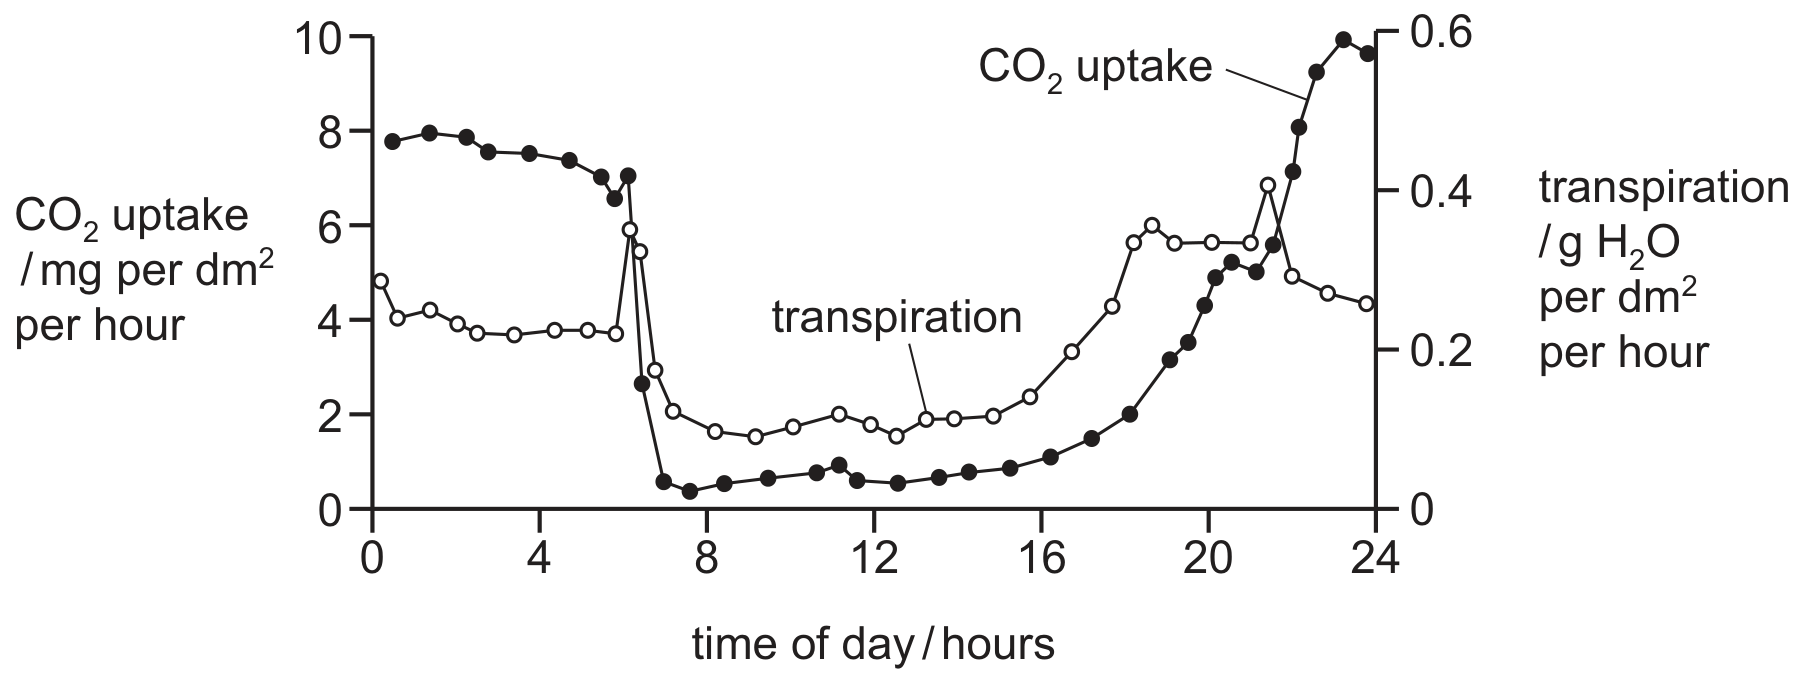
What can be concluded from this graph?
More stomata are closed during dark periods.
More stomata are closed during light periods.
There is no carbon dioxide uptake during dark periods.
There is no water uptake during light periods.
Fig. 3.1 is a scanning electron micrograph of a vertical section through part of the leaf of a broad bean plant, Vicia faba.
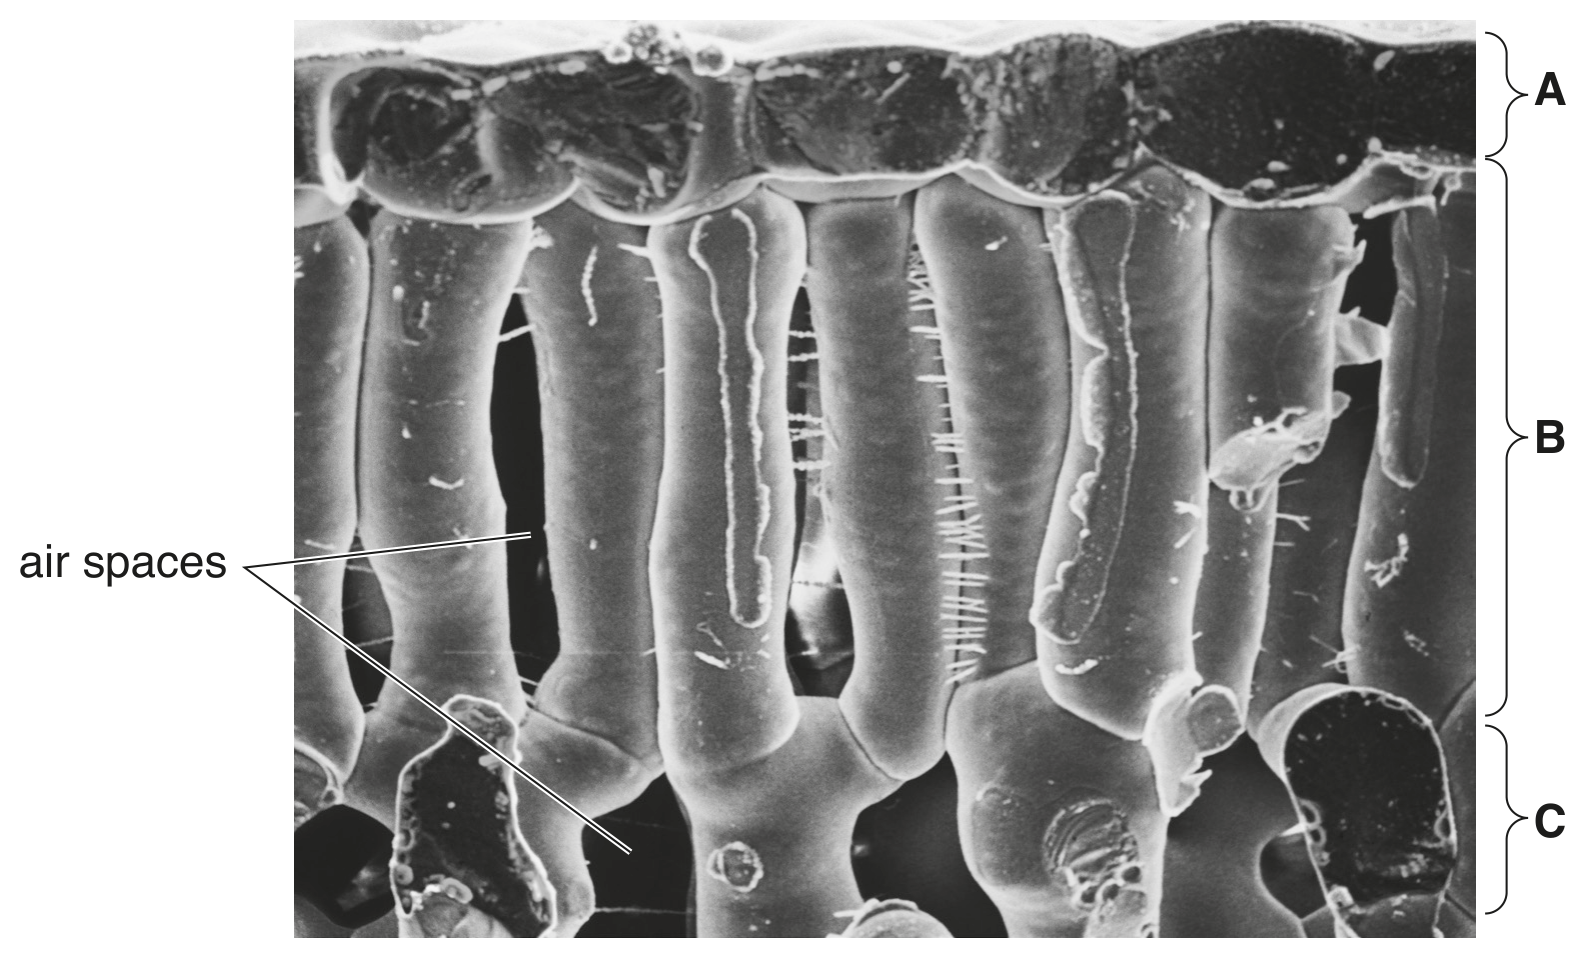
Fig. 3.1
Explain why there are many interconnecting air spaces within the leaf.
When water is in short supply, plants can wilt as shown in Fig. 3.2.
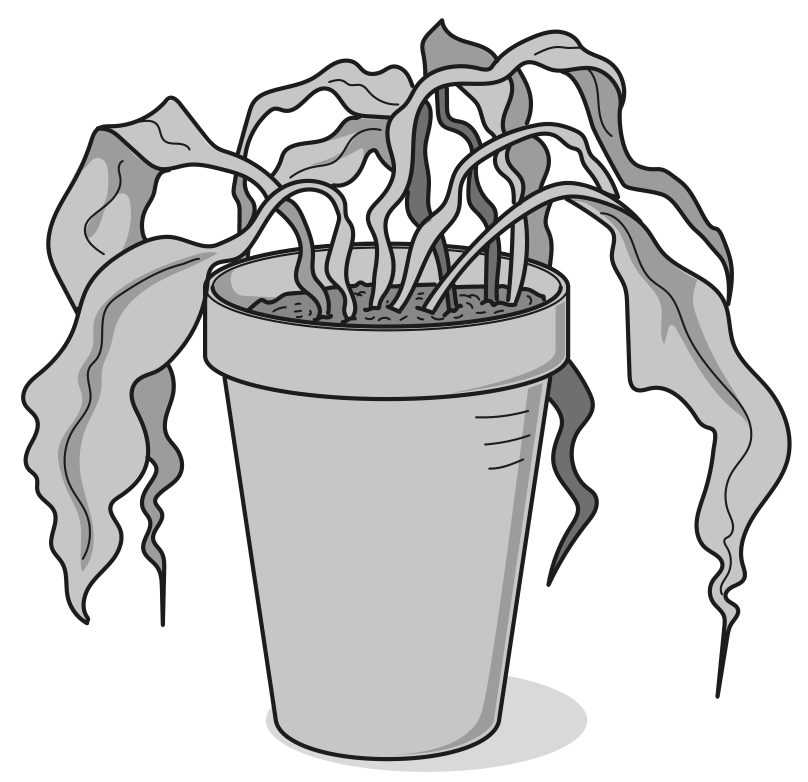
Fig. 3.2
State two conditions that are likely to increase the chances of wilting.
1
2
Explain what happens to the cells of a leaf to cause wilting.
Wilting may look harmful, but it is often a strategy for survival.
Suggest the advantages to a plant of wilting.
Which graph shows most clearly what will happen to the rate of transpiration as humidity increases?
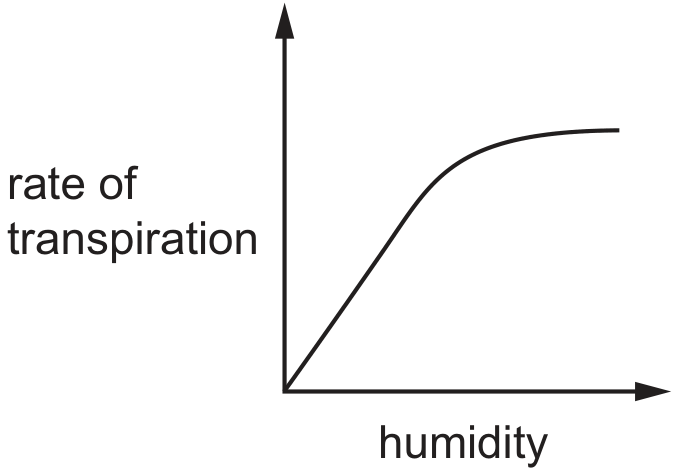
A
transpiration
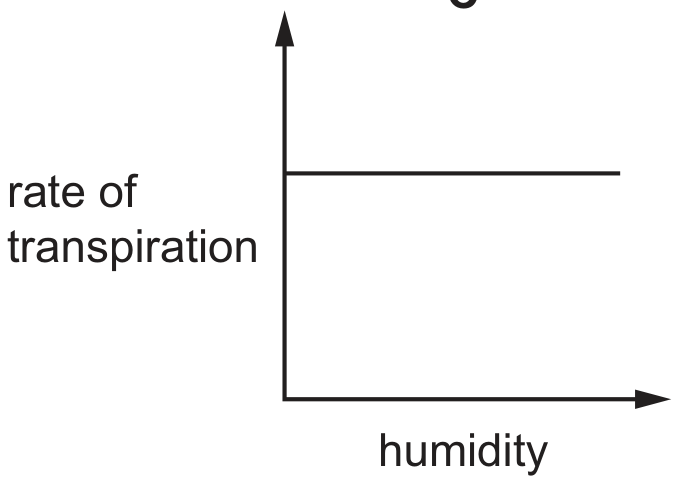
C
transpiration humidity
A student cut a section of a root and made an outline drawing of the distribution of tissues as shown in Fig. 3.1.
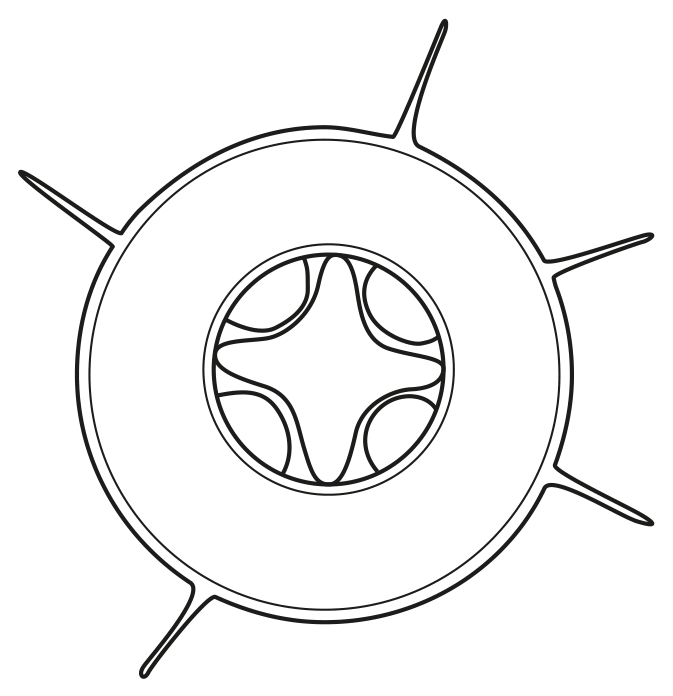
Fig. 3.1
Water absorbed by the roots moves through the stem and enters the leaves. Most of this water is lost in transpiration.
Explain how the internal structure of leaves results in the loss of large quantities of water in transpiration.
Fig. 3.1 is a photomicrograph of some xylem vessels.
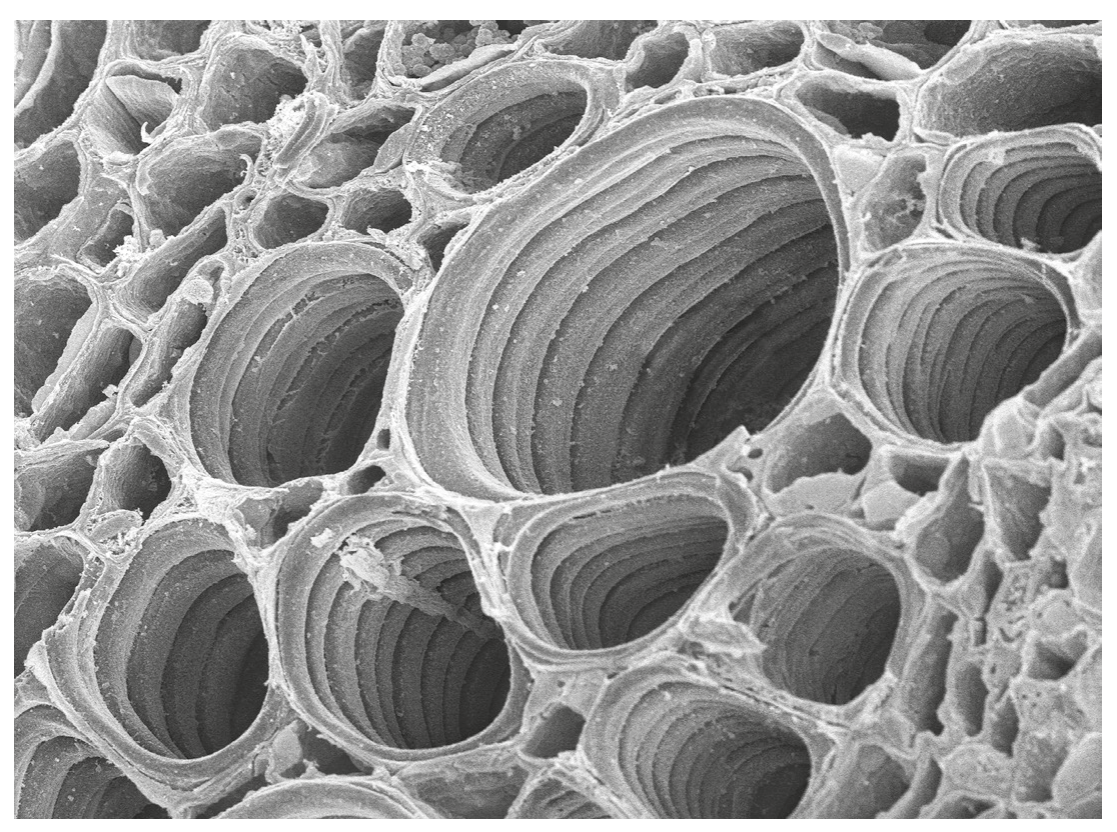
Fig. 3.1
Explain the mechanism that is responsible for the movement of water in xylem vessels.
The rate of transpiration is affected by several factors including the temperature and the humidity of the air.
State and explain the effect of an increase in temperature on the rate of transpiration.