EduNinja

IGCSE Biology Extended19.4.6—Interpret graphs and diagramsTopic Practice

19.4.6—Interpret graphs and diagrams

• Interpret graphs and diagrams of population growth

Question 2(c)(i)

[Maximum number: 2]

Carp are a type of fish. Researchers in Brazil measured the body lengths of a population of carp in a river in 1998 and again in 2008.

Histograms of their results are shown in Fig. 2.1.
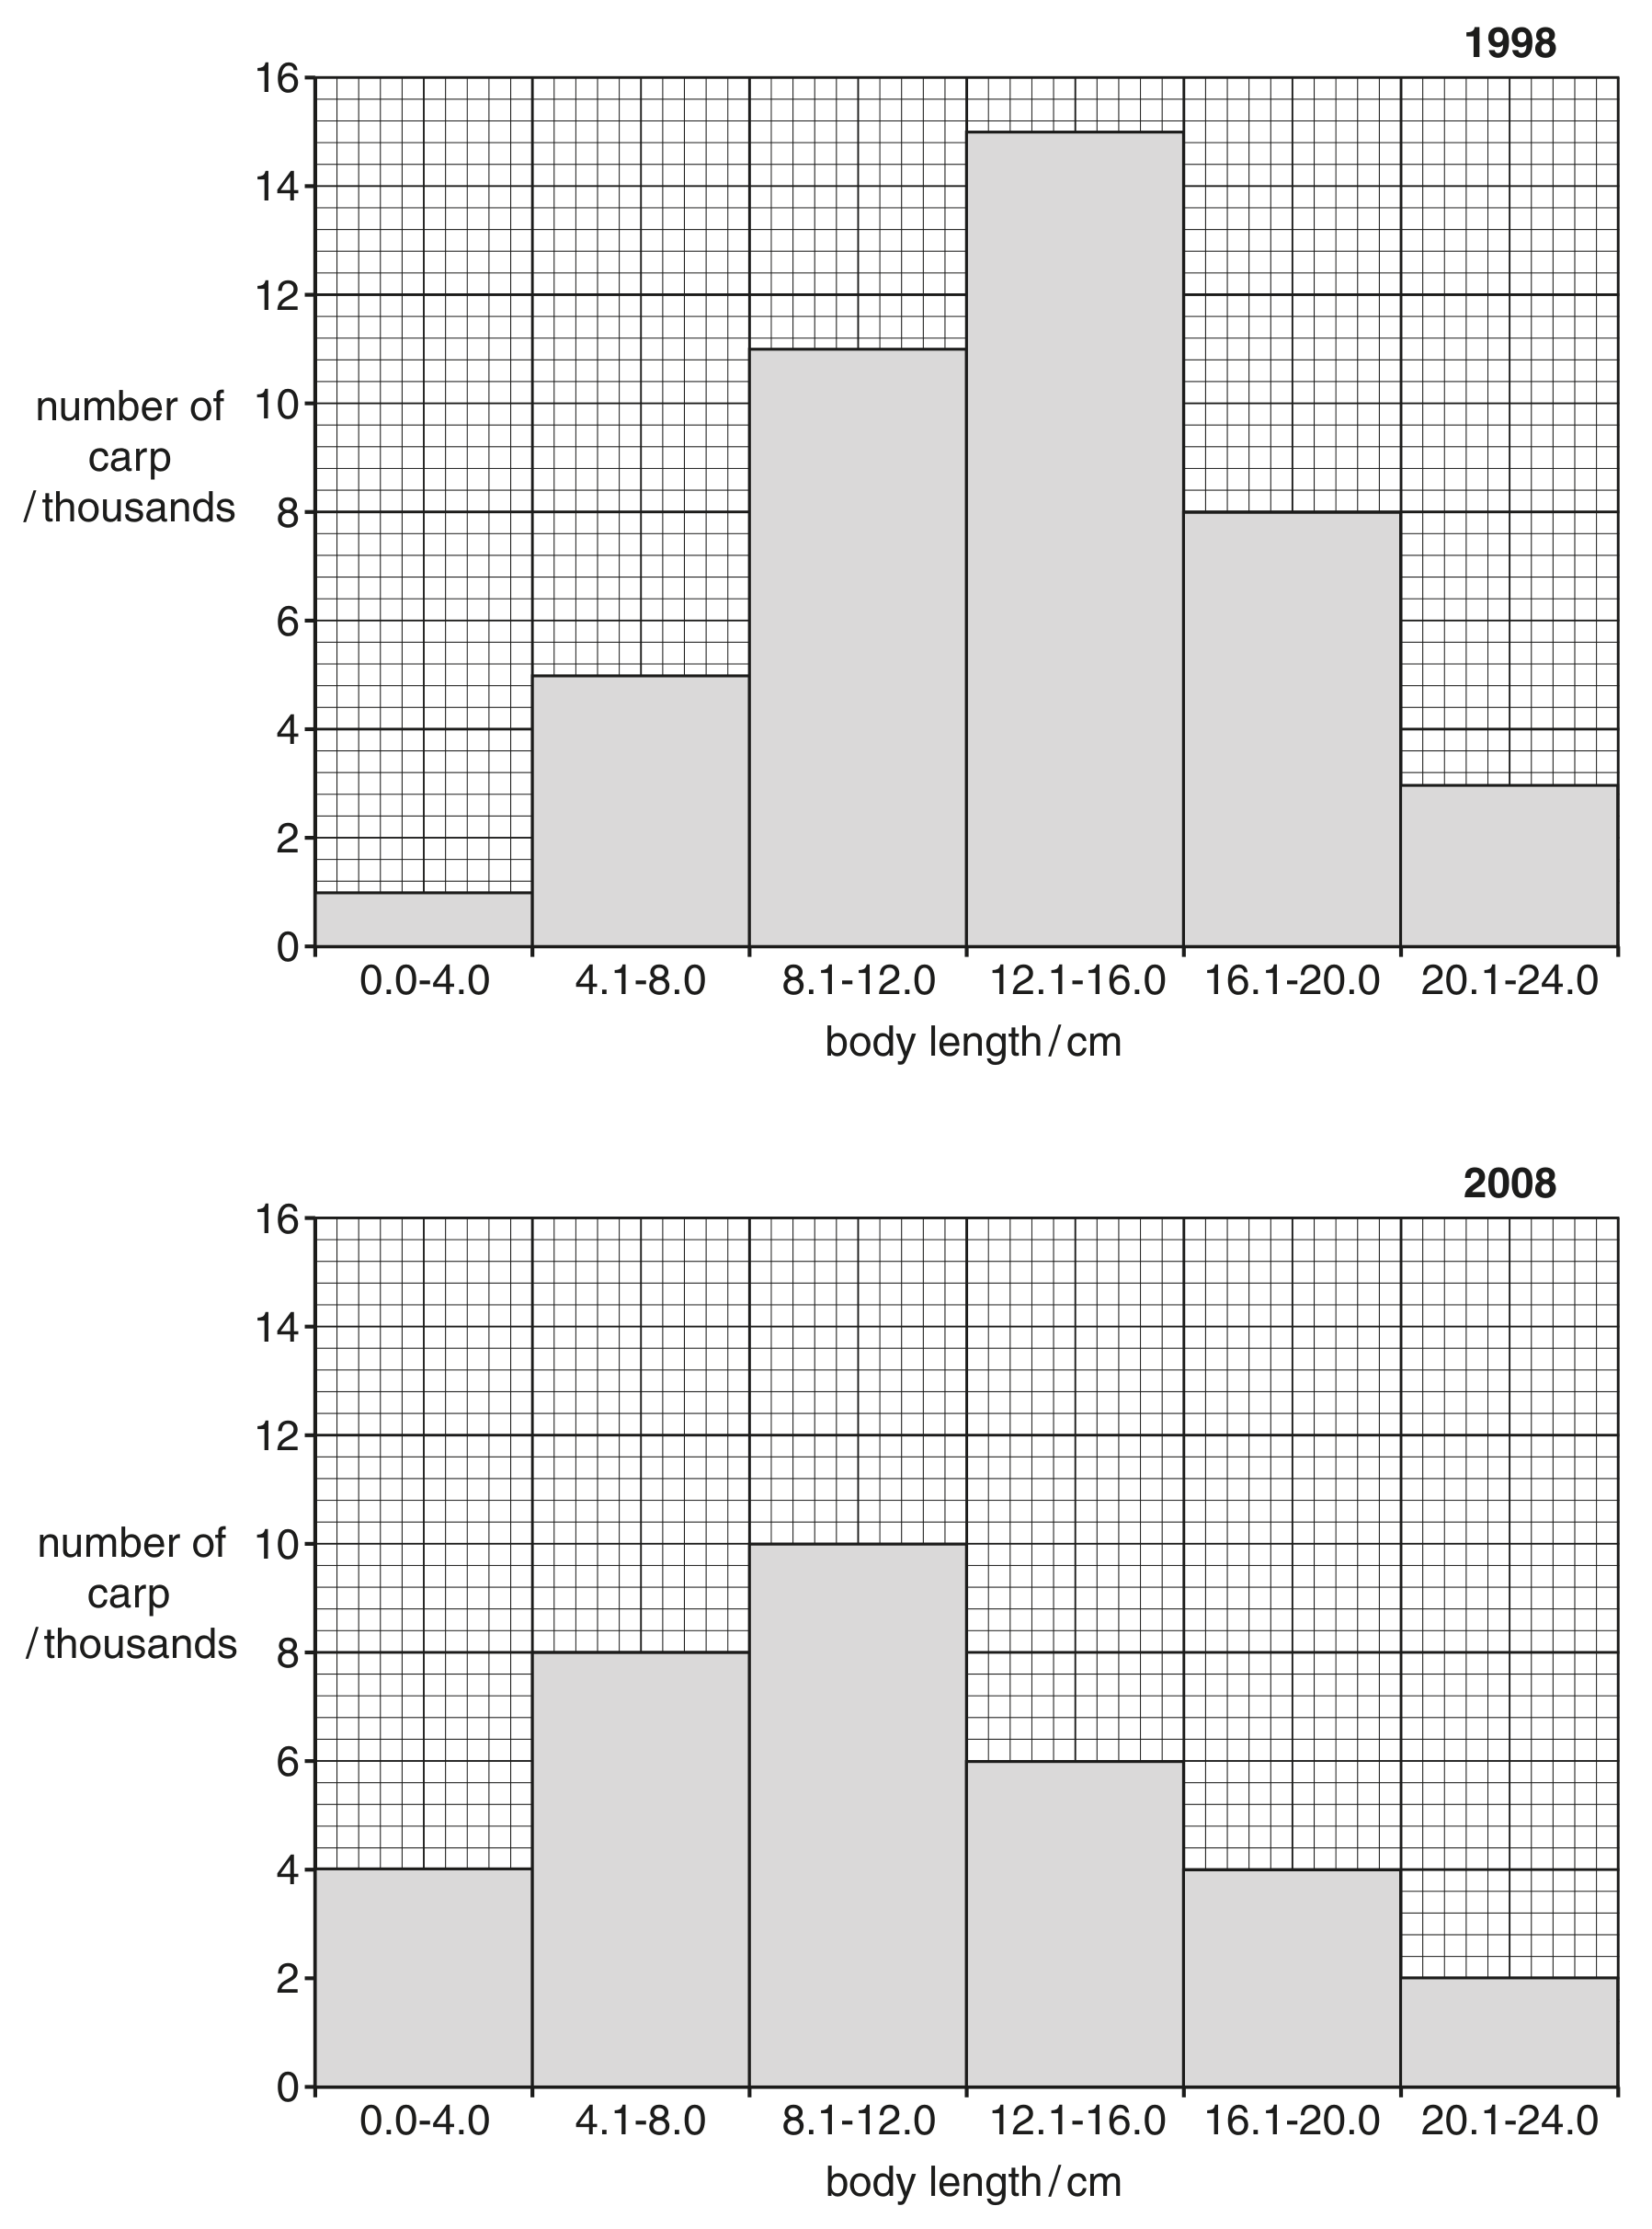
Fig. 2.1

Fig. 2.1

The total population of carp in 1998 was 43000 fish.

Calculate the total population of carp in 2008.

Show your working.
Question 5(d)(ii)

[Maximum number: 3]

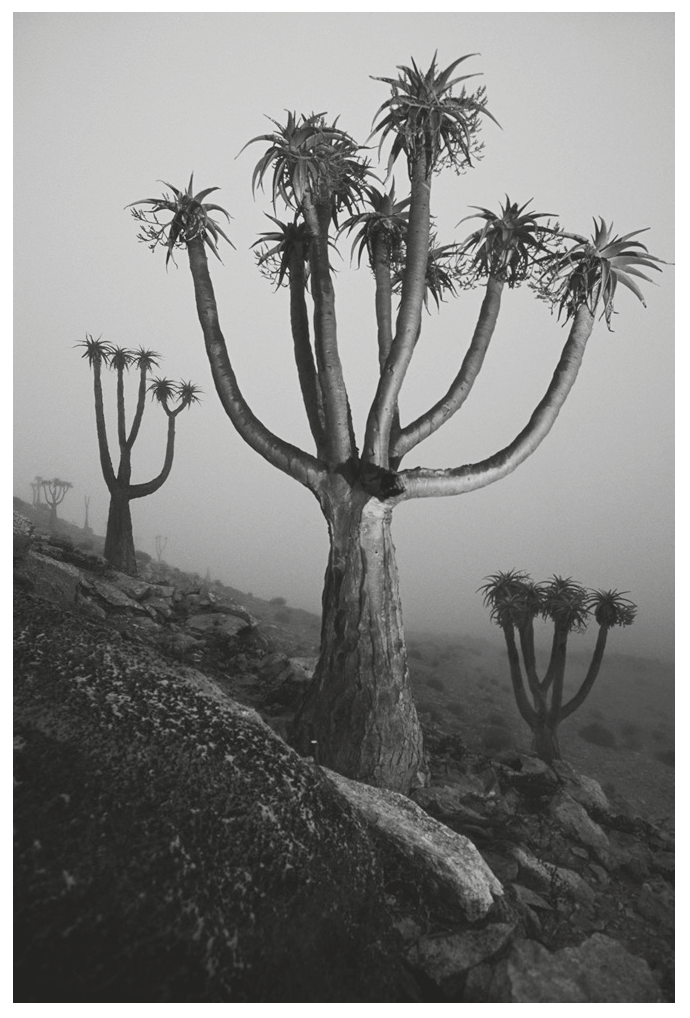
The giant quiver tree, Aloe pillansii, shown in Fig. 5.1, is an endangered species.
These long-lived trees grow in harsh environments. Some populations of A. pillansii are found within the Richtersveld National Park, but one population is found just outside on a mountain called Cornell's Kop in southern Africa.

Fig. 5.1

Fig. 5.1

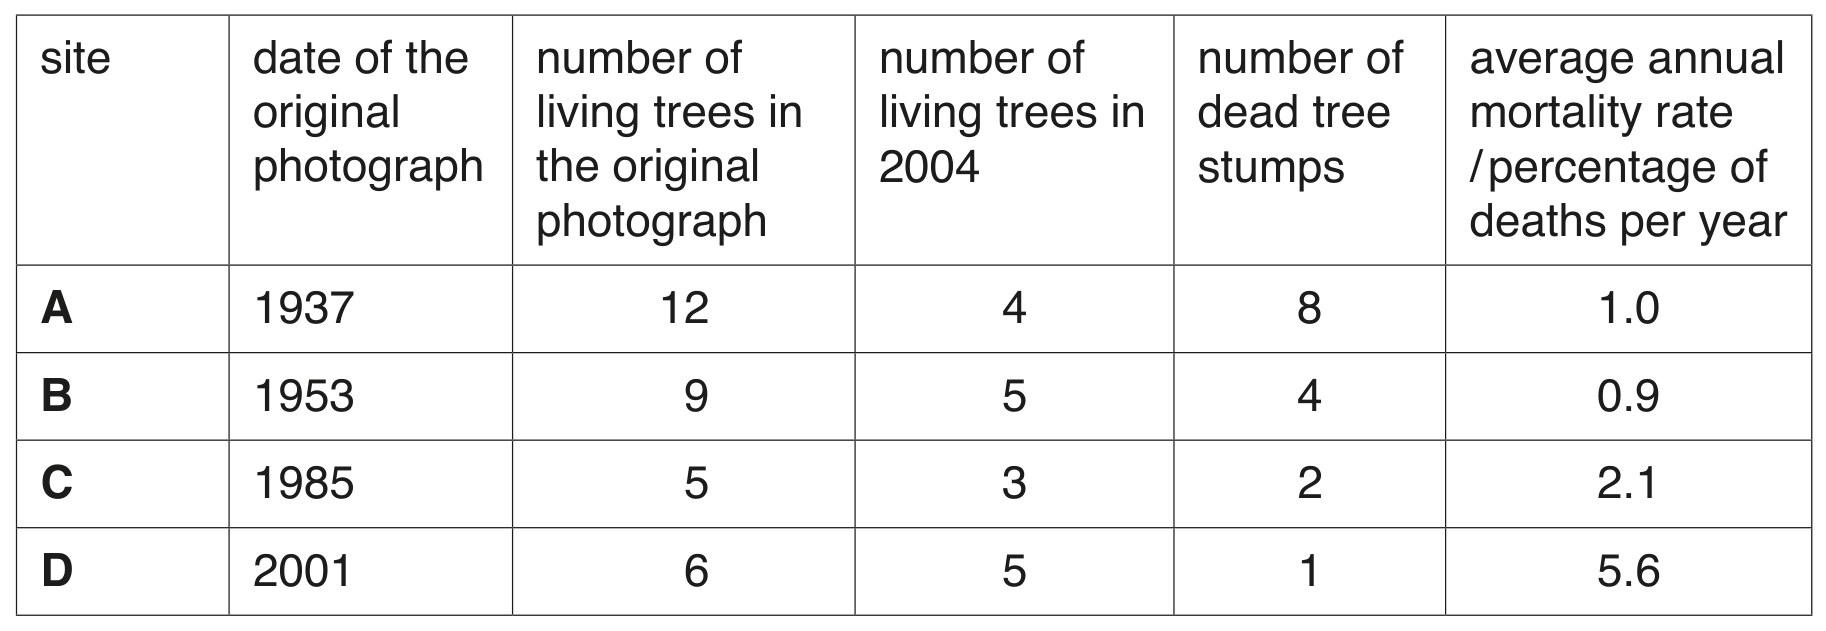
The population of A. pillansii trees on Cornell's Kop was surveyed and photographed at four sites, A to D, from 1937 onwards. Researchers took photographs at all four sites in 2004 and compared them with the original photographs.

The results are shown in Table 5.1.

Table 5.1

Table 5.1

Describe what the analysis of the photographs shows about the population of A. pillansii on Cornell's Kop.

Question 5

[Maximum number: 6]

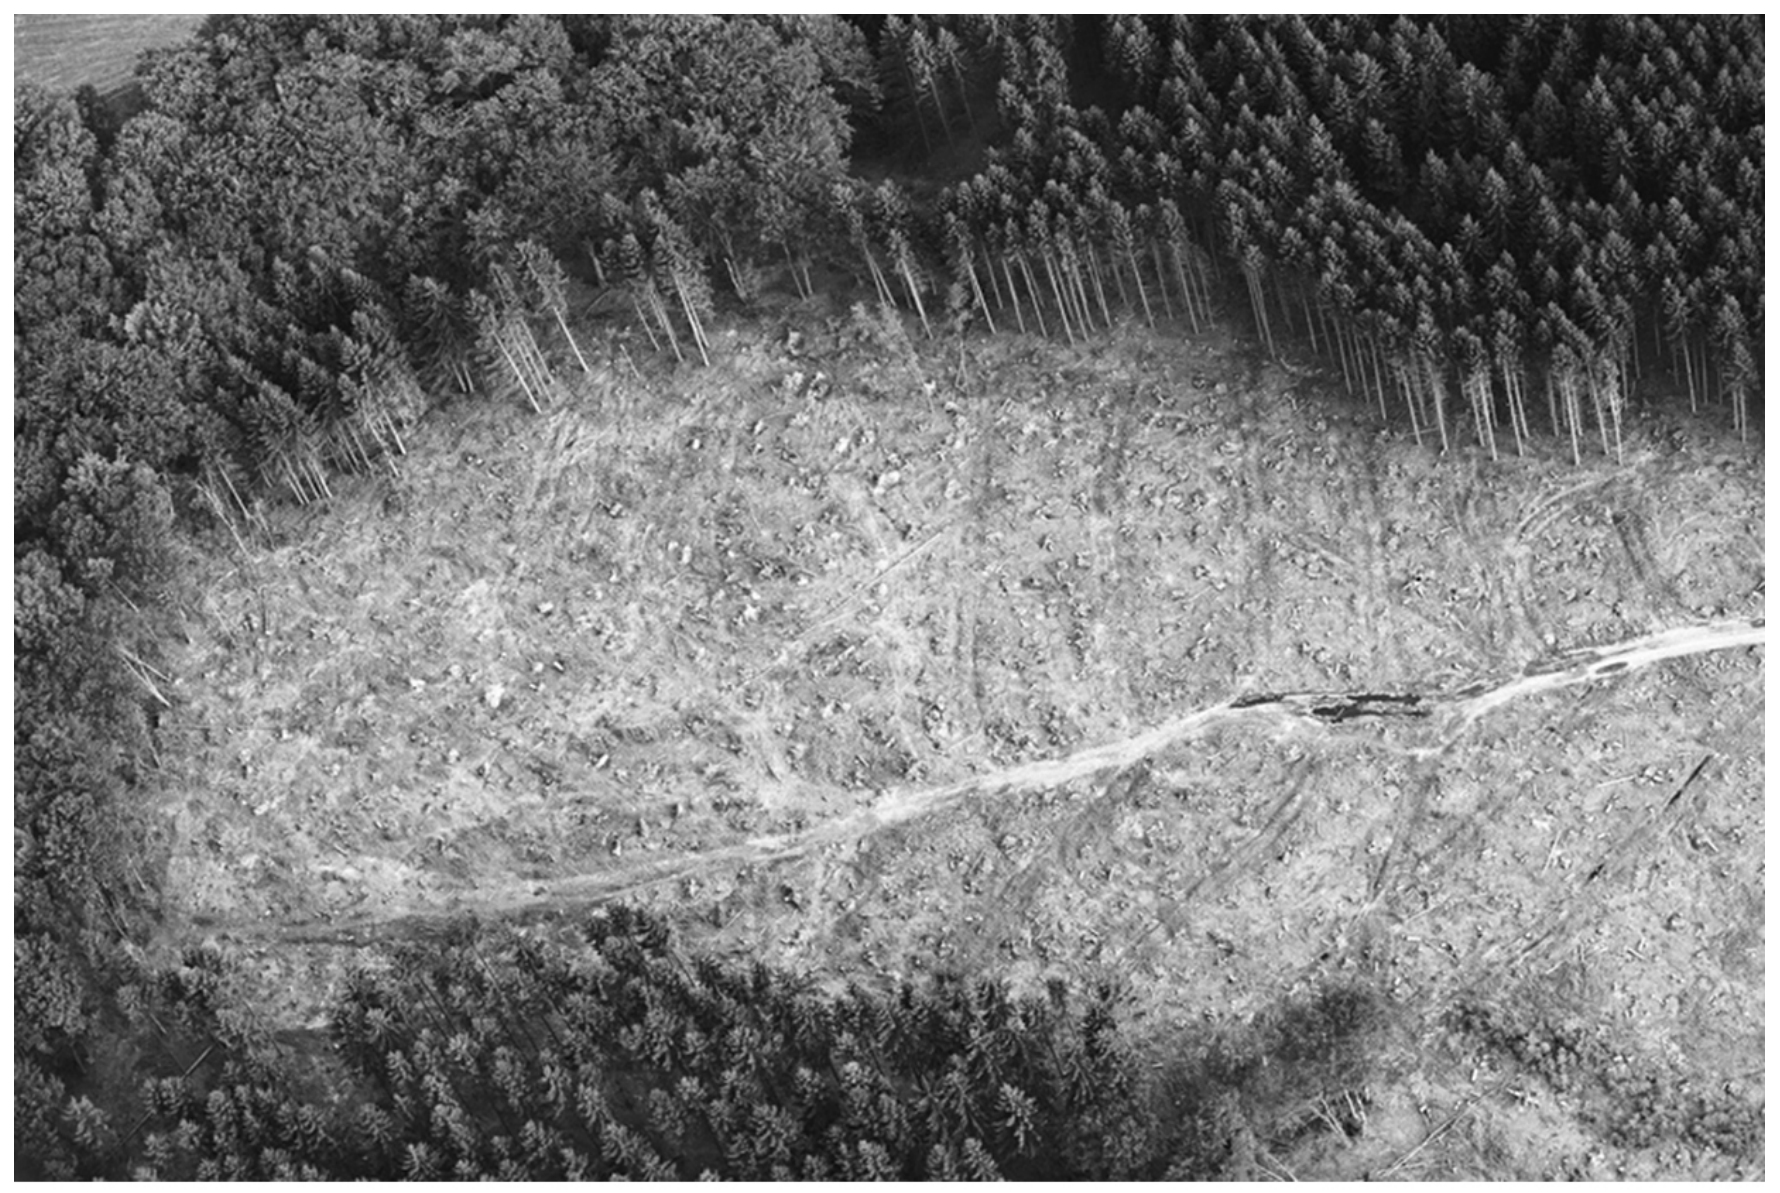
Fig. 5.1 shows an area of forest where some of the trees have been cut down.

Fig. 5.1

Fig. 5.1

Question 5(b)

(a)

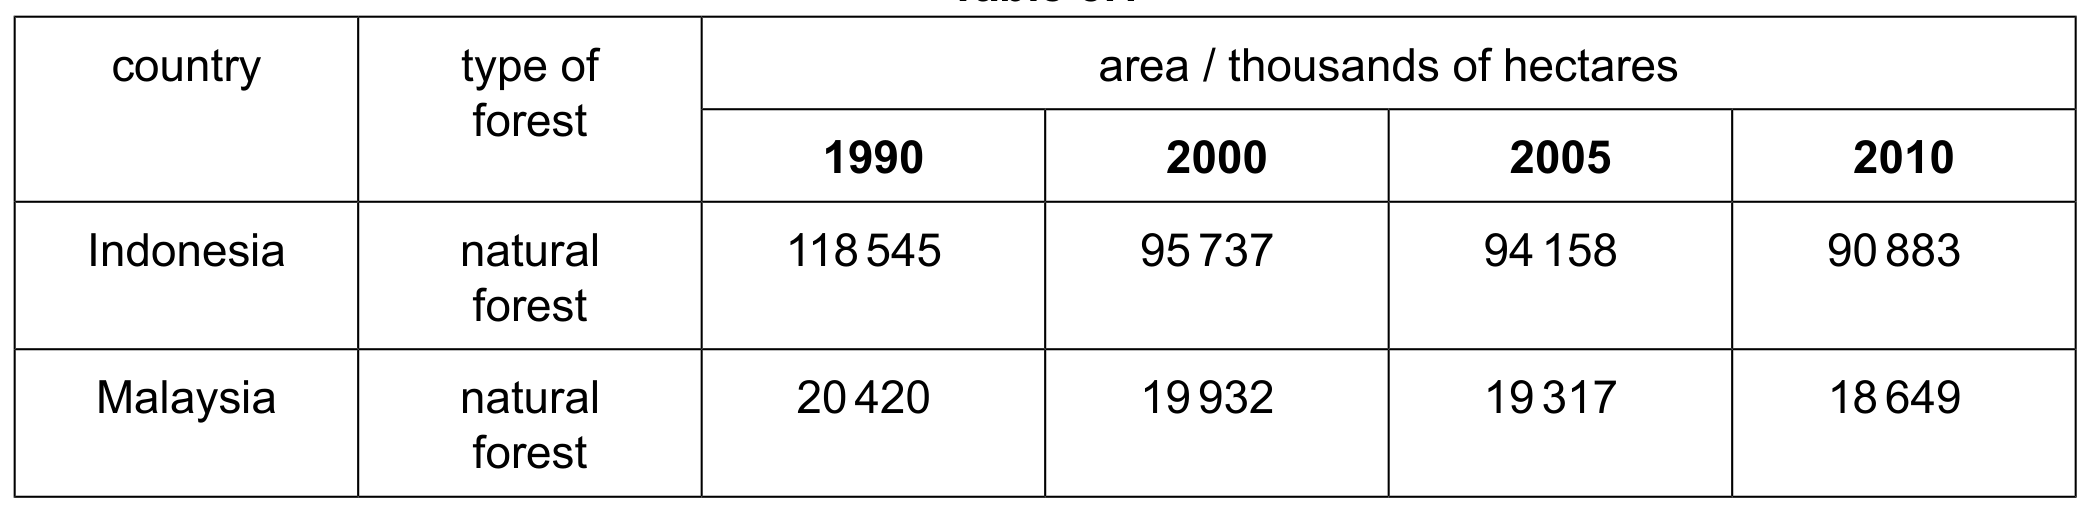
The loss of forests from parts of the world is assessed by satellite imagery. Table 5.1 shows data on the forests in Indonesia and Malaysia, two countries in South-East Asia which have large areas of forest.

Table 5.1

Table 5.1

[ 6 ]

Question 5(b)(i)

(i)

Calculate the percentage loss of natural forest in Indonesia between 1990 and 2010. Show your working and express your answer to the nearest whole number.

[ 3 ]

Question 5(b)(ii)

(ii)

Use the data in Table 5.1 to compare the loss of natural forest in Indonesia with the loss of natural forest in Malaysia.

[ 3 ]

Question 5(c)(iii)

[Maximum number: 1]

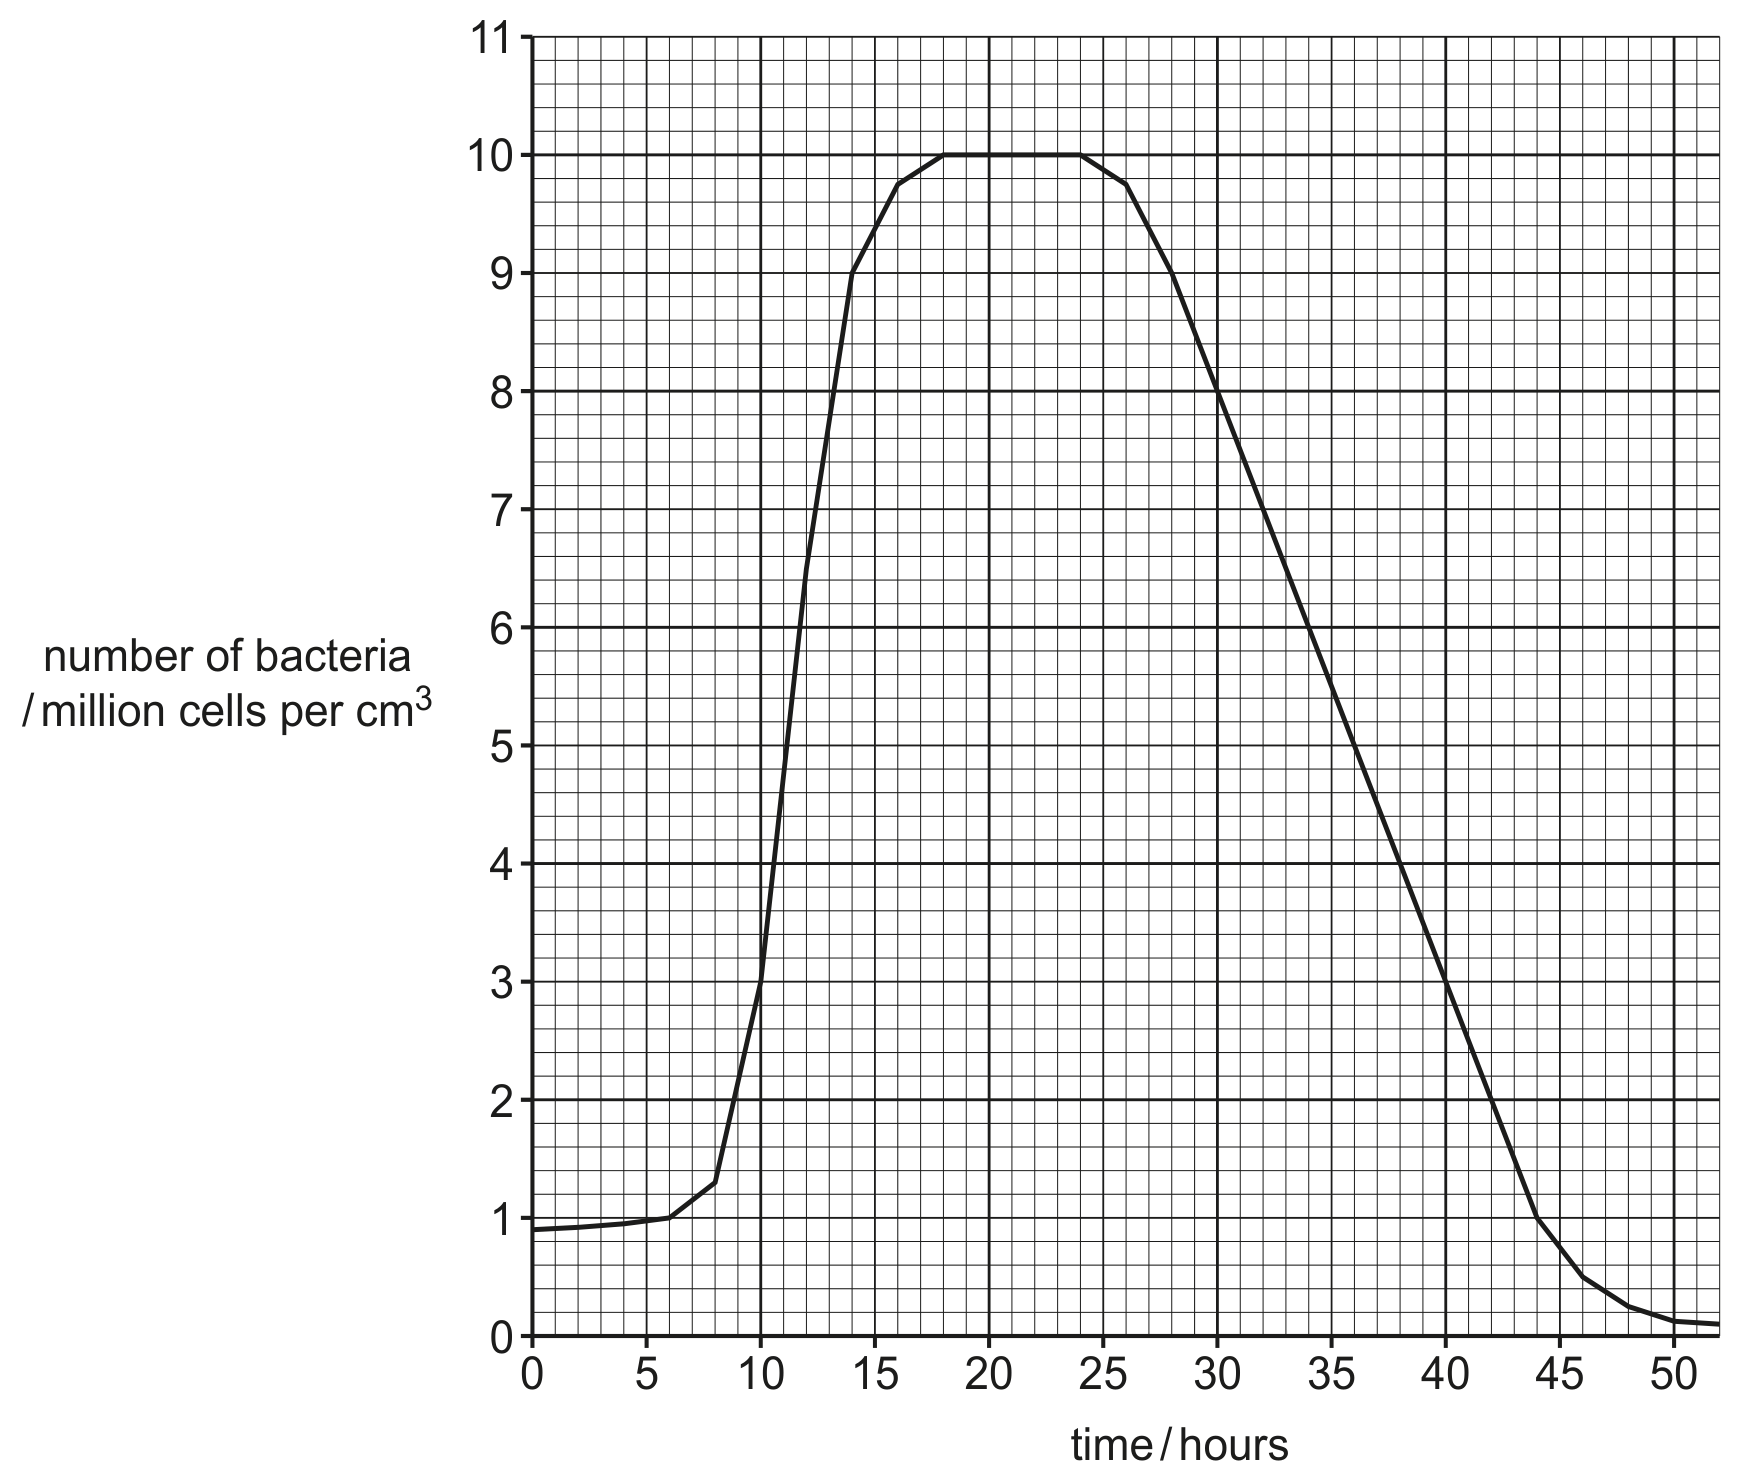
Genetically modified bacteria were grown in a fermenter. The number of bacteria was measured, and the data are shown in Fig. 5.1.

Fig. 5.1

Fig. 5.1

Calculate how long it takes for the number of bacteria to reduce by half after the bacteria have been in the fermenter for 24 hours. hours

Question 5

[Maximum number: 6]

The Arabian oryx and the northern white rhinoceros are both mammals.
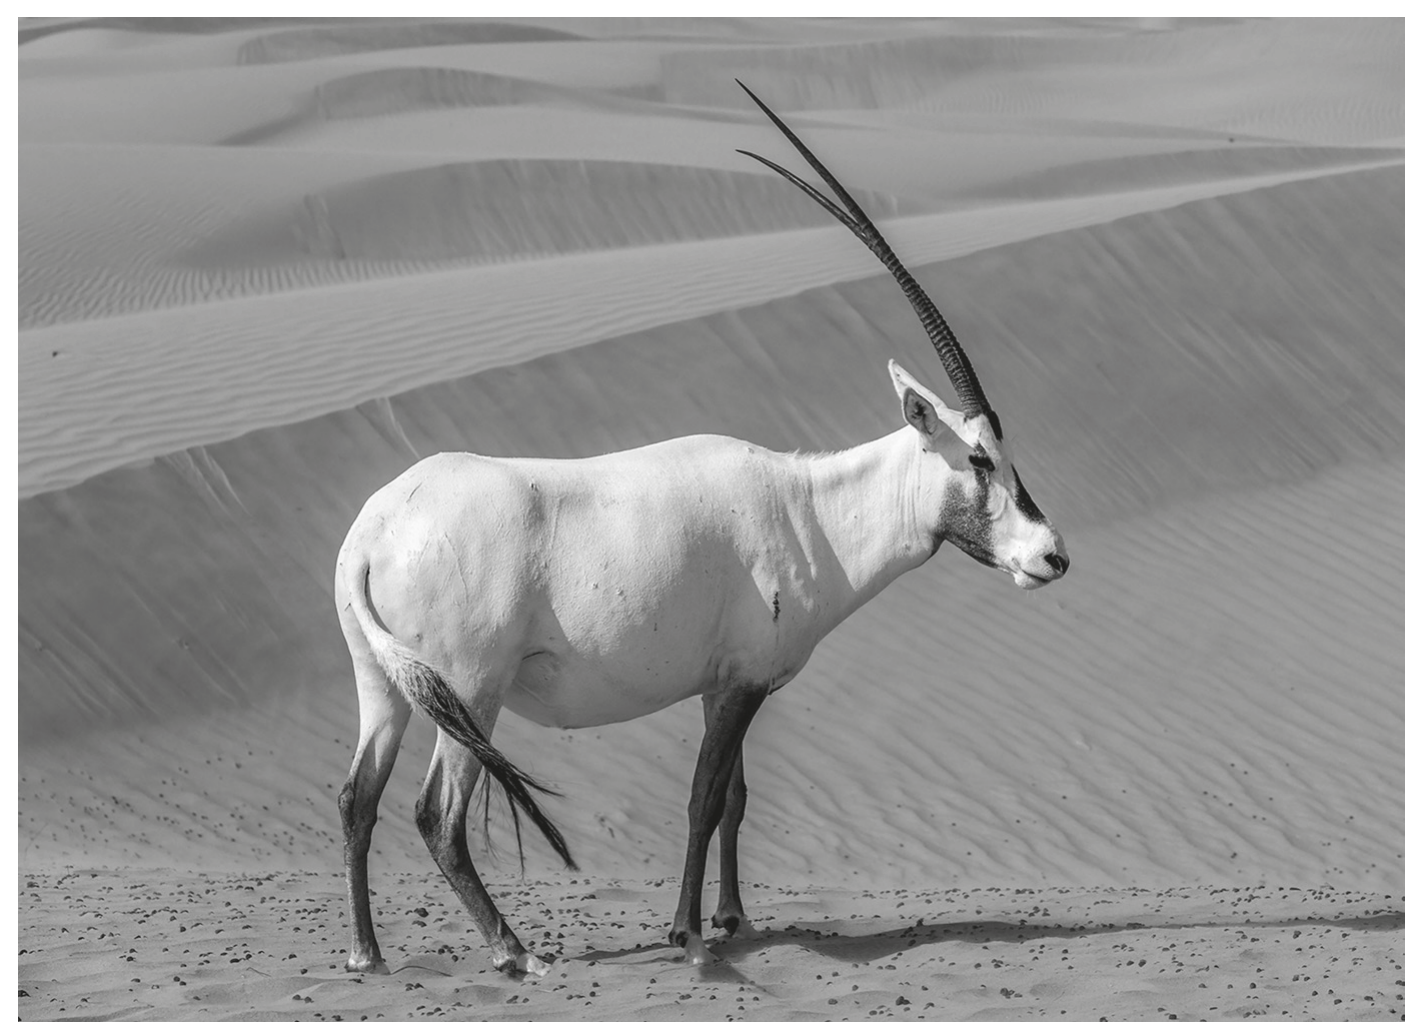
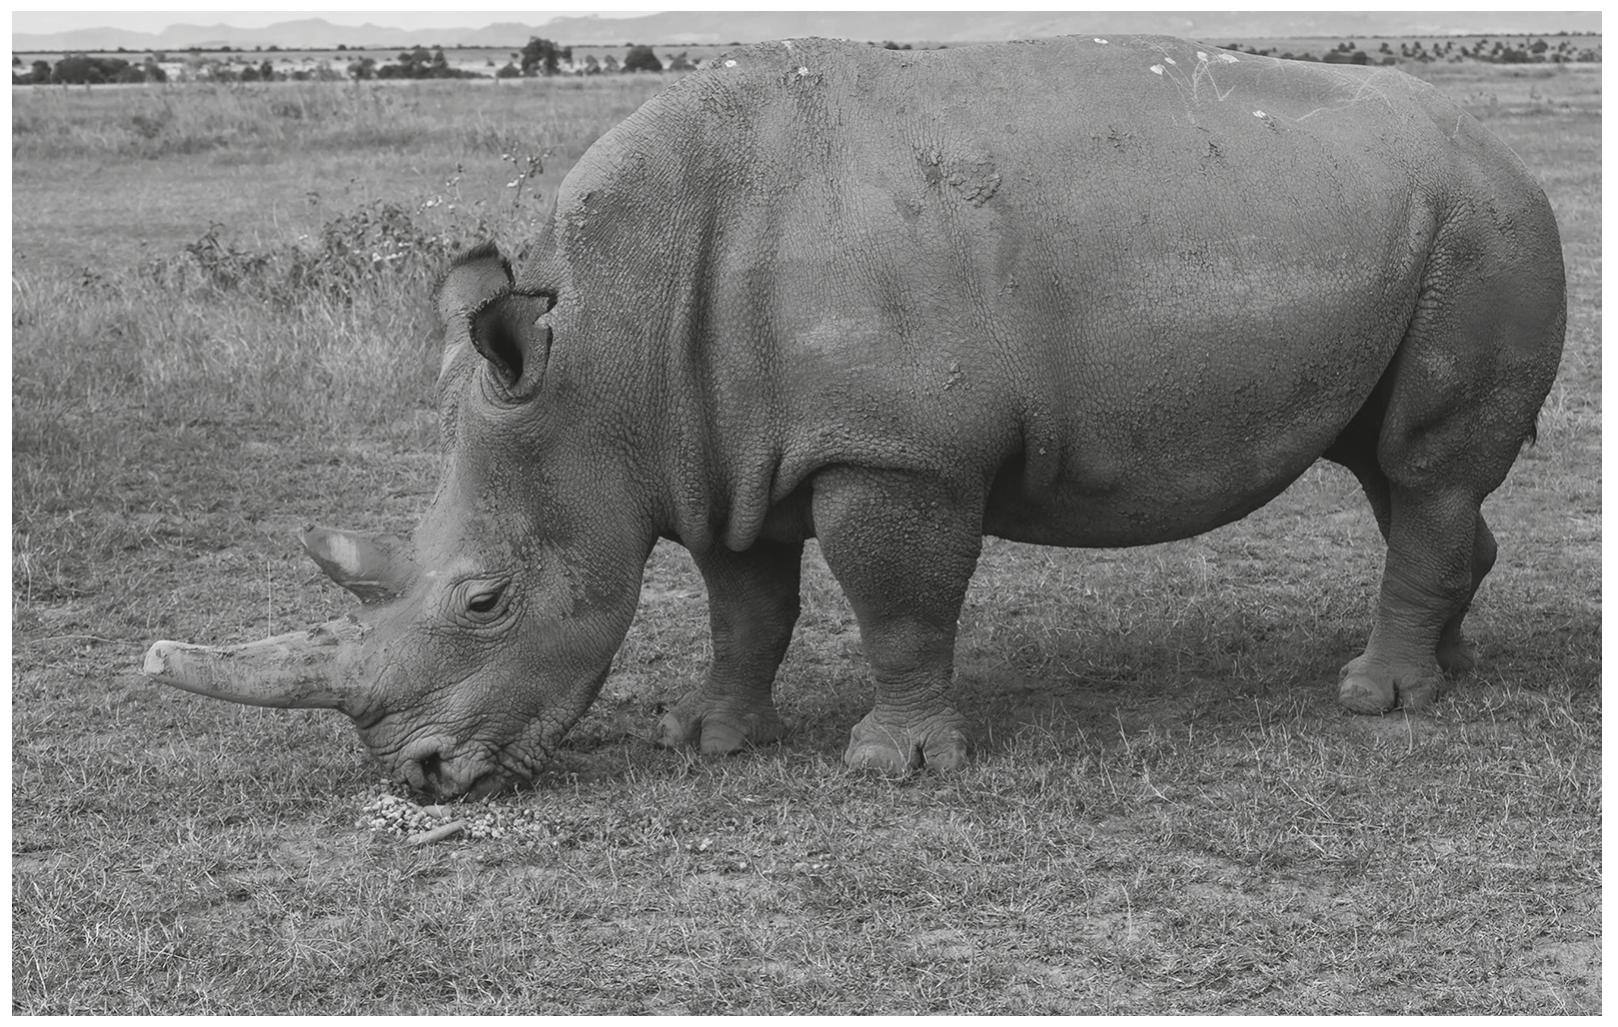
Fig. 5.1 is a photograph of an Arabian oryx. Fig. 5.2 is a photograph of a northern white rhinoceros.

Fig. 5.1

Fig. 5.1

Fig. 5.2

Fig. 5.2

Question 5(b)

(a)

Different conservation methods are used to try to prevent species from becoming extinct.

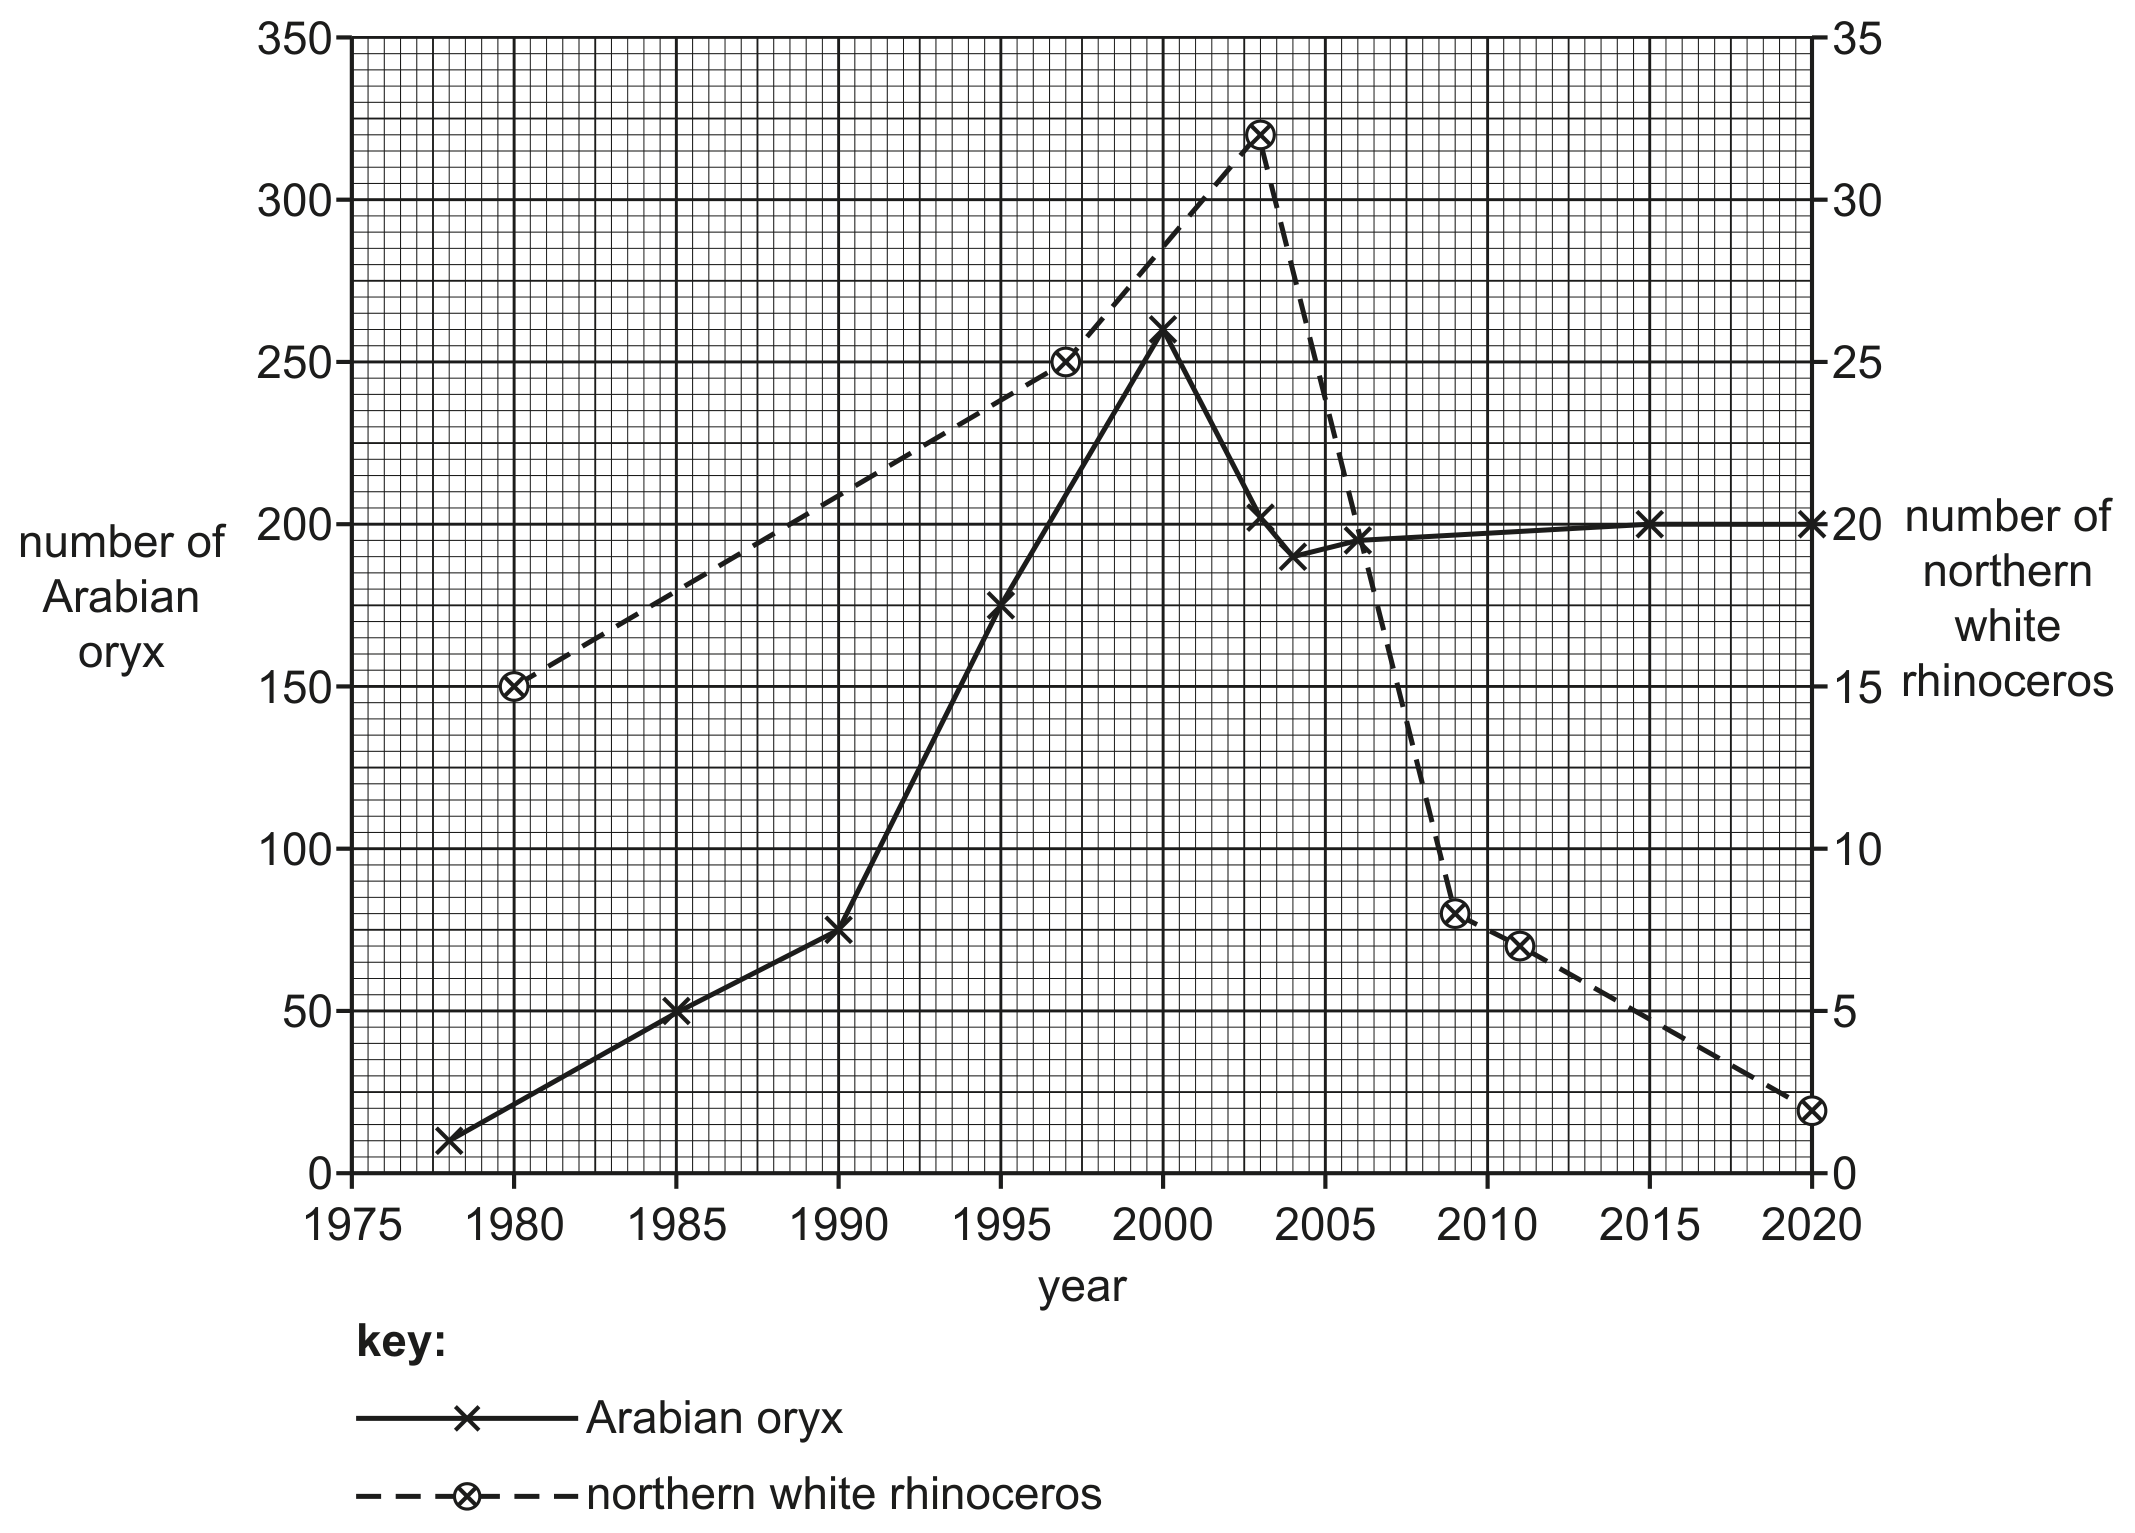
A population of the Arabian oryx and a population of northern white rhinoceros were monitored.

Fig. 5.3 shows how the population size of each species has changed over time.

Fig. 5.3 shows how the population size of each species has changed over time.

[ 6 ]

Question 5(b)(i)

(i)

Calculate the percentage increase in the number of Arabian oryx between 1990 and 2000.
Give your answer to three significant figures.
.

[ 3 ]

Question 5(b)(ii)

(ii)

Describe the data for the northern white rhinoceros shown in Fig. 5.3.

[ 3 ]

Question 5(b)(ii)

[Maximum number: 2]

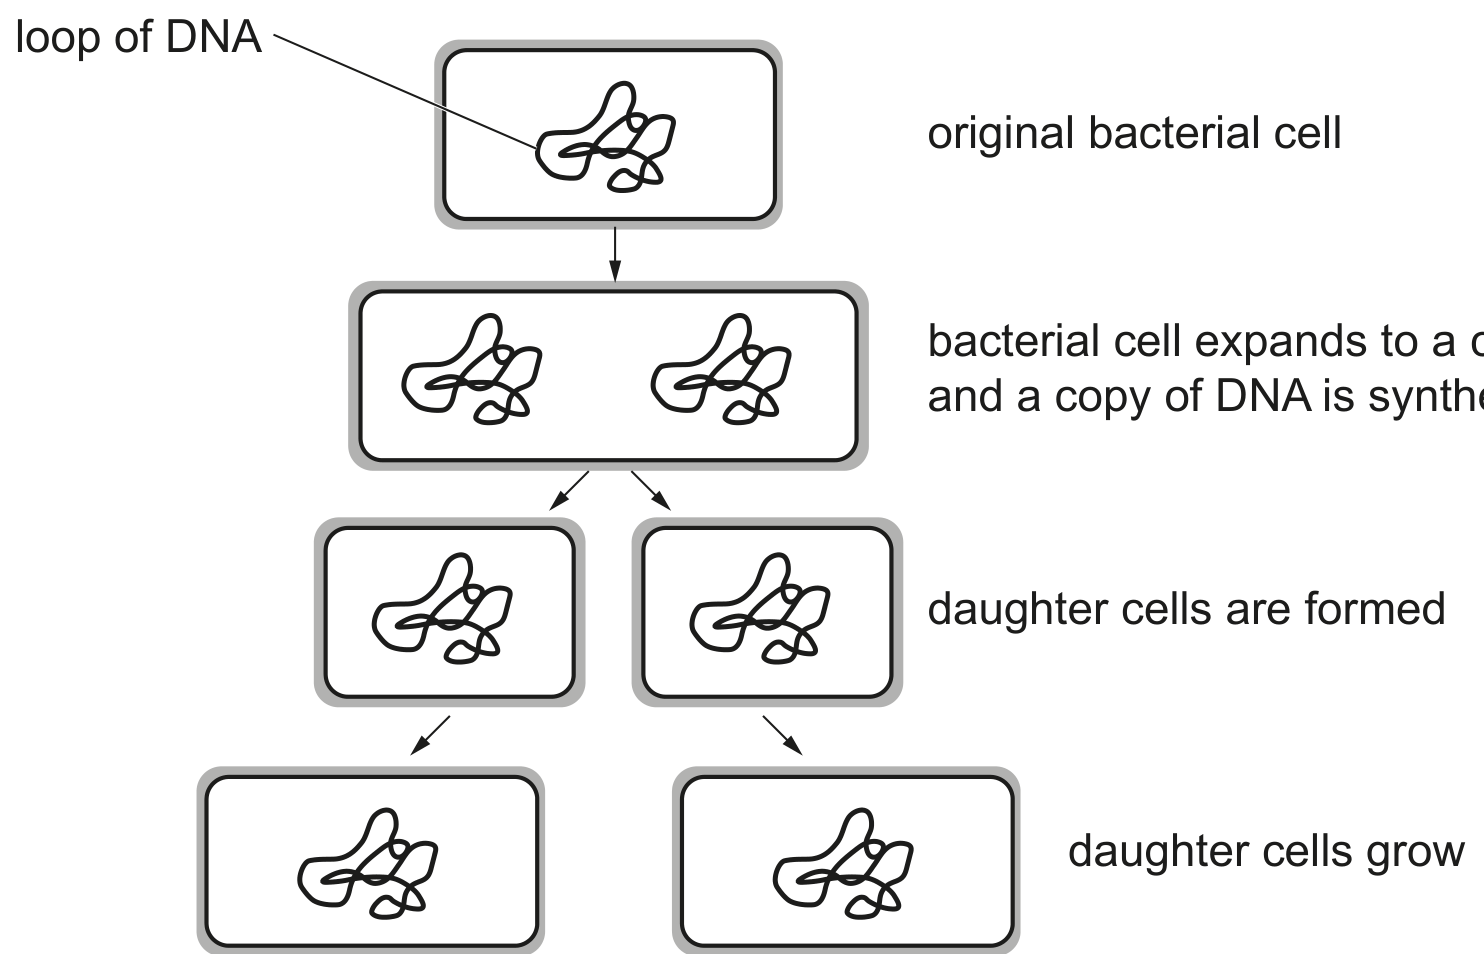
Fig. 5.1 shows some of the stages in the reproduction of the bacterium Escherichia coli.

Fig. 5.1

Fig. 5.1

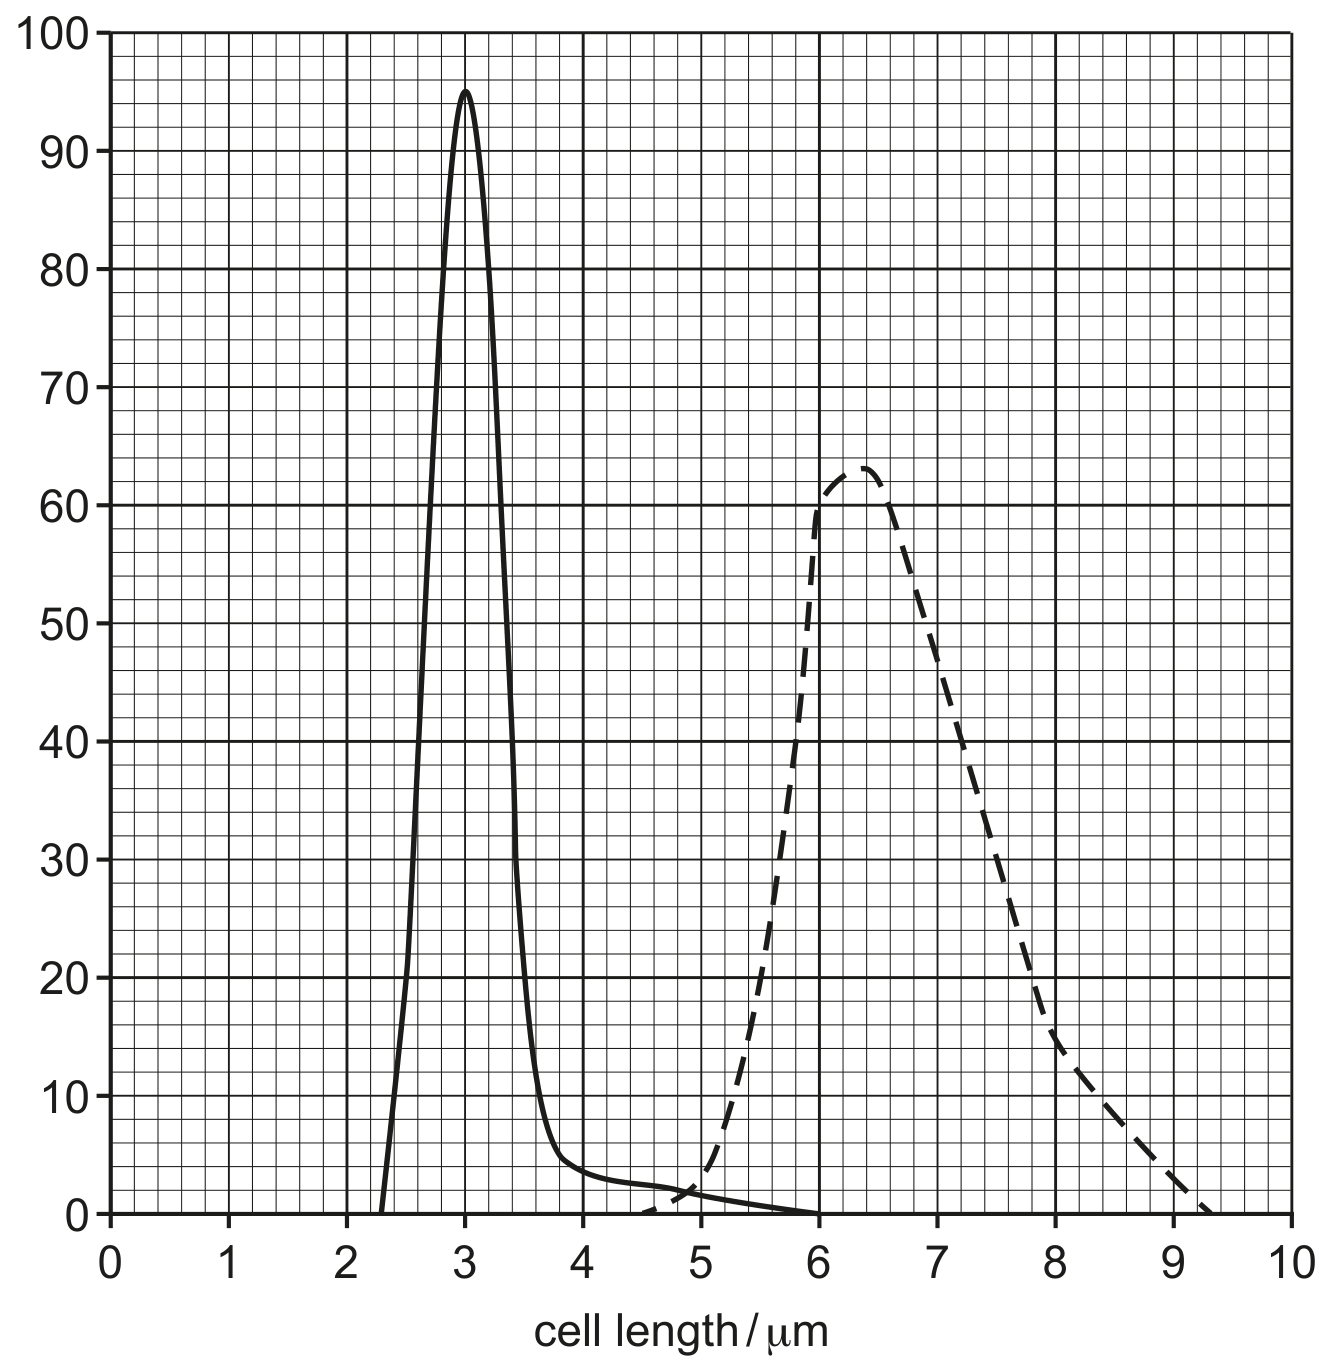
Students used a microscope and time-lapse photography to observe E. coli cells reproducing. They used the series of photographs to identify which cells were dividing.

They measured the lengths of the dividing cells and put their data into two groups:
- cell lengths immediately before cell division
- cell lengths immediately after cell division.

Fig. 5.2 shows their results.
key: immediately after division
- - immediately before division

number of cells

number of cells

Some students concluded that the cells must be at least 6μ m6 \mu \mathrm{~m} in length before cell division can occur.

Describe the evidence against the students' conclusion. Use the information in Fig. 5.2 to support your answer.

Question 5

[Maximum number: 5]

Fires release carbon dioxide into the atmosphere.

Question 5(b)

(a)

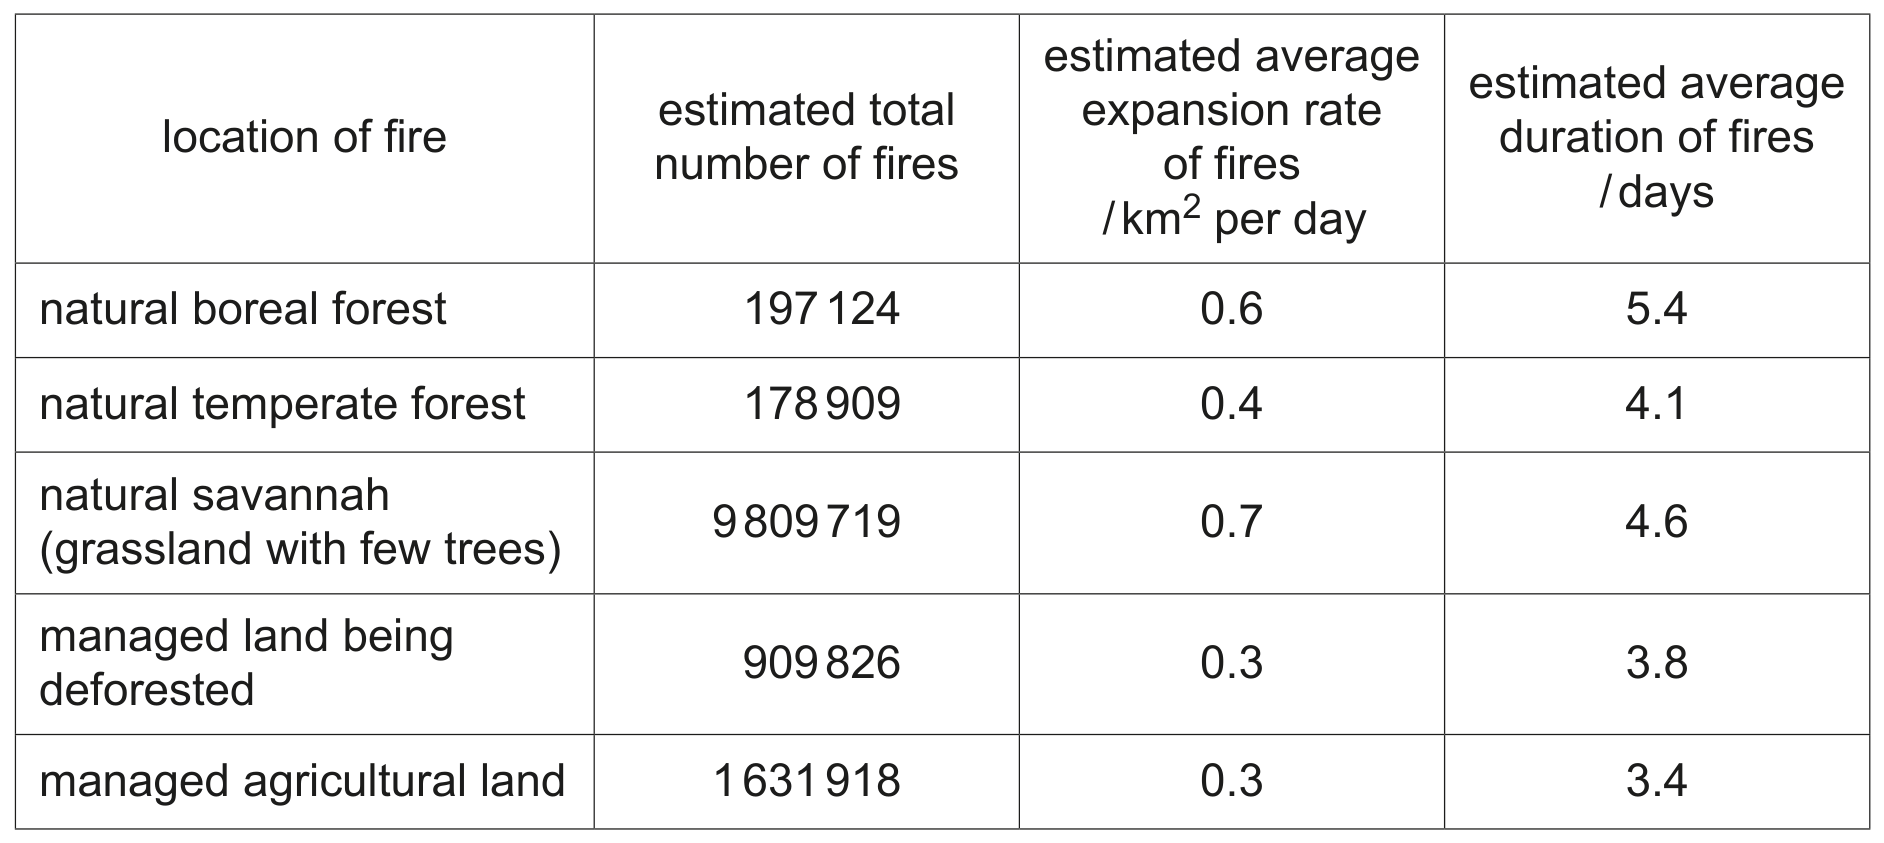
Data scientists used satellite images to analyse the occurrence of fires globally, during a 14-year period. They tracked all fires that were larger than 0.21 km20.21 \mathrm{~km}^{2} and therefore visible from space.

Table 5.1 summarises some of their data, categorising the fires by location. The locations include natural ecosystems and land that is managed by people. The expansion rate is the speed at which each fire becomes larger.

Table 5.1

Table 5.1

[ 5 ]

Question 5(b)(i)

(i)

Using the information in Table 5.1, compare the data for the two managed locations with the data for the three natural locations.

[ 3 ]

Question 5(b)(ii)

(ii)

Describe how the data in Table 5.1 could be used to estimate the total area that was burnt during the 14-year period, for each location.

[ 2 ]

Question 6(c)

[Maximum number: 4]

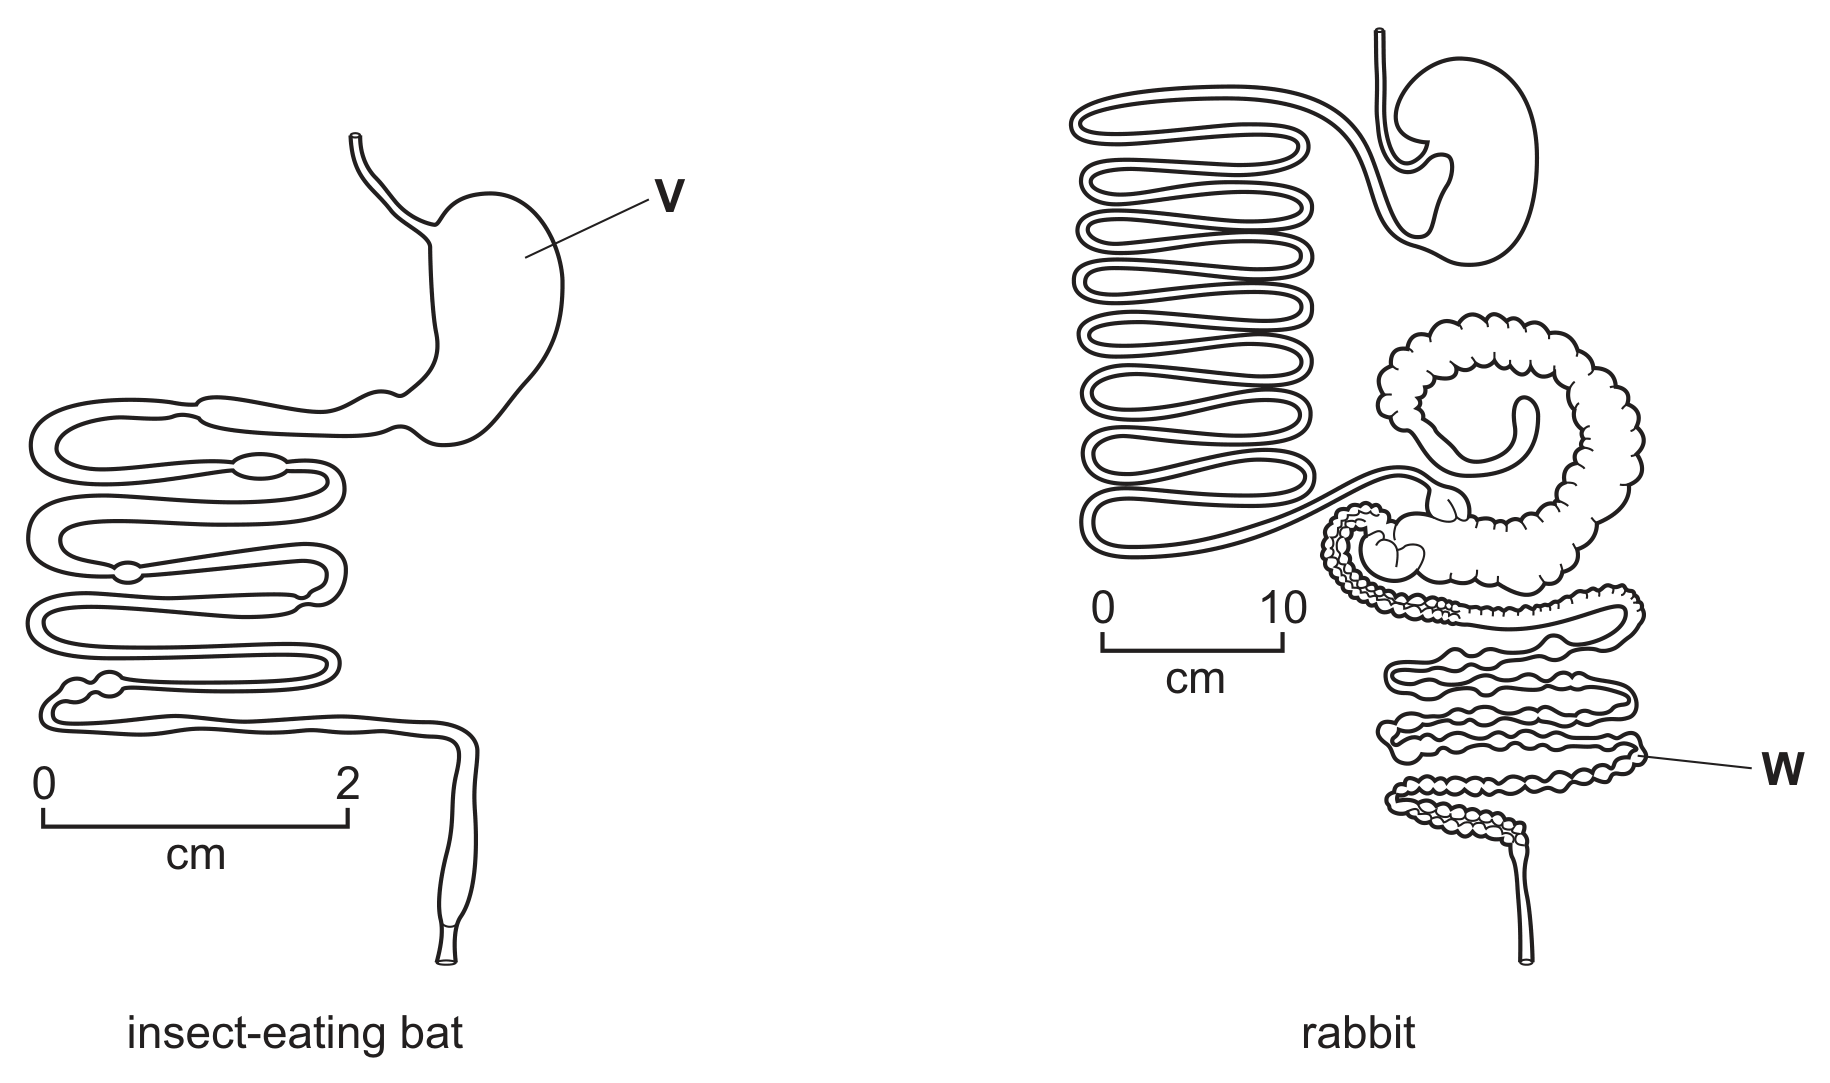
Fig. 6.1 shows the alimentary canals of two mammals, an insect-eating bat, which is a carnivore, and a rabbit, which is a herbivore.

Fig. 6.1

Fig. 6.1

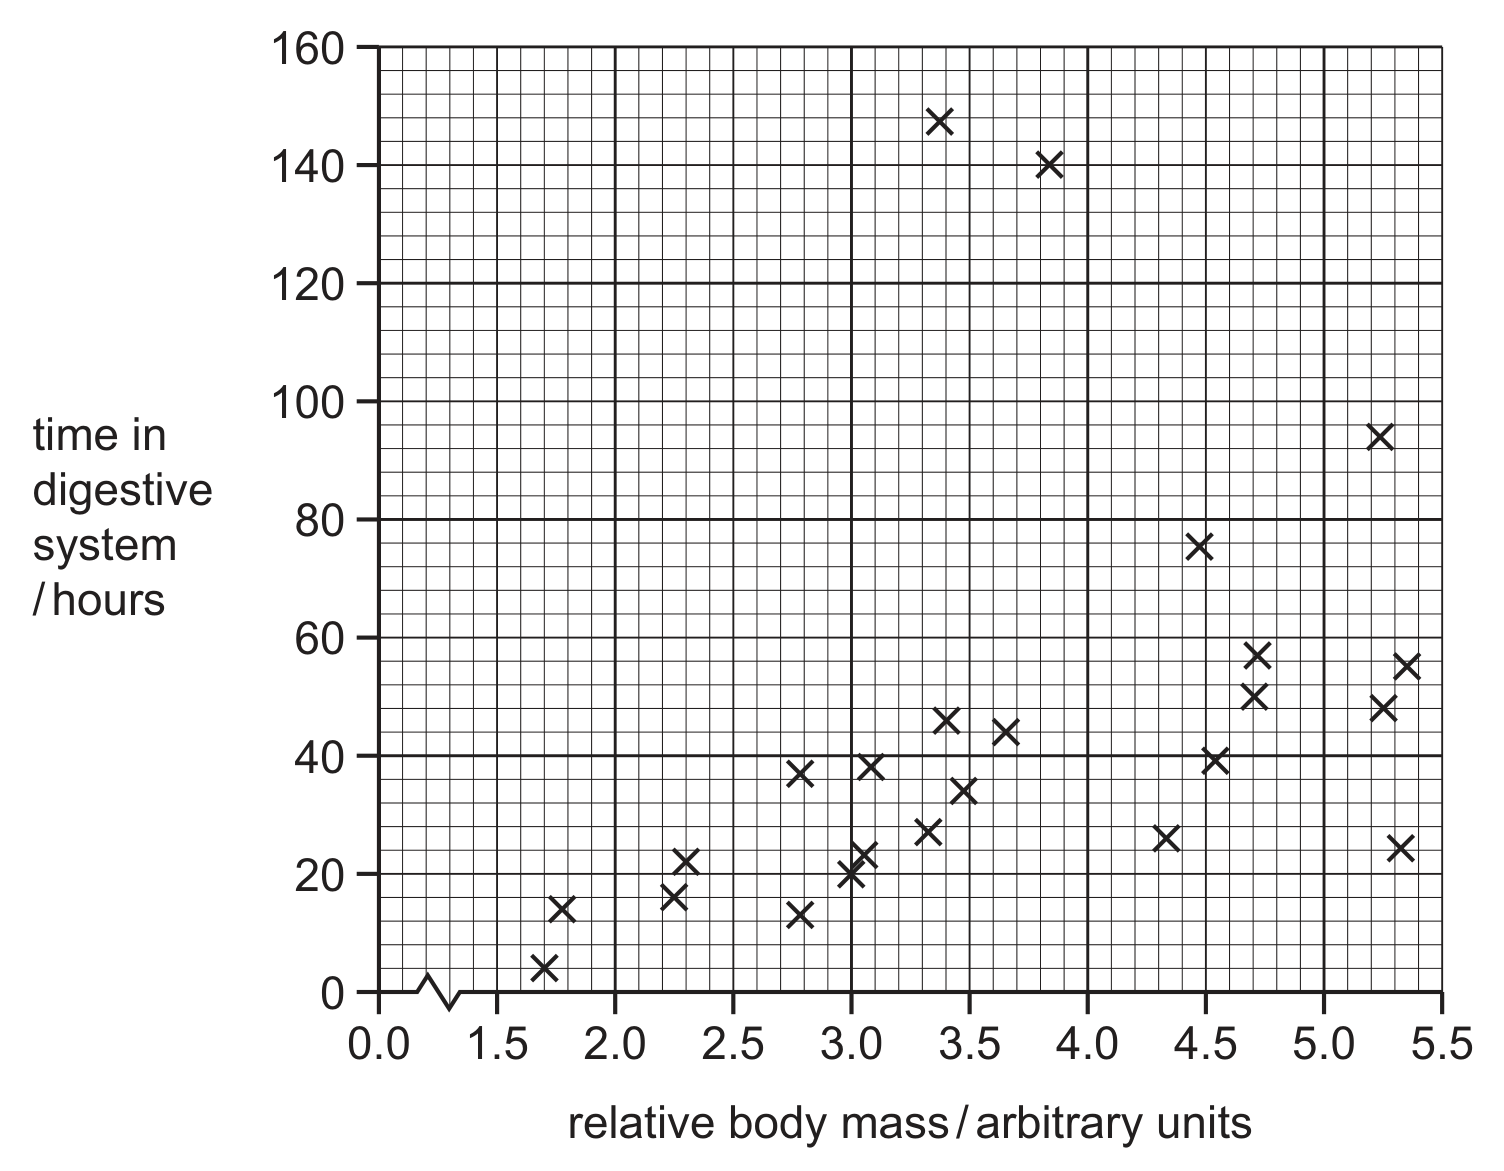
Scientists investigated digestion in different species of mammal. The mammals that they studied ranged in size from an elephant shrew, Elephantulus edwardii, with a mass of 50 g to an ox, Bos taurus, with a mass of 220 kg .

The scientists added indigestible particles to the animals' food and timed how long the particles stayed in the digestive system.

The results for 24 different mammal species are shown in Fig. 6.2.

Fig. 6.2

Fig. 6.2

The scientists concluded that food stays longer in the digestive systems of larger mammals compared with smaller mammals.

Discuss the evidence from Fig. 6.2 for and against the statement that food stays longer in the digestive systems of larger mammals.

Question 6(c)(i)

[Maximum number: 3]

Fig. 6.1 shows a boreal toad, Anaxyrus boreas. This toad is listed as an endangered species.

Fig. 6.1

Fig. 6.1

Scientists investigated whether increasing the number of beneficial bacteria that live on the toads' skin could provide protection against the fungus. The scientists took 42 toads and placed 21 in group 1 and 21 in group 2.
- Group 1 - the toads' skin was treated with beneficial bacteria.
- Group 2 - the toads' skin was not treated with beneficial bacteria.

The scientists measured the number of toads that became infected with the fungus.

Table 6.1 shows the results.

time since treatment with beneficial bacteria/daysnumber of toads with fungal infection
group 1group 2
000
2022
4034
60917
801319
1001321

Table 6.1

Calculate the percentage of the 21 toads that have the fungal infection after 100 days in group 1 in Table 6.1.
Give your answer to two significant figures.
.

0 selected