EduNinja

IGCSE Biology Extended19.4.5—Lag, exponential (log), stationaryTopic Practice

19.4.5—Lag, exponential (log), stationary

• Identify the lag, exponential (log), stationary and death phases in the sigmoid curve of population growth for a population growing in an environment with limited resources

Question 3

[Maximum number: 3]

Bacteria are used in many biotechnological processes.

Question 3(c)

(a)

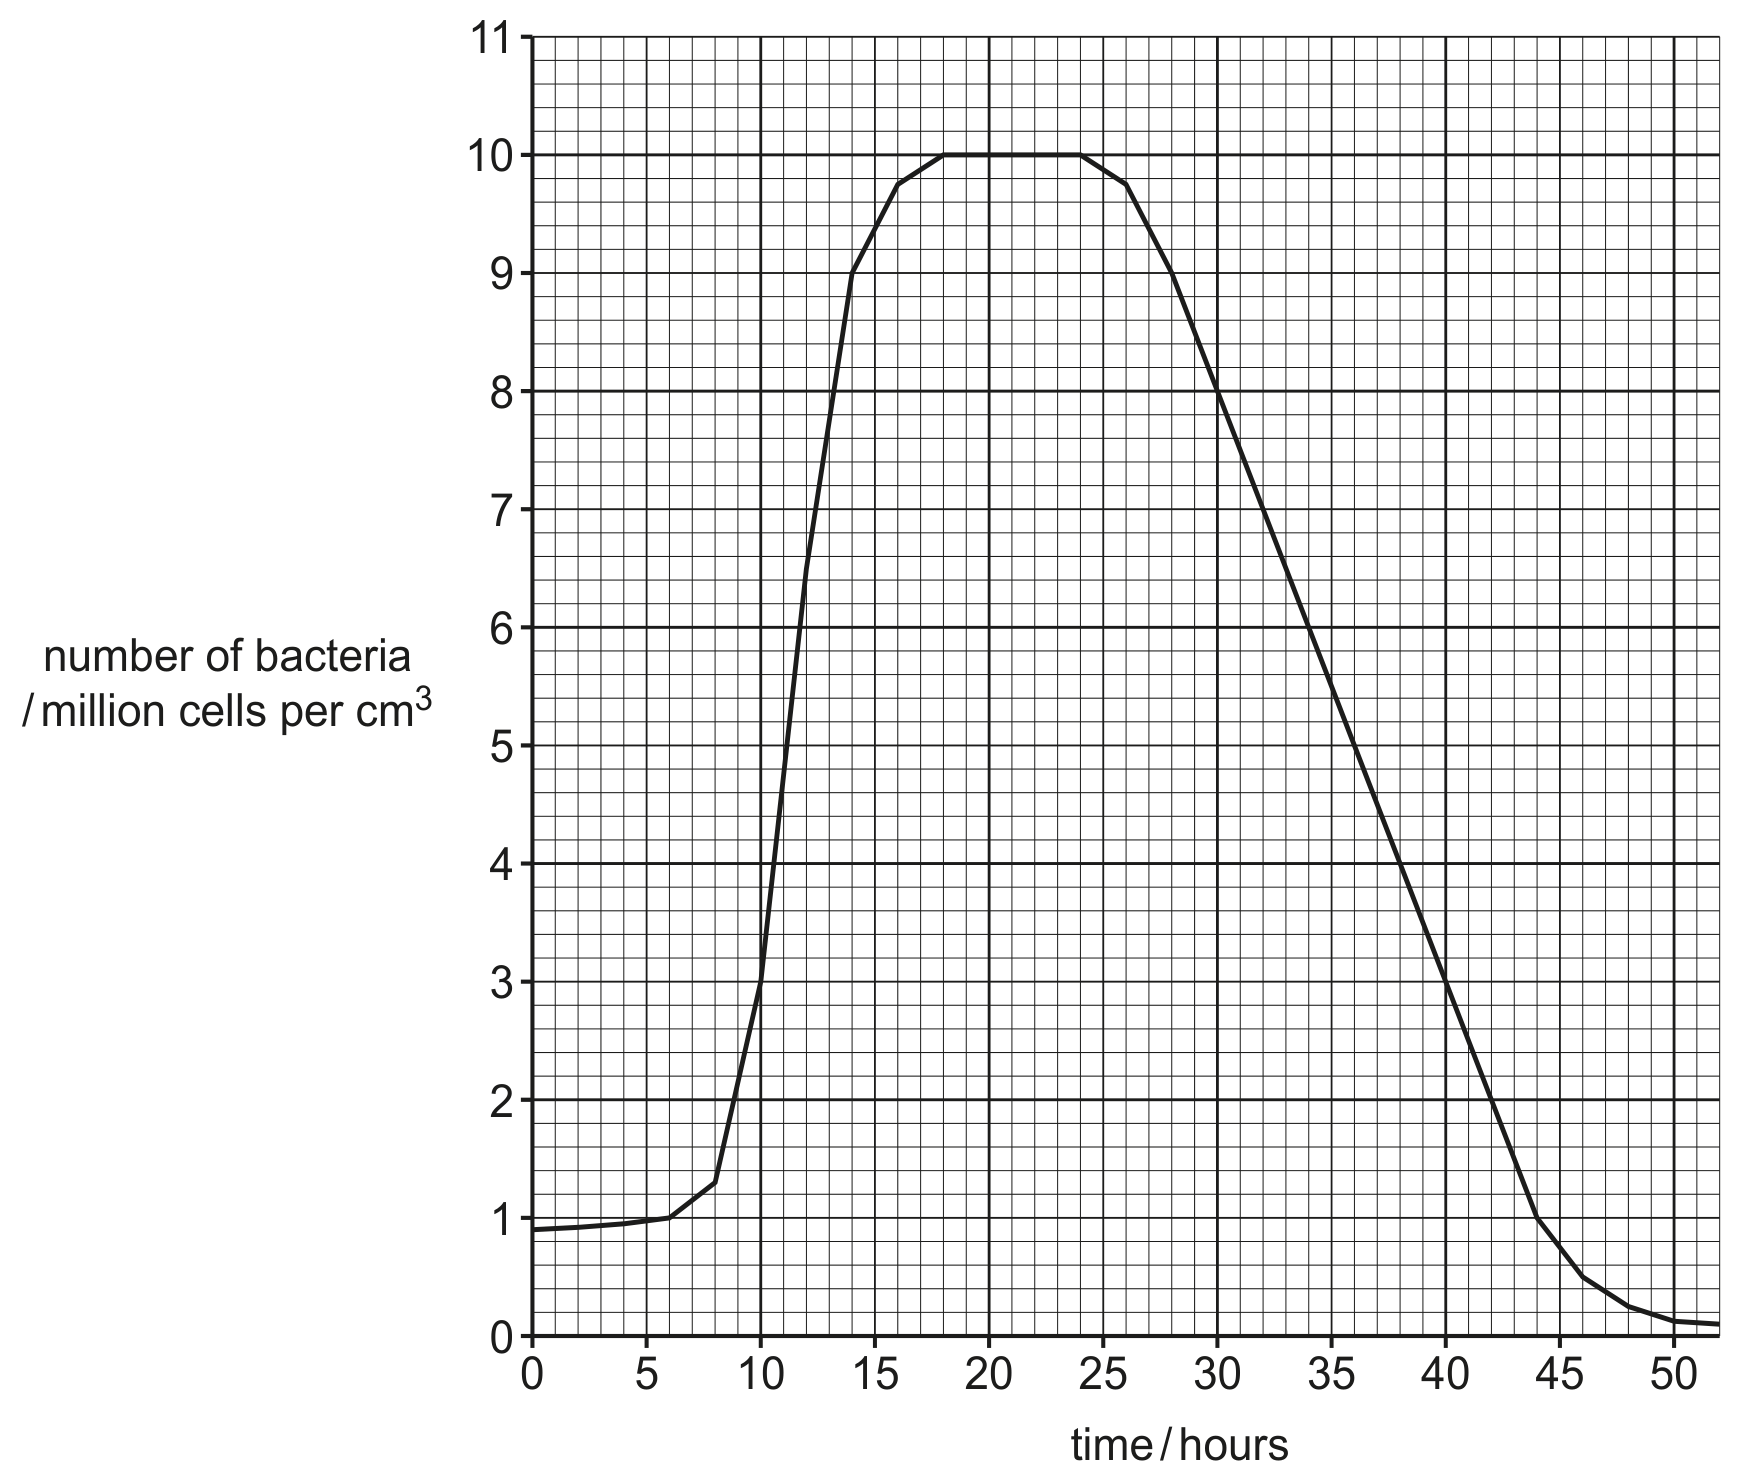
Genetically engineered bacteria that are used to make insulin were grown in a fermenter for five days.

Samples were taken from the fermenter every six hours and the number of bacteria in 1.0 mm31.0 \mathrm{~mm}^{3} of the nutrient solution were counted.

Changes in the numbers of living bacteria in the samples taken from the fermenter are shown in Fig. 3.1.
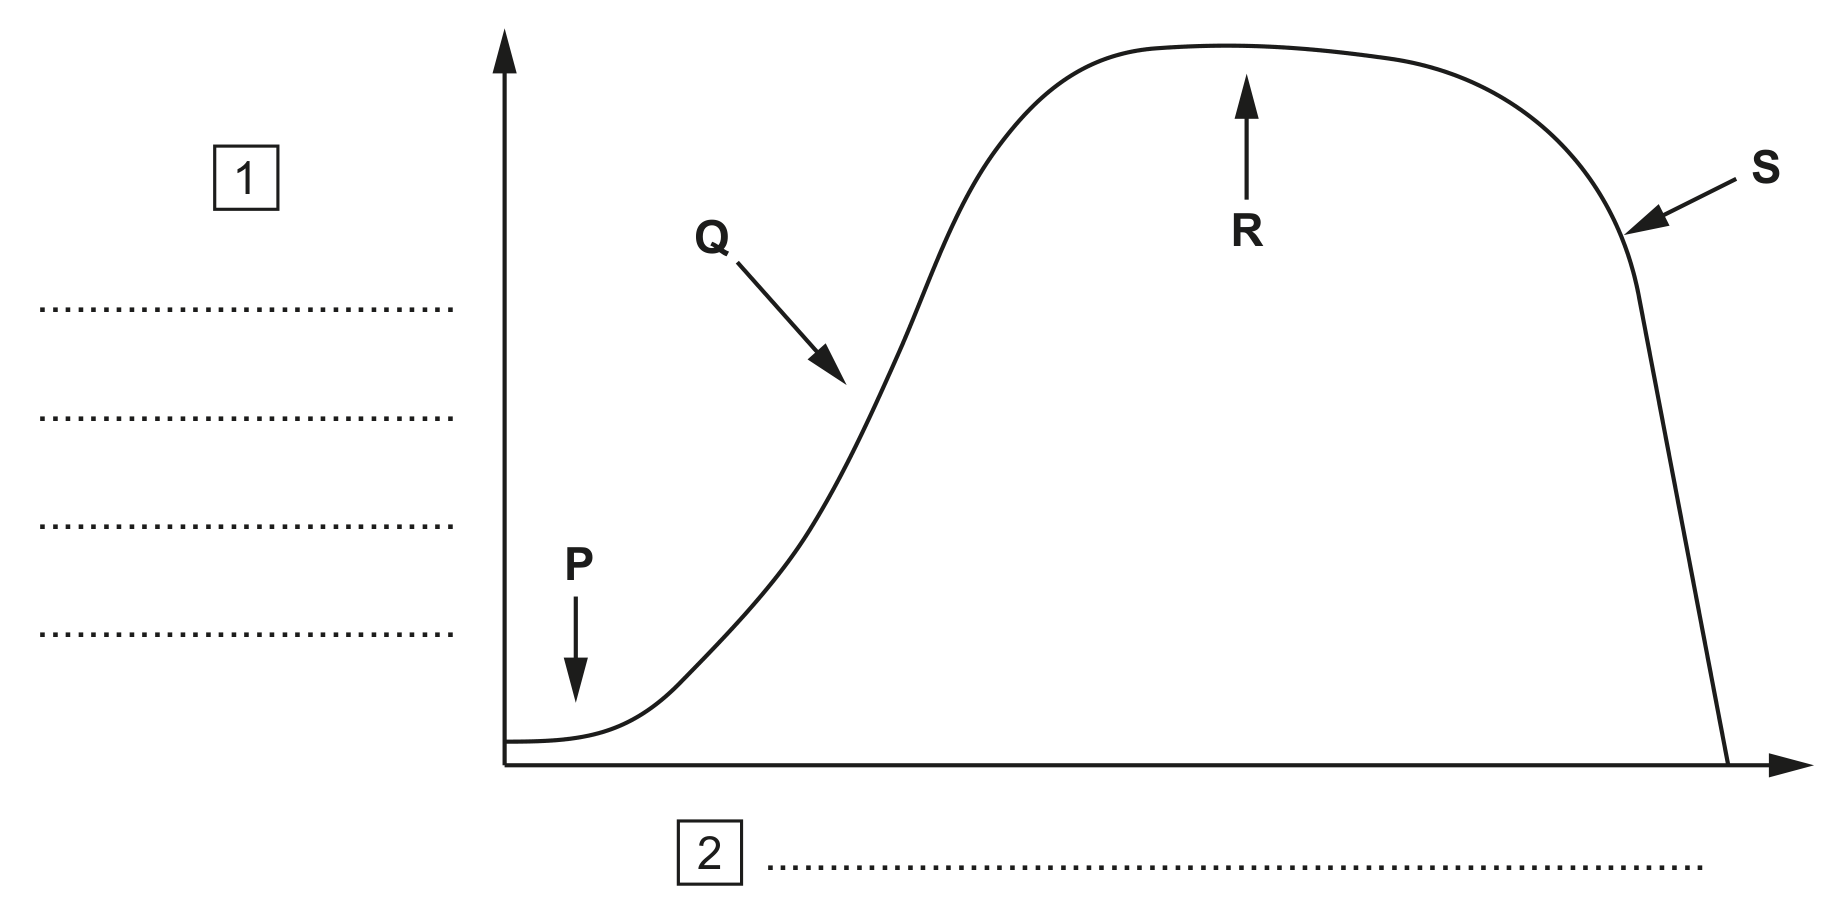
Fig. 3.1

Fig. 3.1

[ 3 ]

Question 3(c)(i)

(i)

Complete Fig. 3.1 by adding labels for the axes at 1 and 2 .

[ 1 ]

Question 3(c)(ii)

(ii)

State the names of the stages of population growth of the bacteria labelled P to S.

P
Q
R
S

[ 2 ]
Question 4(c)(iii)

[Maximum number: 1]

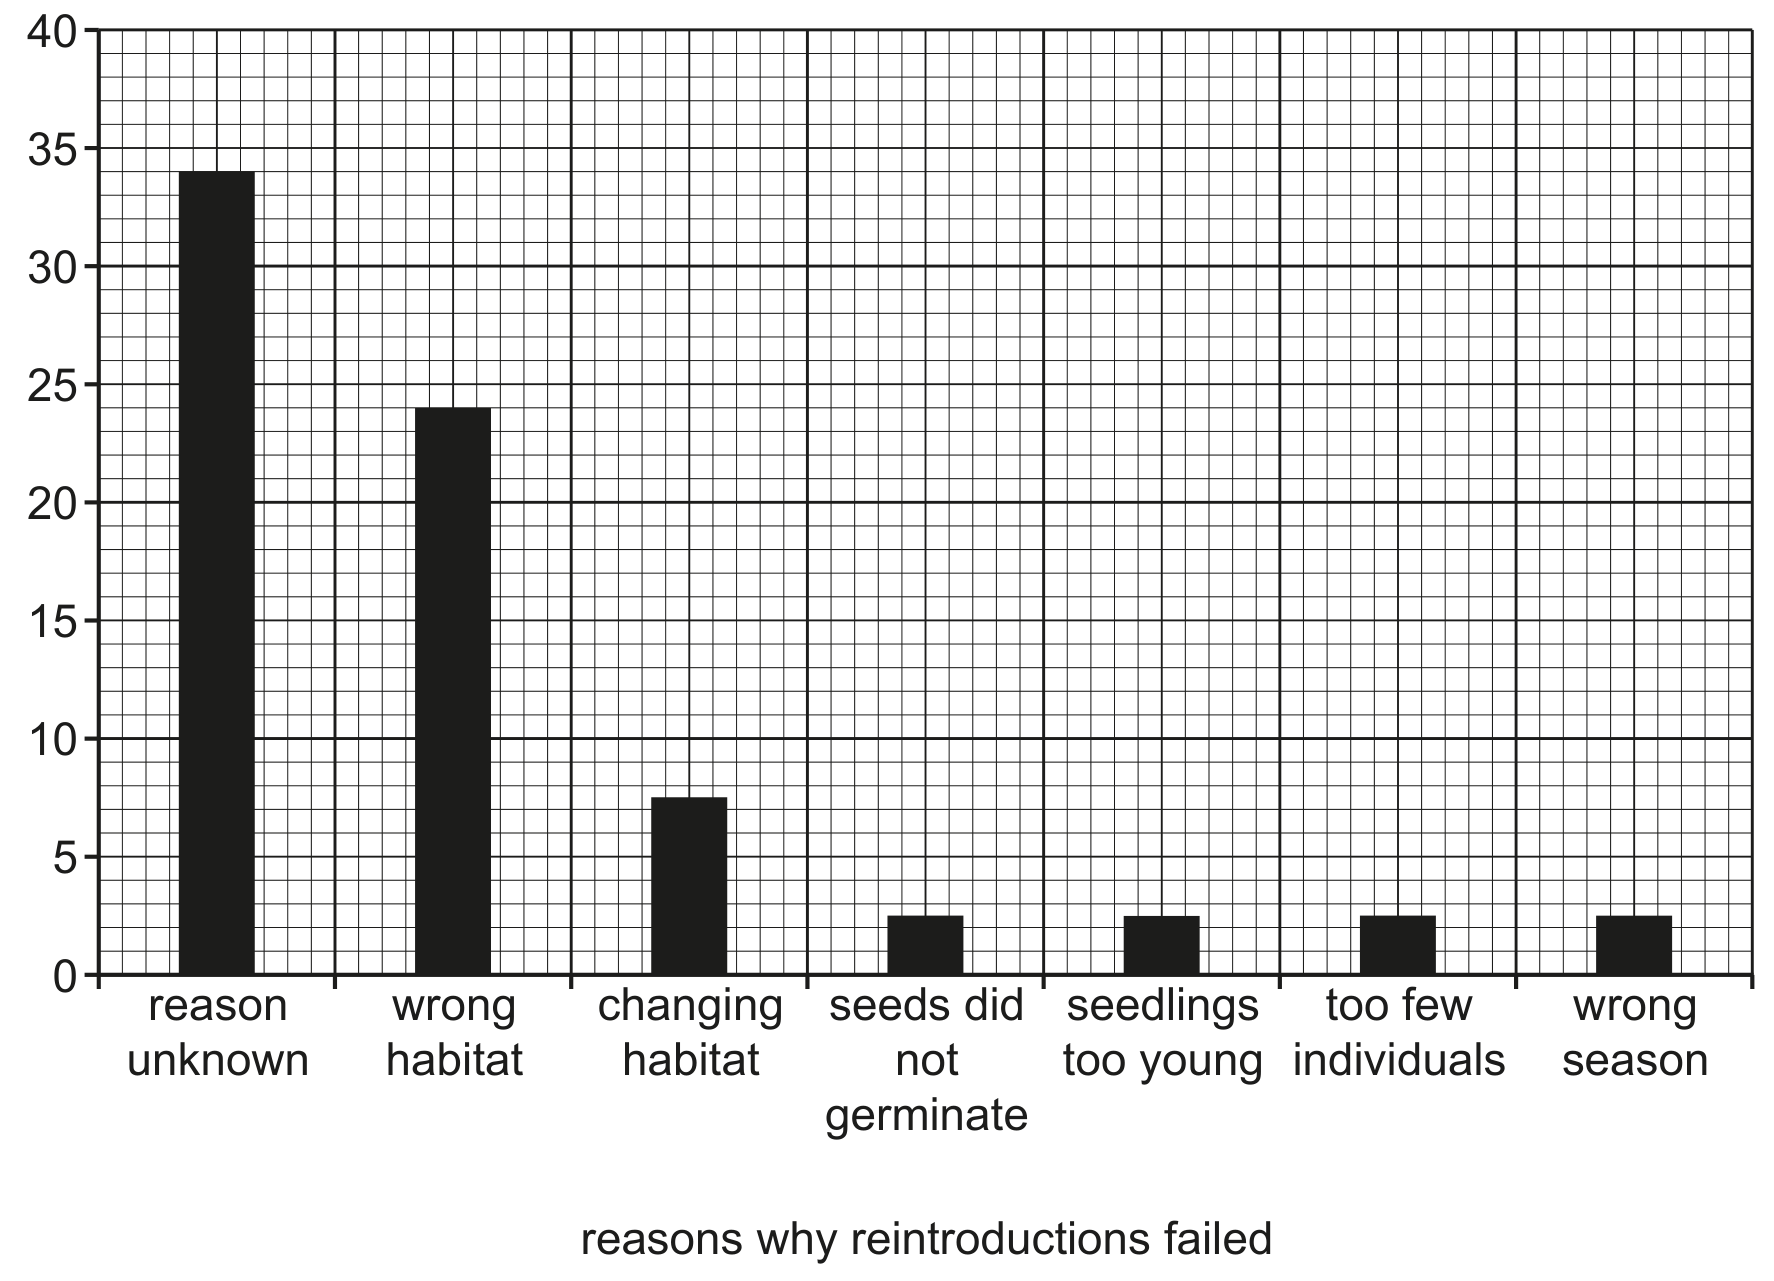
One purpose of seed banks is to reintroduce plant species into their natural environment.

A survey was done to find out why some reintroduction programmes are not successful.
percentage of species that were not successfully reintroduced

Fig. 4.2 shows the results of the survey.

Fig. 4.2 shows the results of the survey.

The low number of individuals also caused some reintroduction programmes to fail.

State the name of the phase in a population growth curve where the number of individuals is very low.

Question 5(a)(i)

[Maximum number: 3]

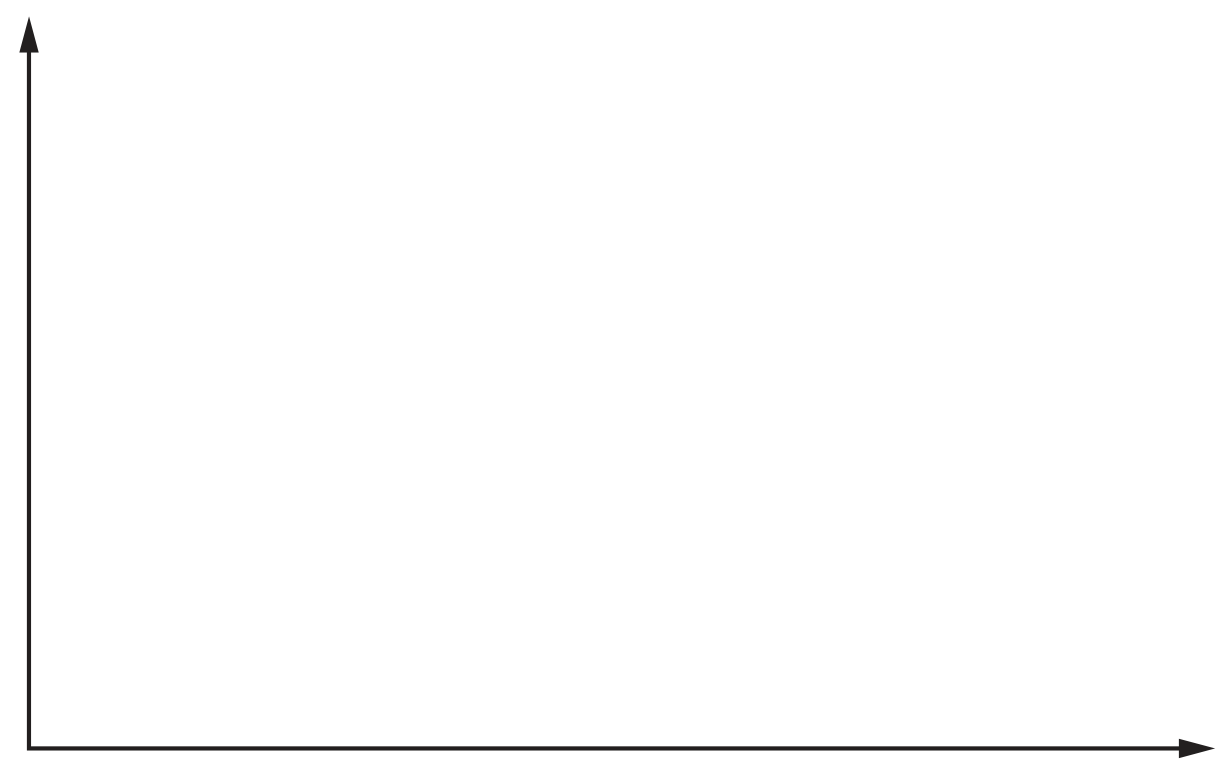
A researcher investigated the population growth of fish for fish farming. The researcher stocked a farmer's lake with a small number of these fish and recorded the number of fish over the next five years. The researcher's results showed that the population of fish had increased exponentially.

Use the axes to show the exponential growth in the population of fish.

Label the axes and draw a suitable curve.

Question image

Question 5(c)(ii)

[Maximum number: 1]

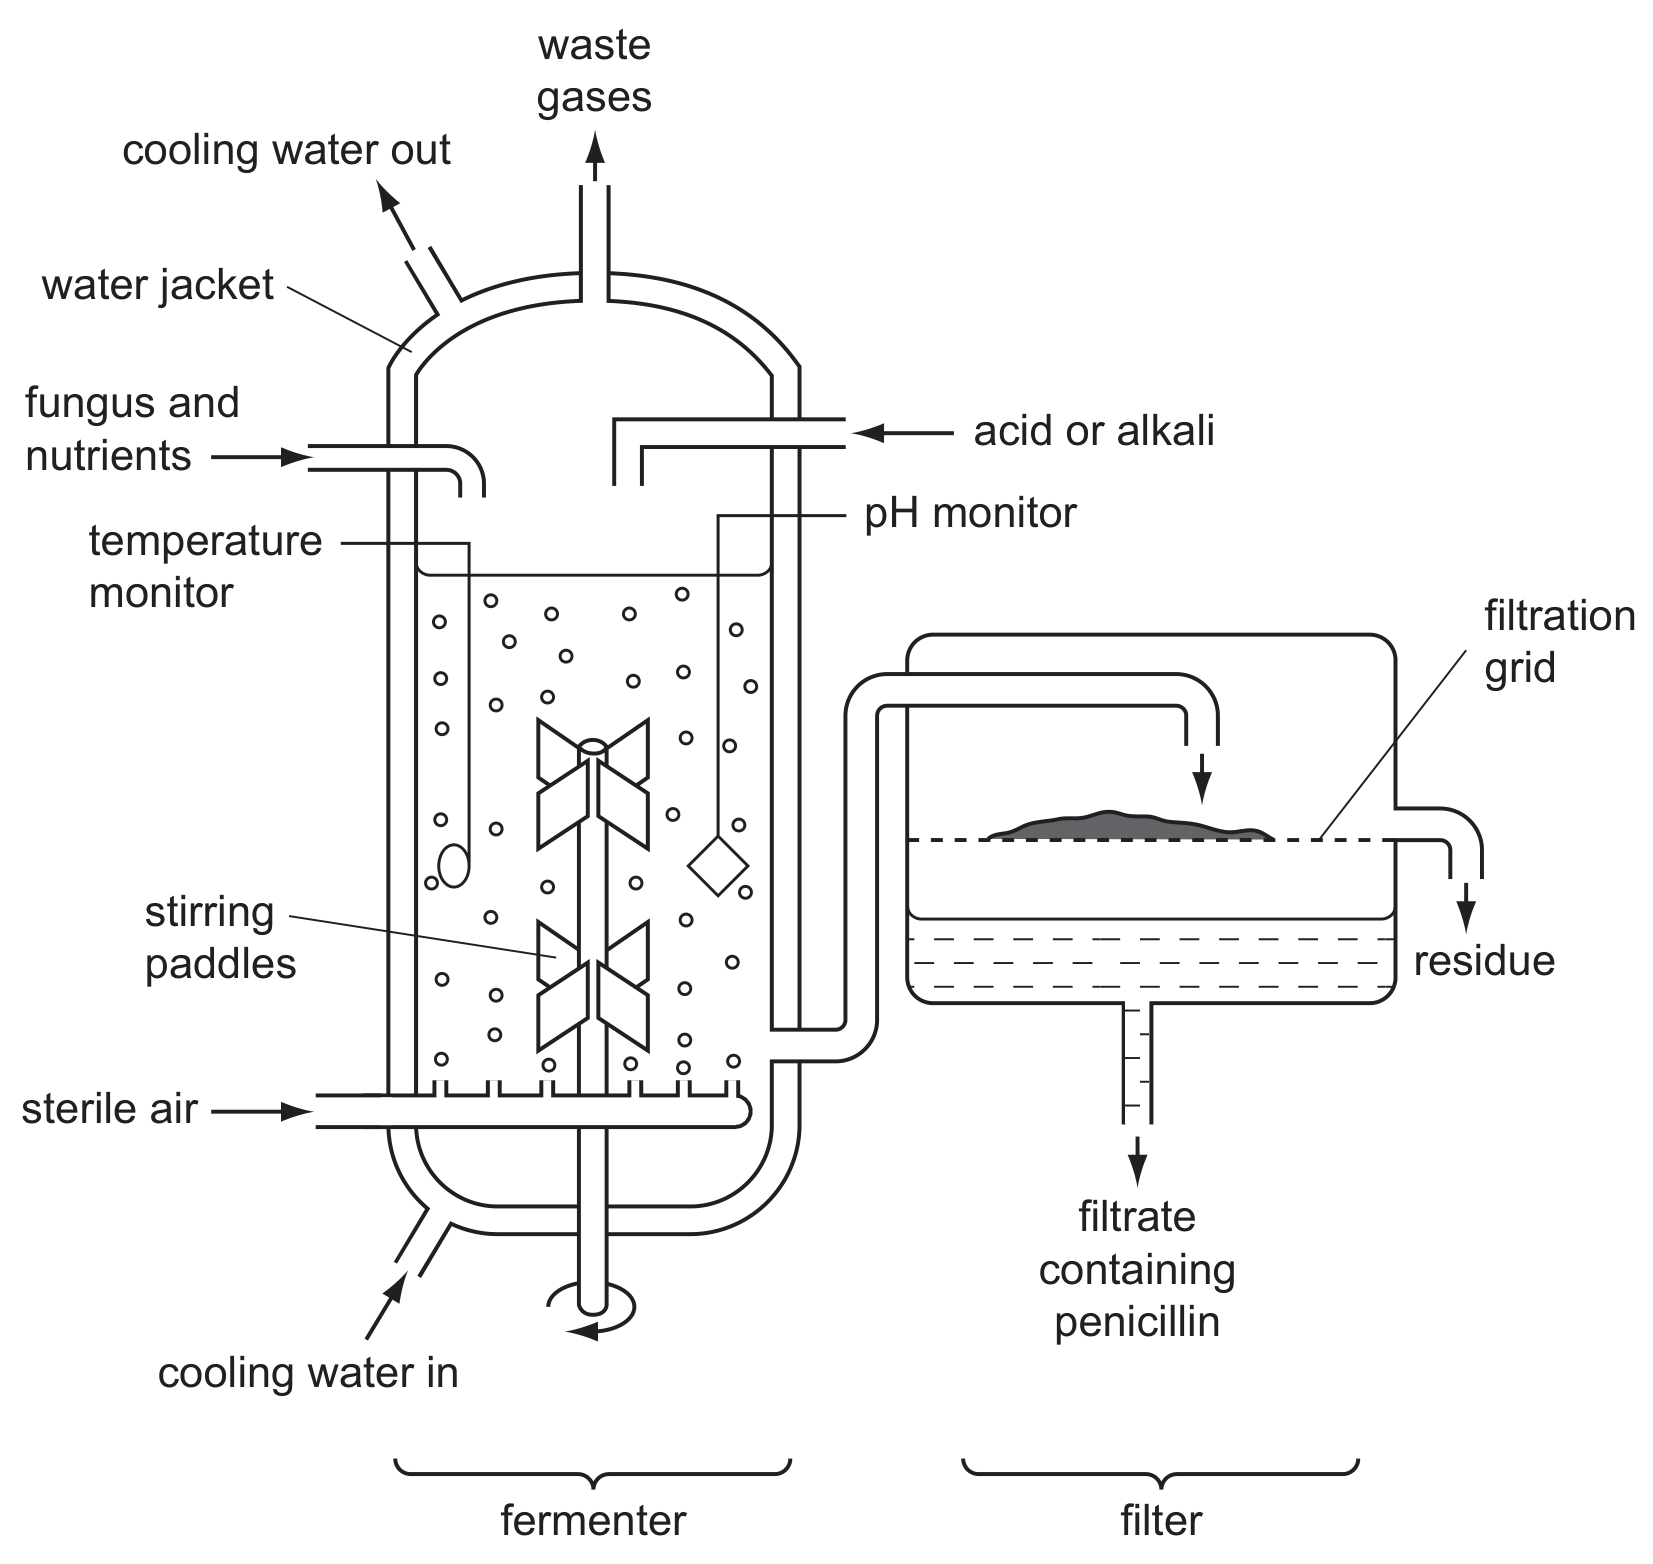
Penicillin is an antibiotic produced by the fungus Penicillium chrysogenum.

Fig. 5.1 shows the process used to produce penicillin.

Fig. 5.1 shows the process used to produce penicillin.

Penicillin is not needed for the growth of P. chrysogenum.

The people in charge of the penicillin production emptied the fermenter after 160 hours. Use the information in Fig. 5.2 to suggest why they did not allow the fermentation to continue for longer.

Question 5

Question 5(c)

(a)

Genetically modified bacteria were grown in a fermenter. The number of bacteria was measured, and the data are shown in Fig. 5.1.

Fig. 5.1

Fig. 5.1

[ 2 ]

Question 5(c)(i)

(i)

On Fig. 5.1, draw an X to identify the lag phase.

[ 1 ]

Question 5(c)(ii)

(ii)

On Fig. 5.1, draw a Y to show where the birth rate is equal to the death rate.

[ 1 ]

Question 34

[Maximum number: 1]

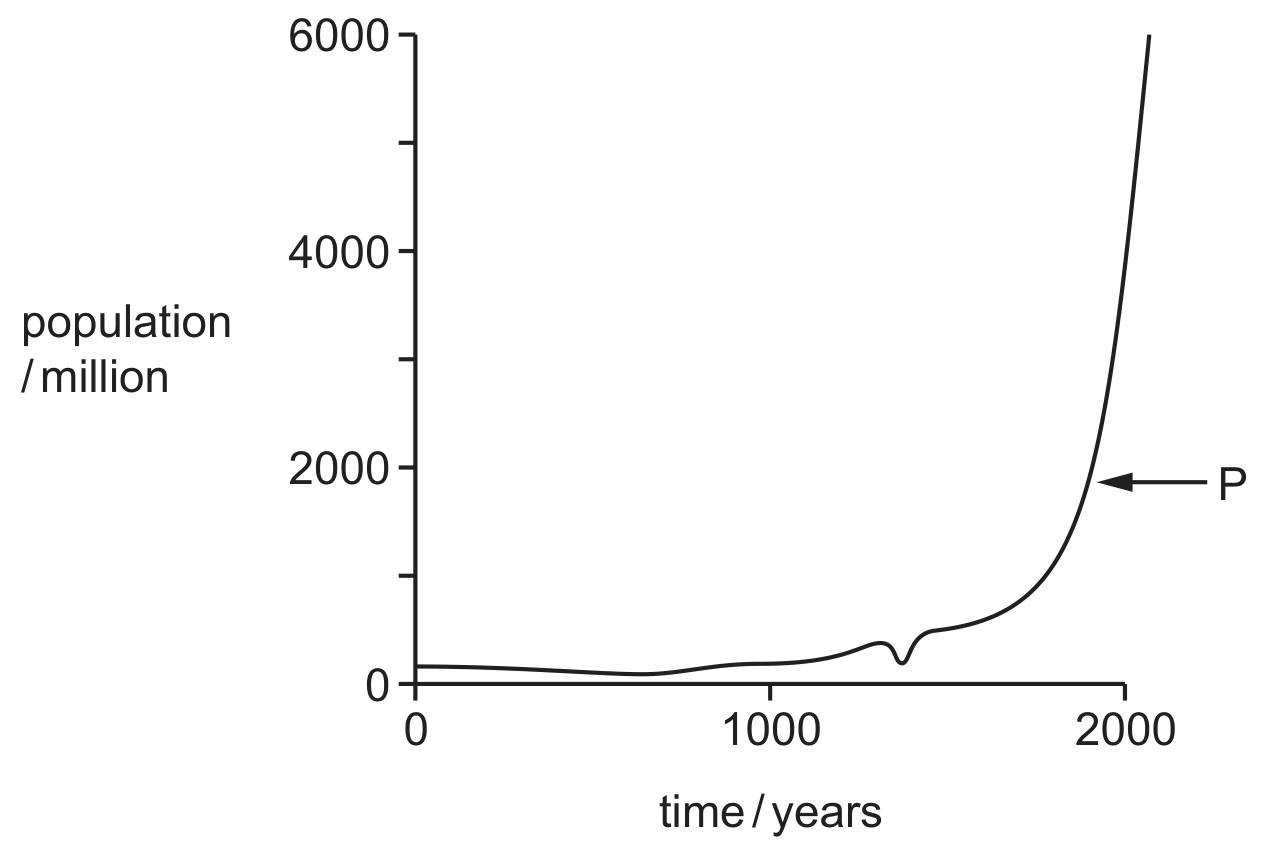
The graph shows the human population of the world for the last 2000 years.

Question image

What is the phase identified by P ?

A

death

B

exponential (log)

C

lag

D

stationary

Question 34

[Maximum number: 1]

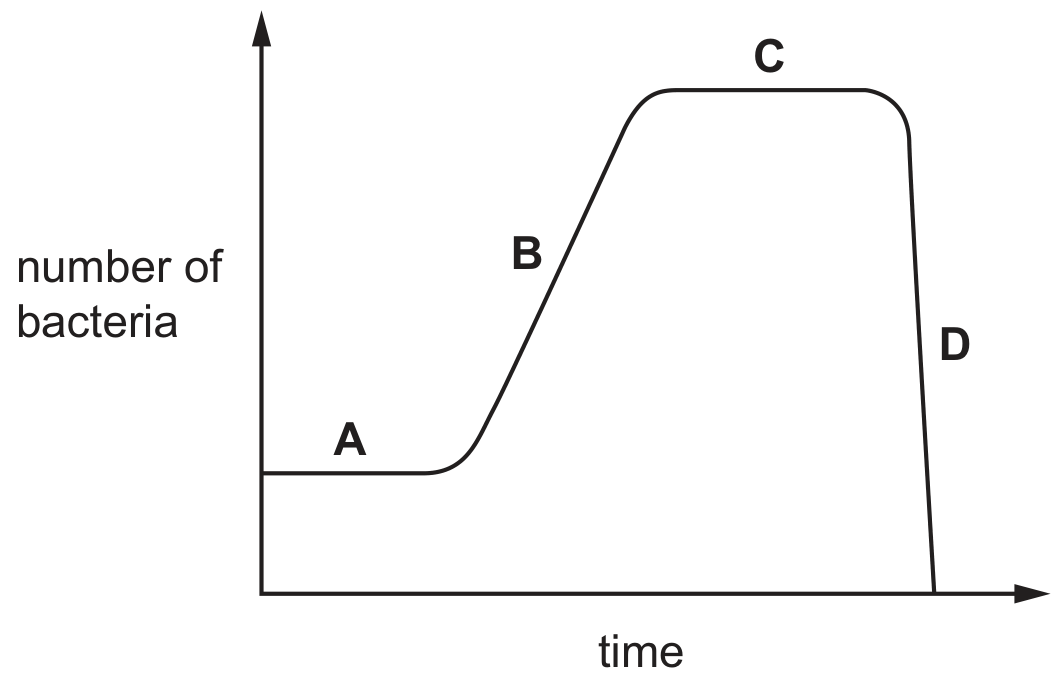
The graph shows the growth of a bacterial population.
Which section represents the exponential (log) phase?

Question image

Question 36

[Maximum number: 1]

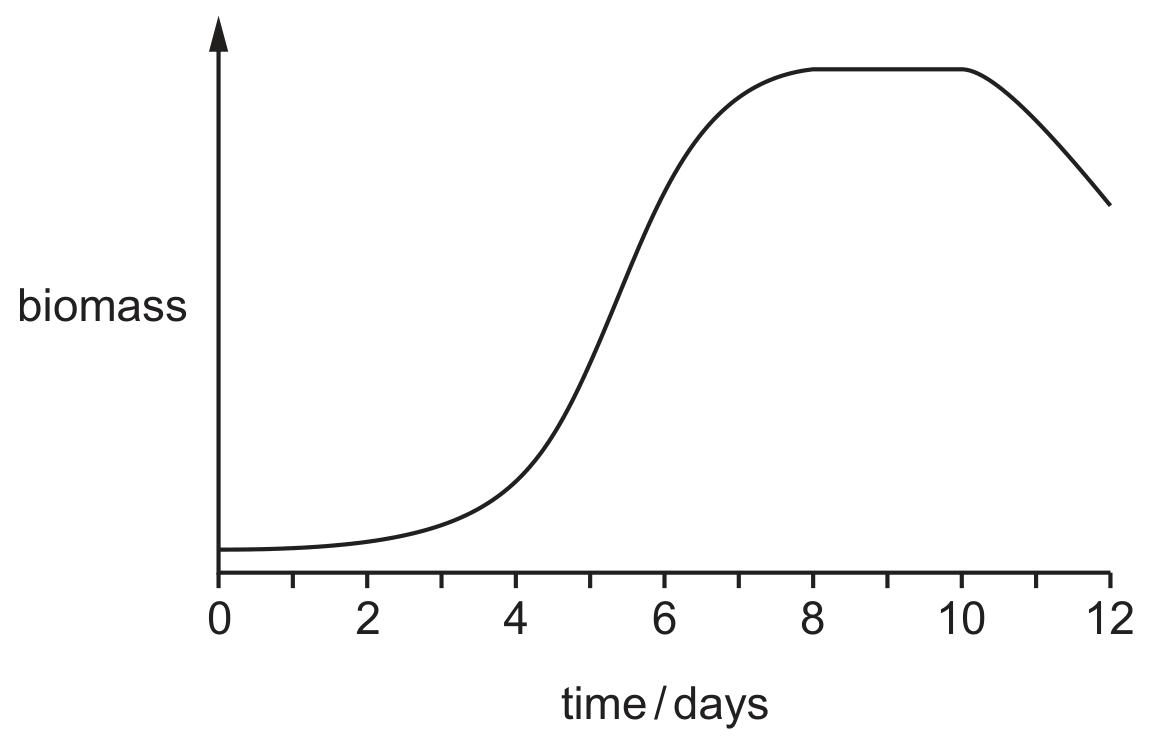
The graph shows the growth of a yeast population.

Question image

When was the rate at which cells were dying equal to the rate at which new cells were being formed?

A

day 3

B

day 5

C

day 9

D

day 11

Question 36

[Maximum number: 1]

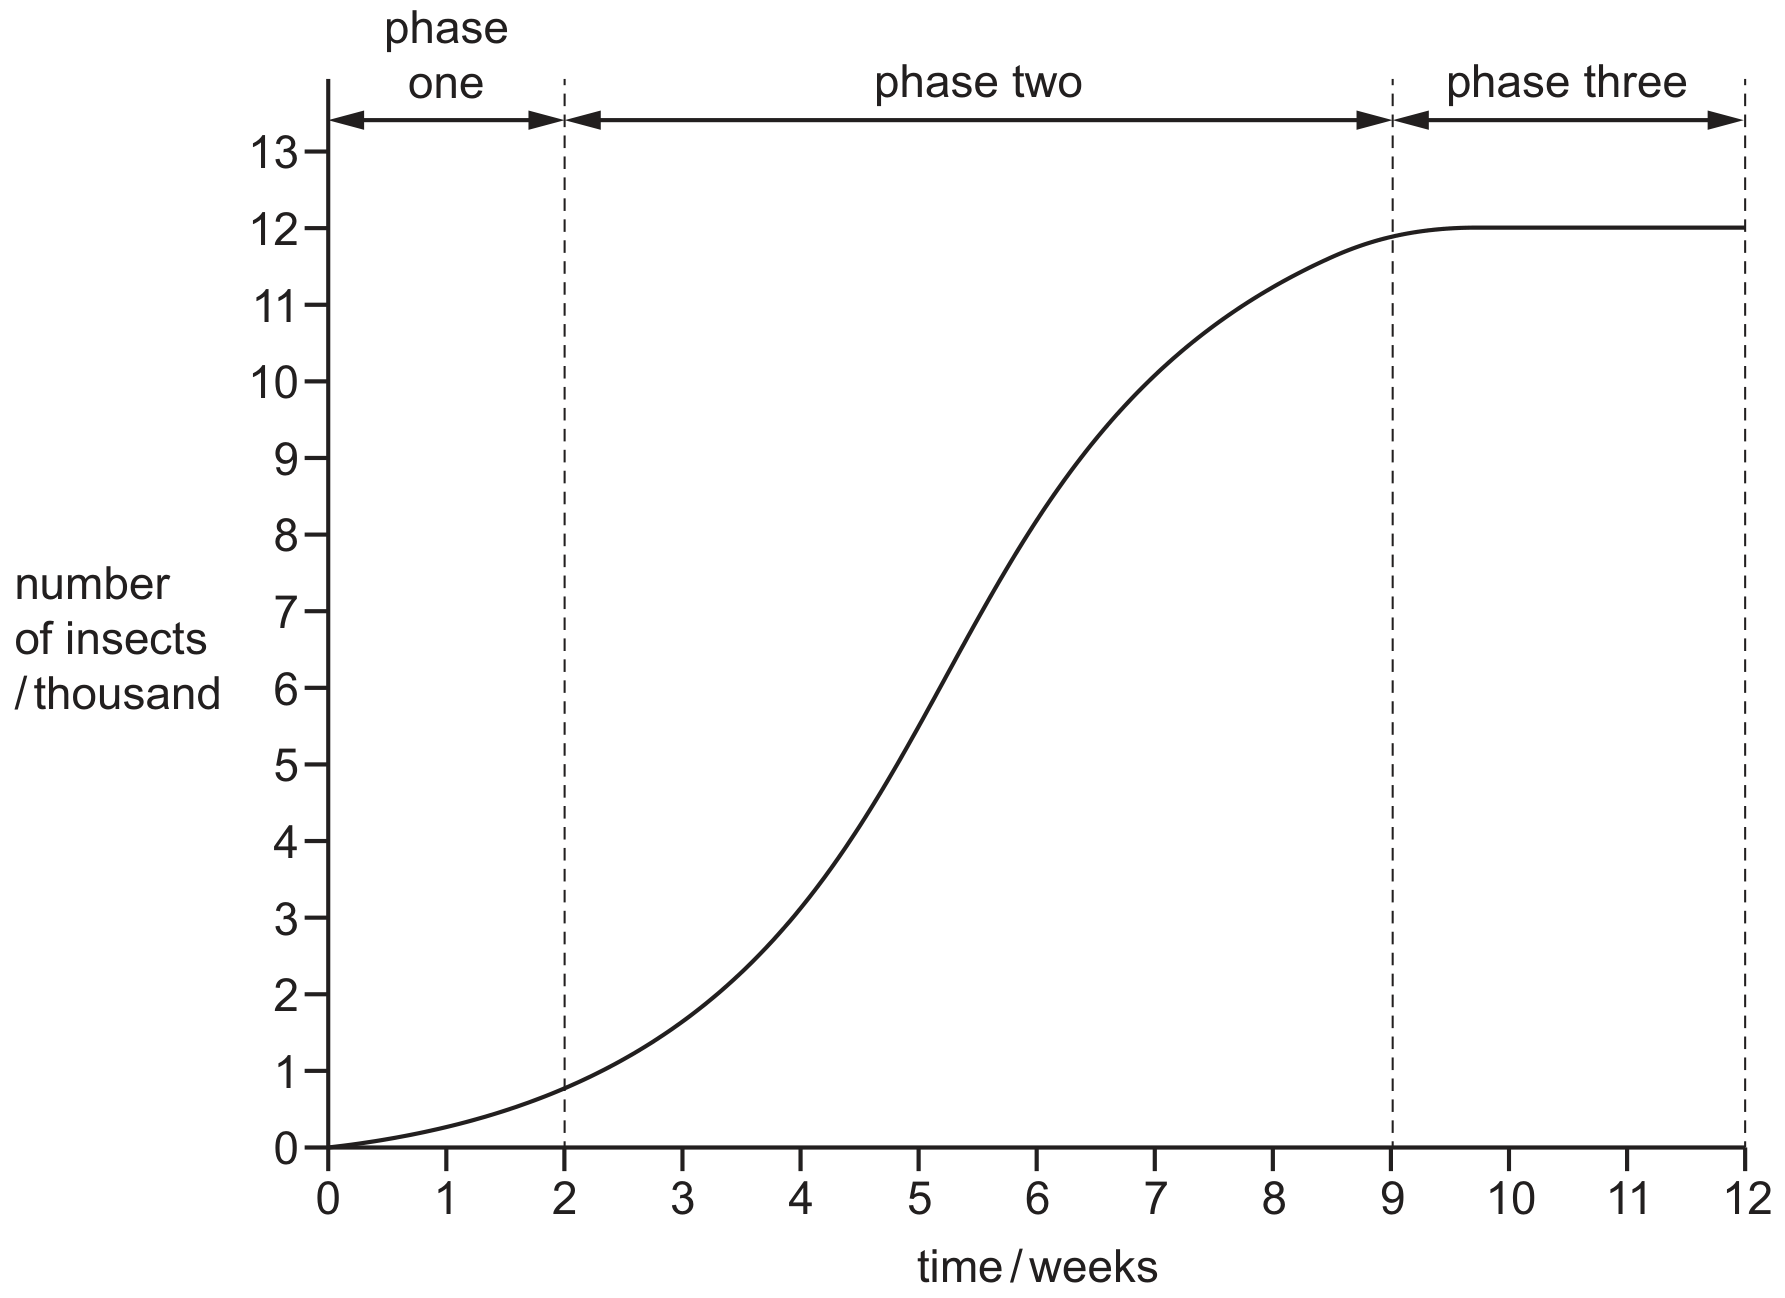
A student was given data on the change in the number of insects in a population over a period of twelve weeks. The student was asked to name and label each phase.

Question image

What is the correct label for phase three?

A

death phase

B

exponential (log) phase

C

lag phase

D

stationary phase

Question 36

[Maximum number: 1]

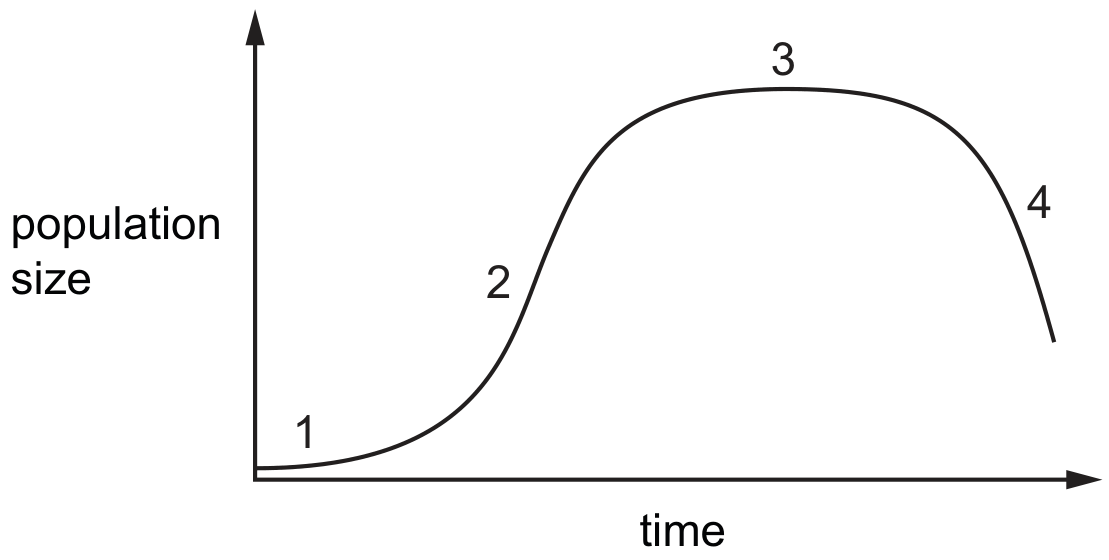
A few yeast cells were placed in a container of nutrient solution.
The graph shows how their population size changed over time.

Question image

Which row shows when the reproduction rate was greater than the death rate for the numbered phases on the graph?

1

2

3

4

χ\boldsymbol{\chi}

χ\boldsymbol{\chi}

×\boldsymbol{\times}

×

χ\boldsymbol{\chi}

χ\boldsymbol{\chi}

×\boldsymbol{\times}

0 selected