EduNinja

A-Level CAIE Biology A218.2 BiodiversityQuestion Bank

Question 1

[Maximum number: 2]

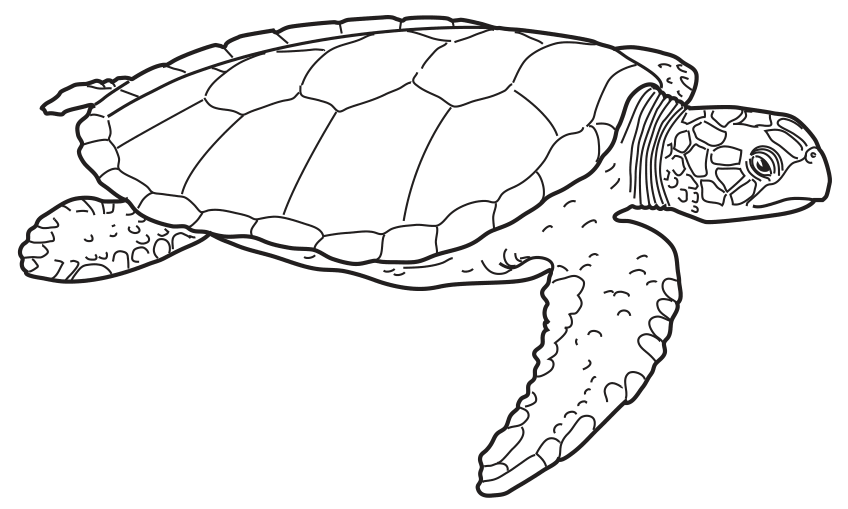
The natterjack toad, Bufo calamita, is an endangered amphibian species in the UK. It comes out of hibernation in April and breeds in pools by sand dunes along parts of the UK coast. A young natterjack toad will take about 10 weeks to develop from a fertilised egg. A natterjack toad feeds at night, by running at its prey, mainly insects and worms, on the sand dunes.

Fig. 1.1 shows a natterjack toad.
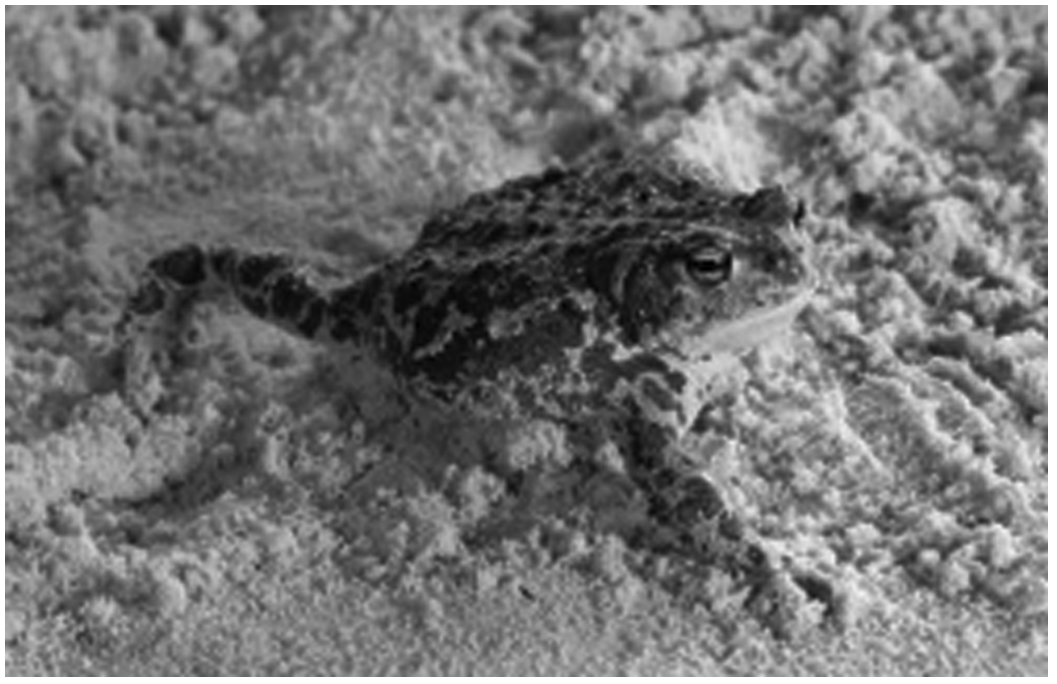
Fig. 1.1

Fig. 1.1

Question 1(b)

(a)

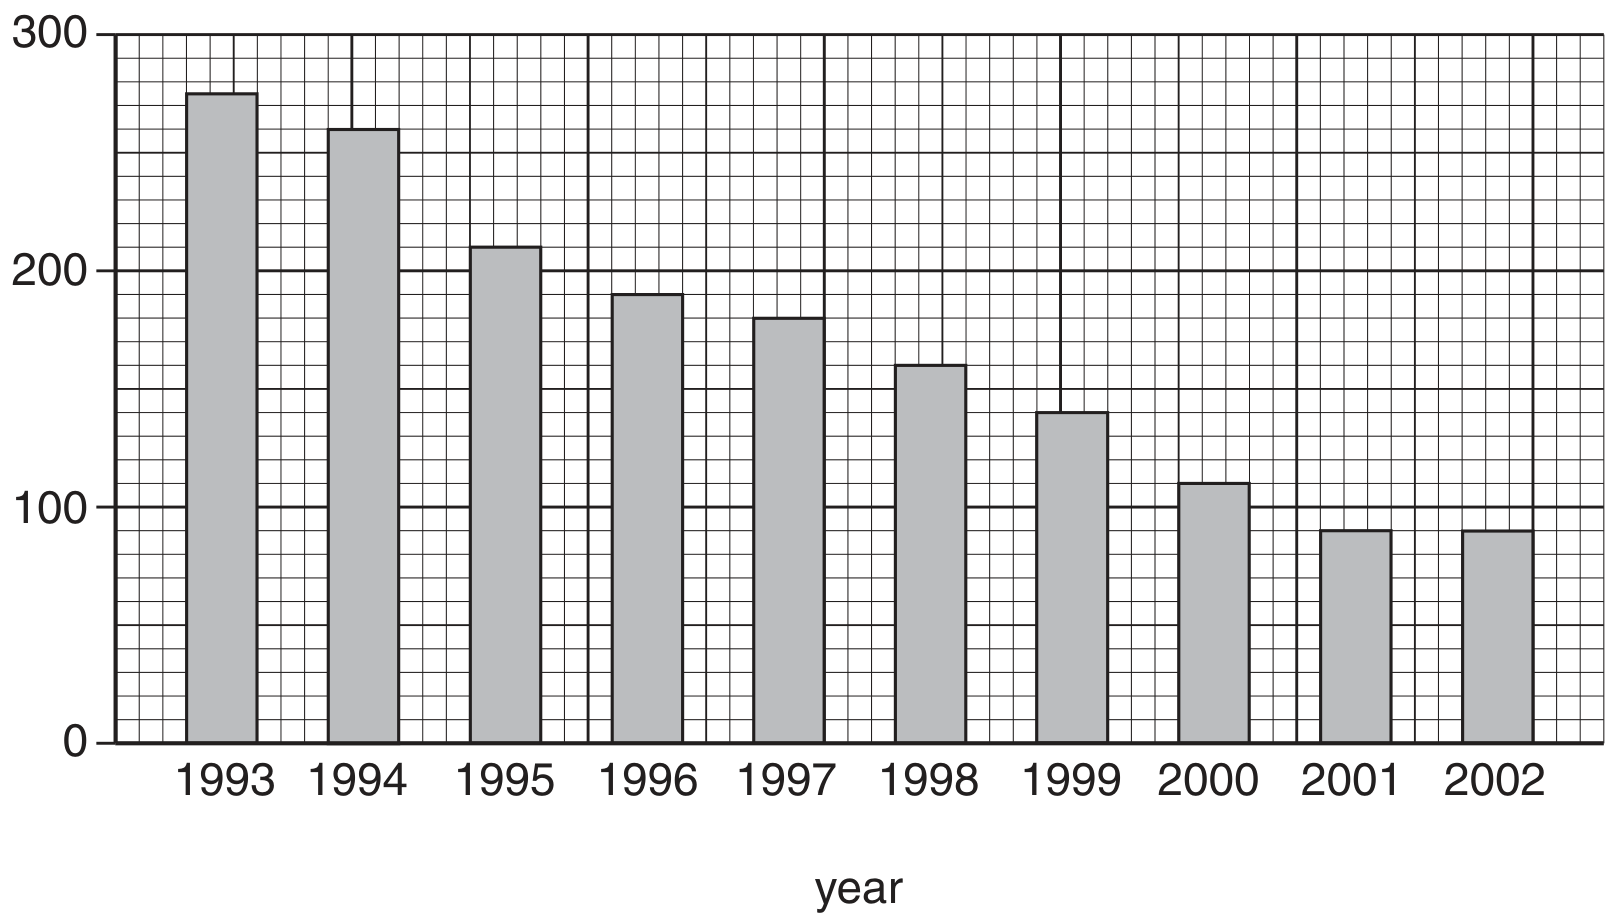
Fig. 1.2 shows the number of adult natterjack toads counted from 1989 to 1997 in one area of the UK.
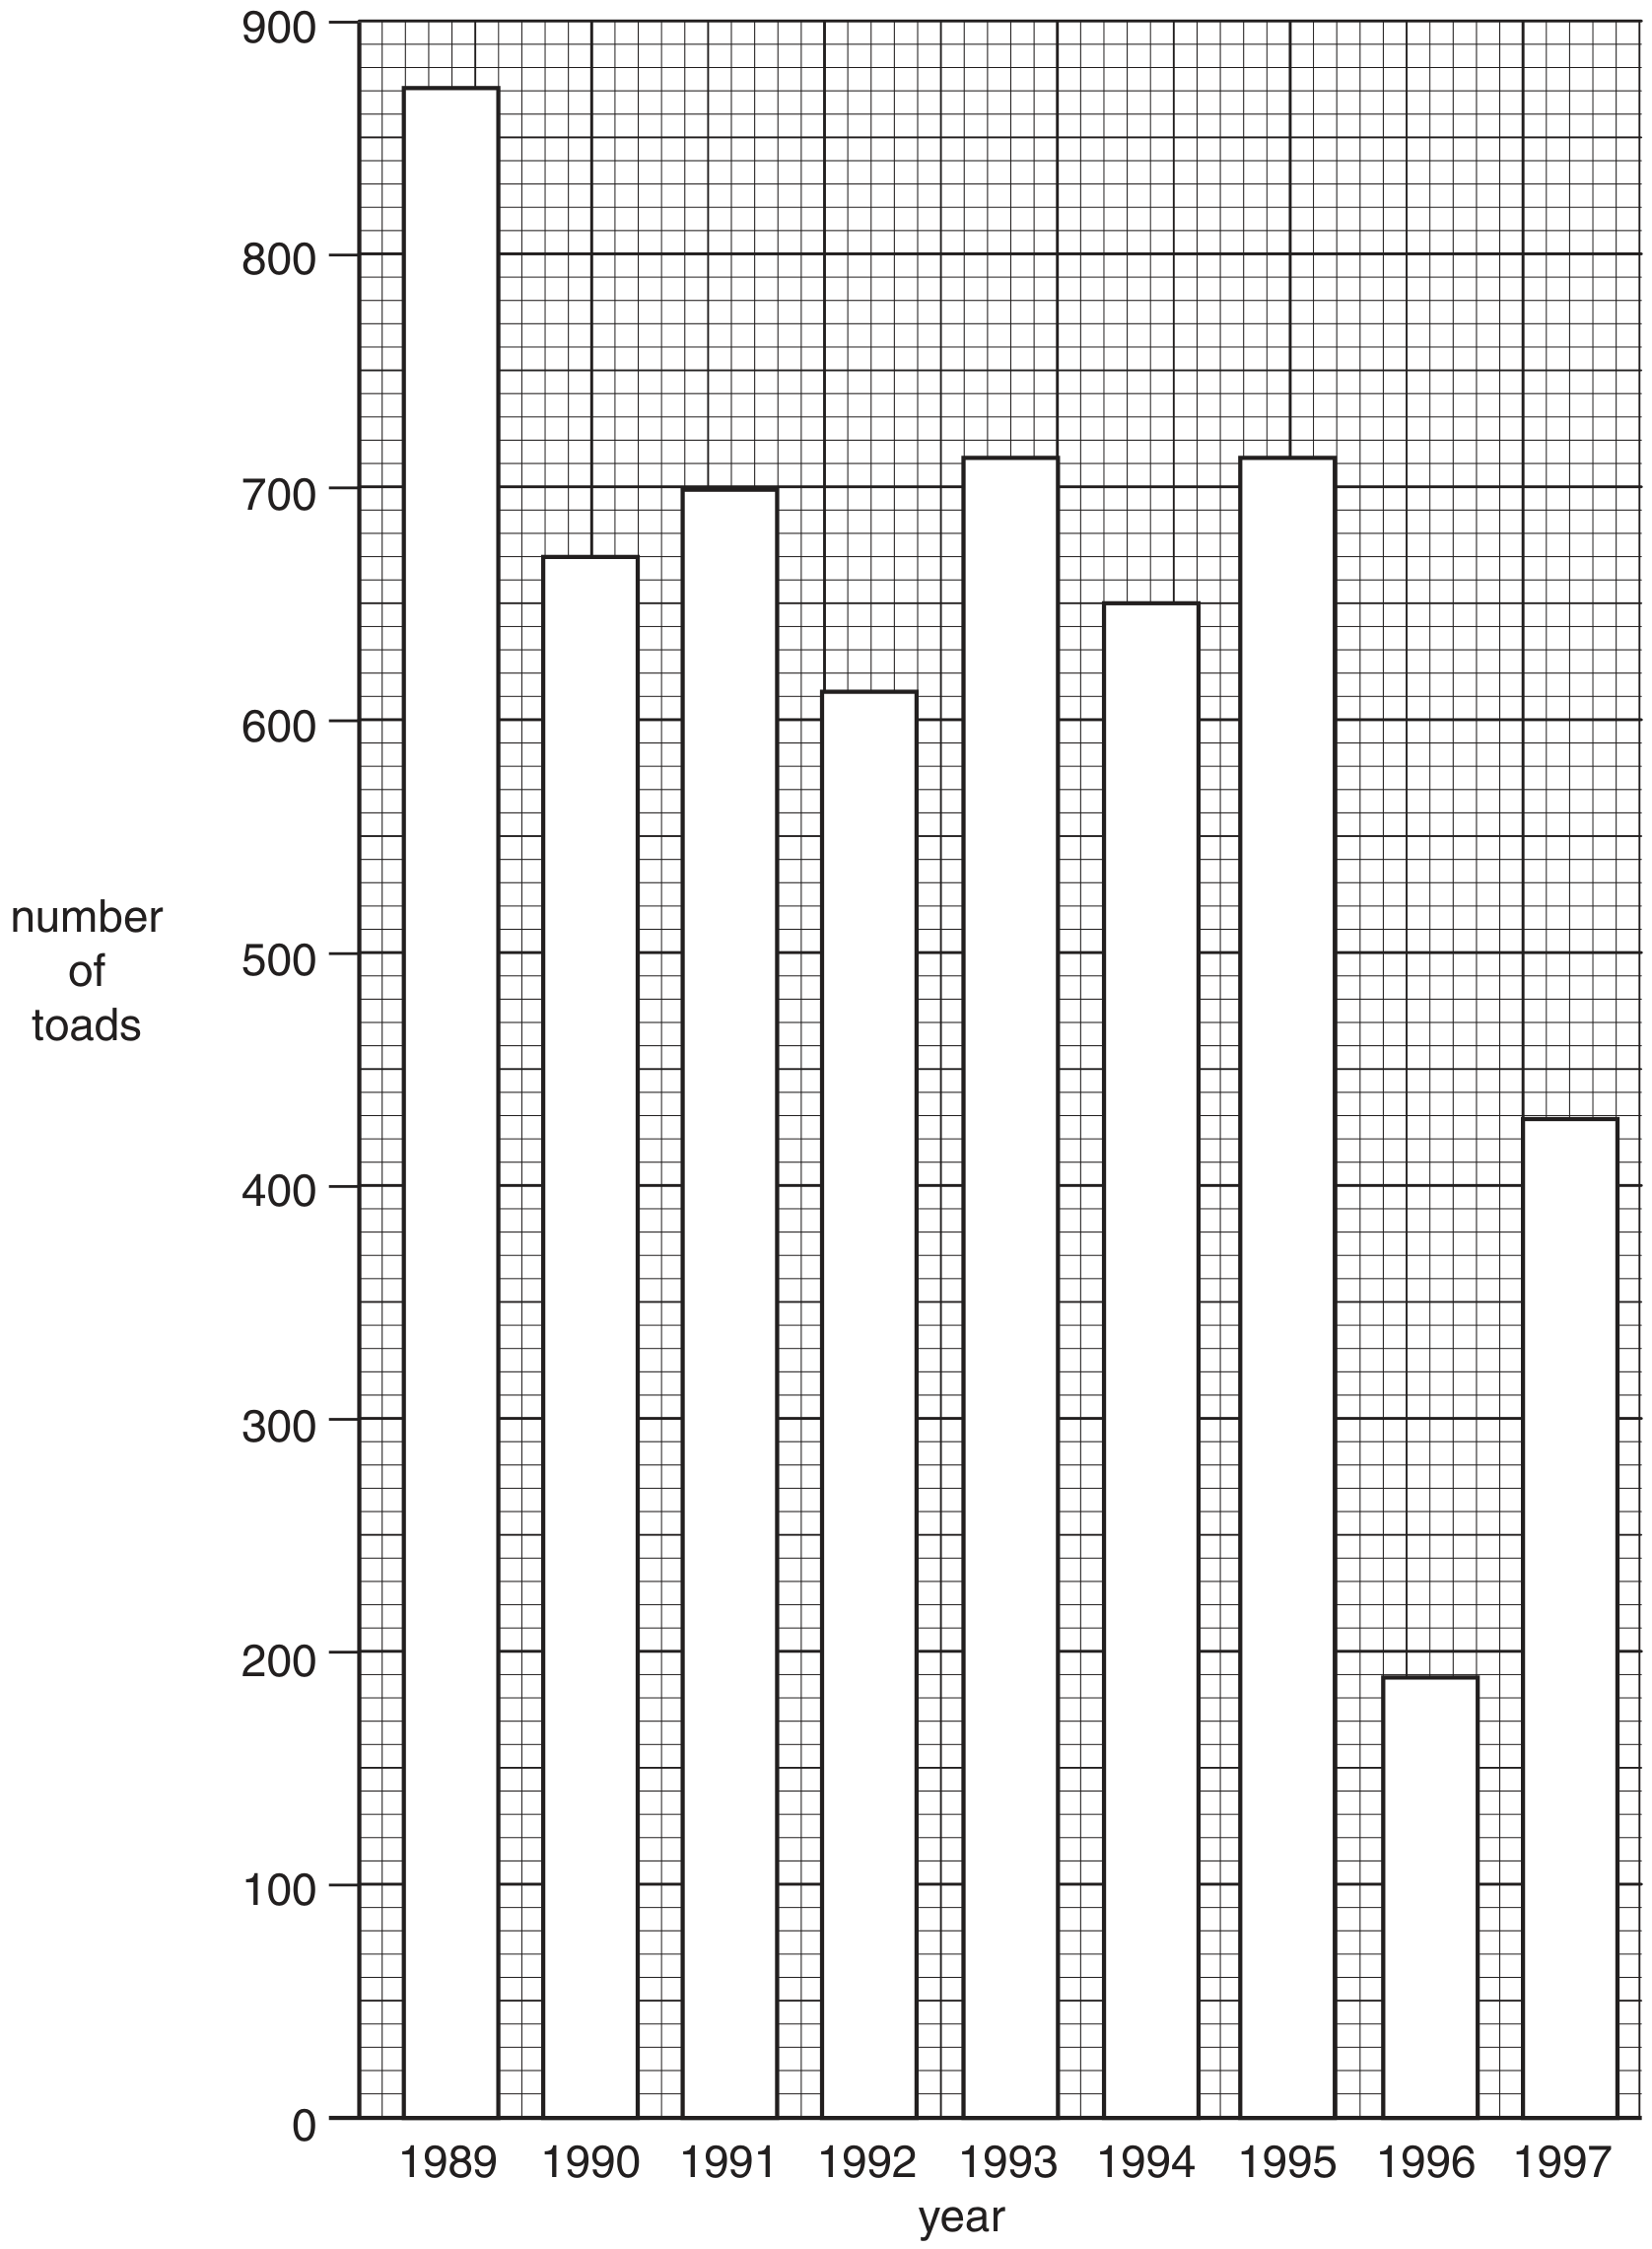
Fig. 1.2

Fig. 1.2

Calculate the mean annual number of adult natterjack toads counted from 1989 to 1997.

Give your answer to the nearest whole number.
Show your working.

[ 2 ]

Question 1

[Maximum number: 2]

The flatback turtle, Natator depressus, is an endangered species that nests on northern Australian beaches.

Fig. 1.1 shows a flatback turtle.

Fig. 1.1

Fig. 1.1

Each female lays approximately 50 eggs per nest, which is a smaller number than all other species of marine turtle. The eggs are buried in the sand and when the hatchlings emerge each has a mass of approximately 43 g . Unlike most marine turtles, flatback turtles spend most of their time in coastal waters. This is where they feed and mate.

Fig. 1.2 shows the numbers of female flatback turtles nesting on a beach in northern Australia between 1993 and 2002.
number of female turtles nesting

Fig. 1.2

Fig. 1.2

Question 1(a)

(a)

Calculate the mean rate of decrease in the numbers of females nesting between 1993 and 2002.

Show all the steps in your calculation.

\author{
Answer
}

[ 2 ]

Question 1

[Maximum number: 1]

Fig. 1.1 shows a snow leopard, Panthera uncia. The habitat of the snow leopard is the high mountains of Central Asia.

Fig. 1.1

Fig. 1.1

Snow leopards usually live and hunt alone. Their main prey is grazing herbivores, such as wild sheep and wild goats. They will also hunt domesticated animals and livestock.

The number of snow leopards has decreased dramatically in the last 40 years.

Question 1(a)

Question 1(a)(ii)

(a)
(i)

In 2003, the total number of snow leopards was estimated to be between 4080 and 6590 .

Suggest one reason why the actual number of snow leopards in 2003 may have been higher than the estimated number.

[ 1 ]

Question 1

[Maximum number: 5]

The American crocodile, Crocodylus acutus, was classified as an endangered species by the USA in 1975. It is found in estuarine regions of southern Florida.

Fig. 1.1 shows an American crocodile.

Fig. 1.1

Fig. 1.1

The salinity of the water was thought to play a part in the distribution of the American crocodile.

Fig. 1.2 shows the number of American crocodile nest sites in areas with water of varying salinity in southern Florida.

Fig. 1.2

Fig. 1.2

Question 1(a)

(a)

Describe the results shown in Fig. 1.2.

[ 3 ]

Question 1(b)

(b)

Much conservation work has been done in the Everglades National Park in Florida, which is a large wetland area. As a result the number of nest sites has increased from 8 in 1975 to 31 in 2000. This has led to a rise in the number of crocodiles.

[ 2 ]

Question 1(b)(i)

(i)

Calculate the percentage increase in nest sites between 1975 and 2000.

Show your working.
answer \%

[ 2 ]

Question 1

[Maximum number: 4]

The Great Lakes, in North America, lie between the USA and Canada. A survey of birds of the Lake Ontario area has shown the relative abundance of birds between 1995 and 2005.

Table 1.1 shows the feeding habits and the relative change in numbers of some of the birds in the survey.

Table 1.1

Table 1.1

Question 1(a)

(a)

Using the information in Table 1.1 suggest reasons for the changes in numbers of these birds.

[ 4 ]

Question 1

Question 1(b)

(a)

Explain what is meant by the term biodiversity.

[ 3 ]

Question 1

[Maximum number: 2]

The Bengal Tiger, Panthera tigris tigris, is an endangered mammalian species of Southern Asia. It lives mostly in a forest habitat.

Fig.1.1 shows a Bengal Tiger.

Fig. 1.1

Fig. 1.1

Question 1(a)

(a)

Table 1.1 shows the relationship between available forest habitat and Bengal Tiger numbers between 1970 and 2010.

Table 1.1

Table 1.1

Calculate the percentage decrease in the number of Bengal Tigers between 1970 and 2010.

Give your answer to the nearest whole number.
answer \%

[ 2 ]

Question 1

[Maximum number: 2]

Corals are simple marine animals and usually exist in colonies of thousands of individuals.
Fig. 1.1 shows a coral colony.

Fig. 1.1

Fig. 1.1

Corals absorb calcium carbonate from the sea to build their skeletons, which help to form large coral reefs. Coral reefs provide a home for about 25 % of known fish species and have the highest biodiversity of any marine ecosystem.

Question 1(b)

(a)

Outline what is meant by the term ecosystem.

[ 2 ]

Question 1

[Maximum number: 2]

Fig. 1.1 is a summary of energy flow in a forest ecosystem. The width of the arrows is proportional to the energy that flows between each component in the ecosystem.

Fig. 1.1

Fig. 1.1

Question 1(a)

(a)

Add an arrow to Fig. 1.1 to show where the ecosystem receives its initial input of energy.

[ 1 ]

Question 1(c)

(b)

State one type of organism that is a member of the decomposer system.

[ 1 ]

Question 1

Question 1(a)

(a)

Complete the passage with the most appropriate term.

Within each ecosystem there is a of organisms that interact with each other and with their environment. Each species fills a particular within the ecosystem. Feeding relationships in food webs are an example of the interactions species have with each other. In old field ecosystems in North America, producers, such as blue grass, provide energy for grazing animals. These animals form the in the food chain.

[ 3 ]
0 selected