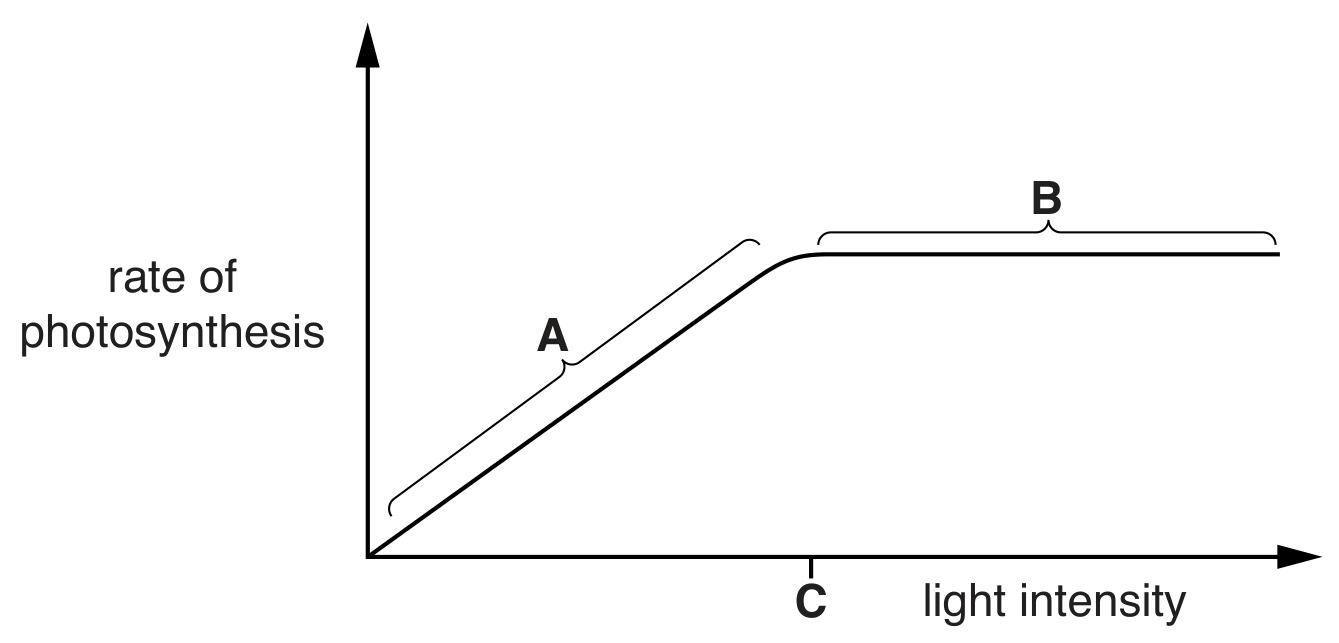
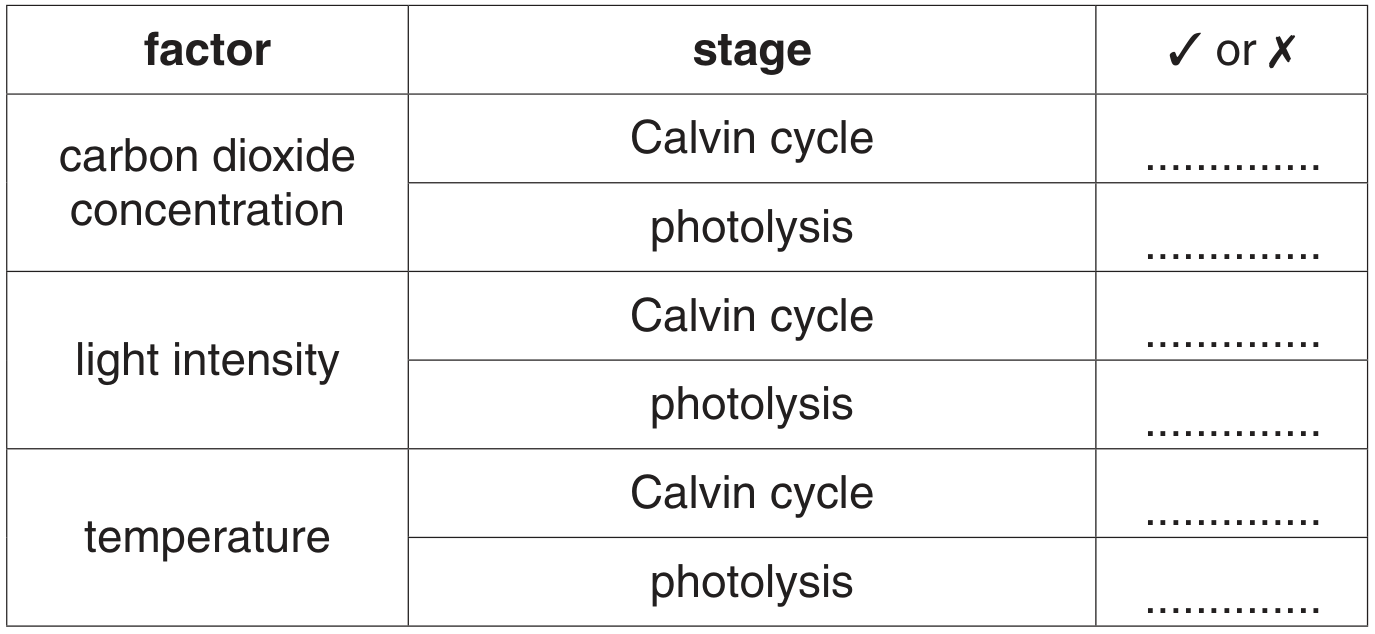
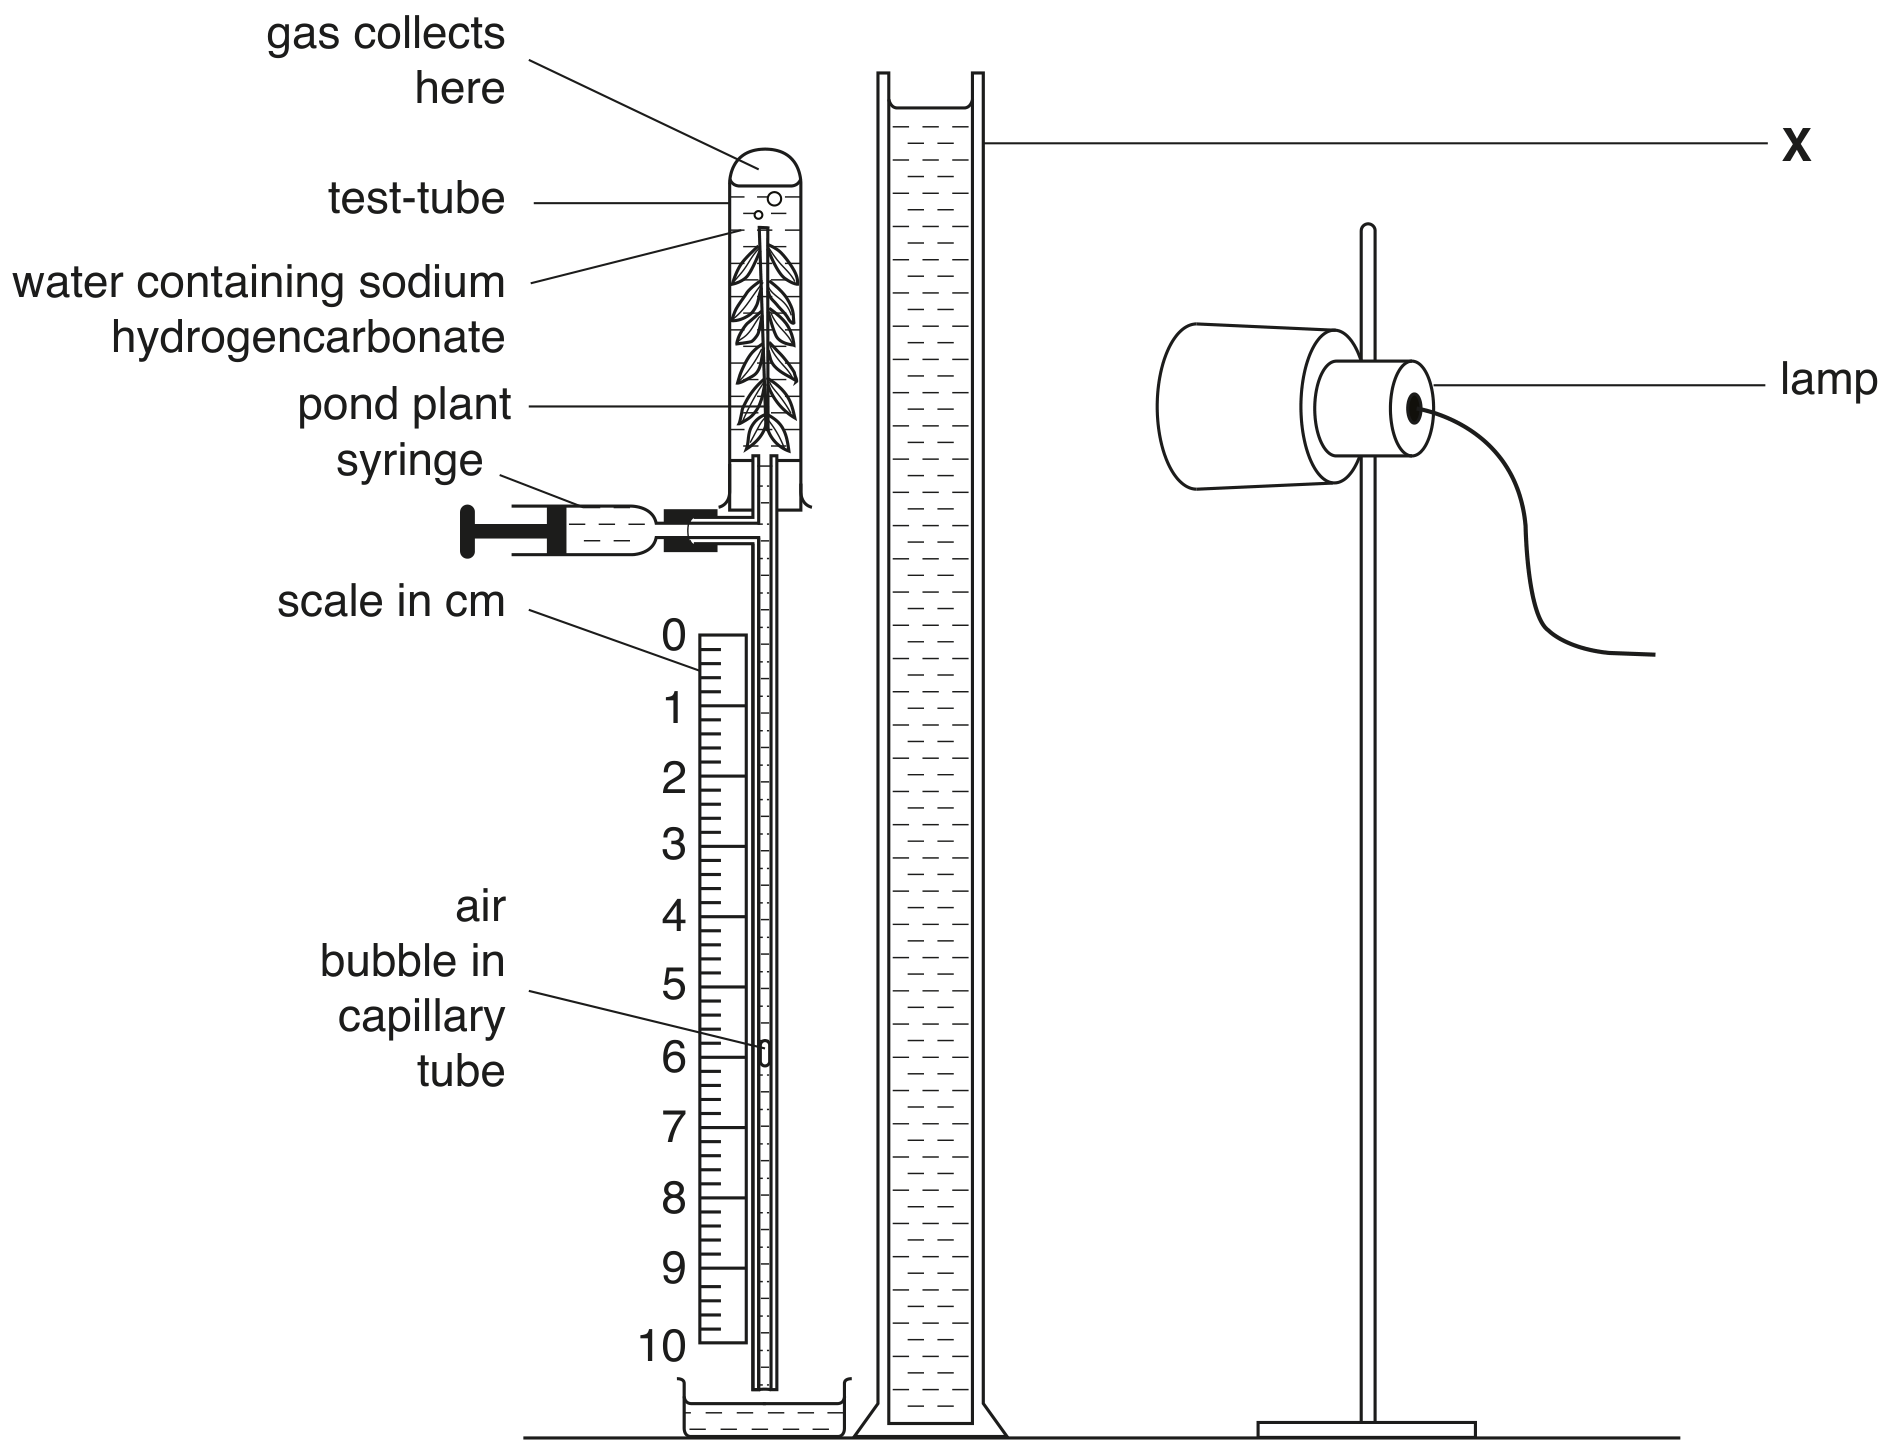
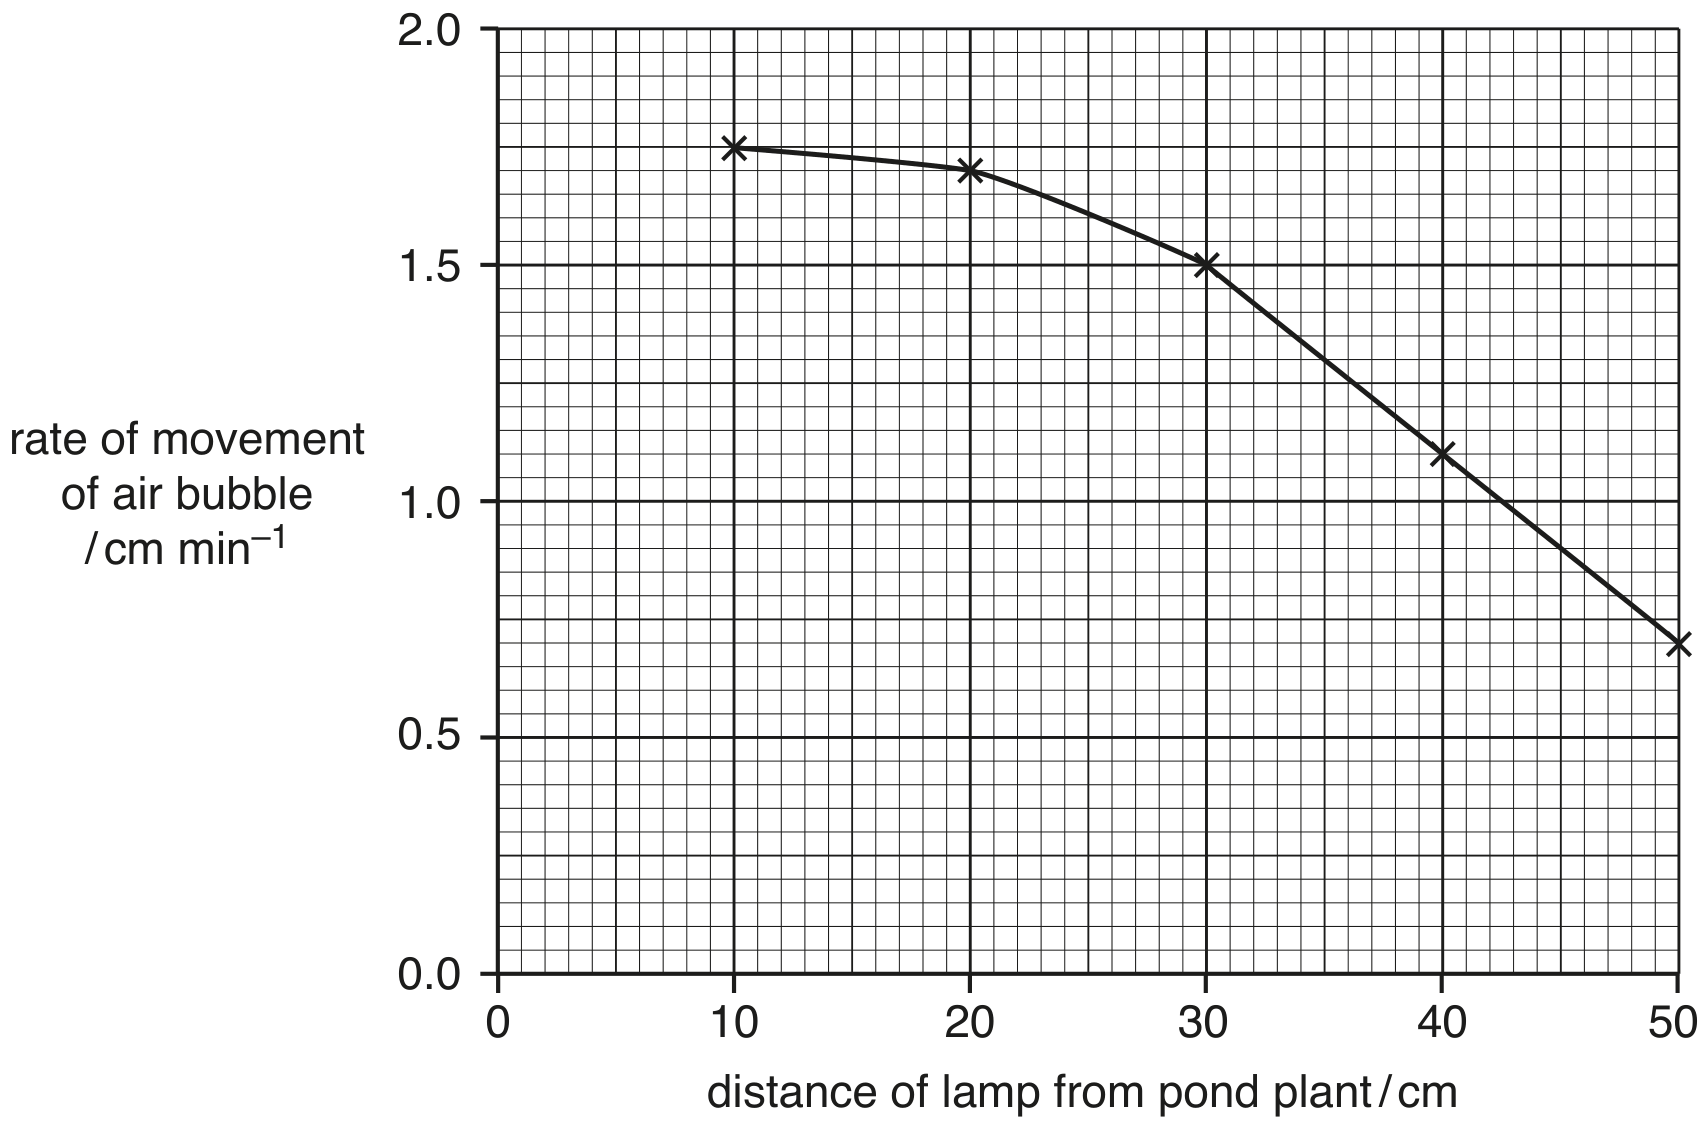
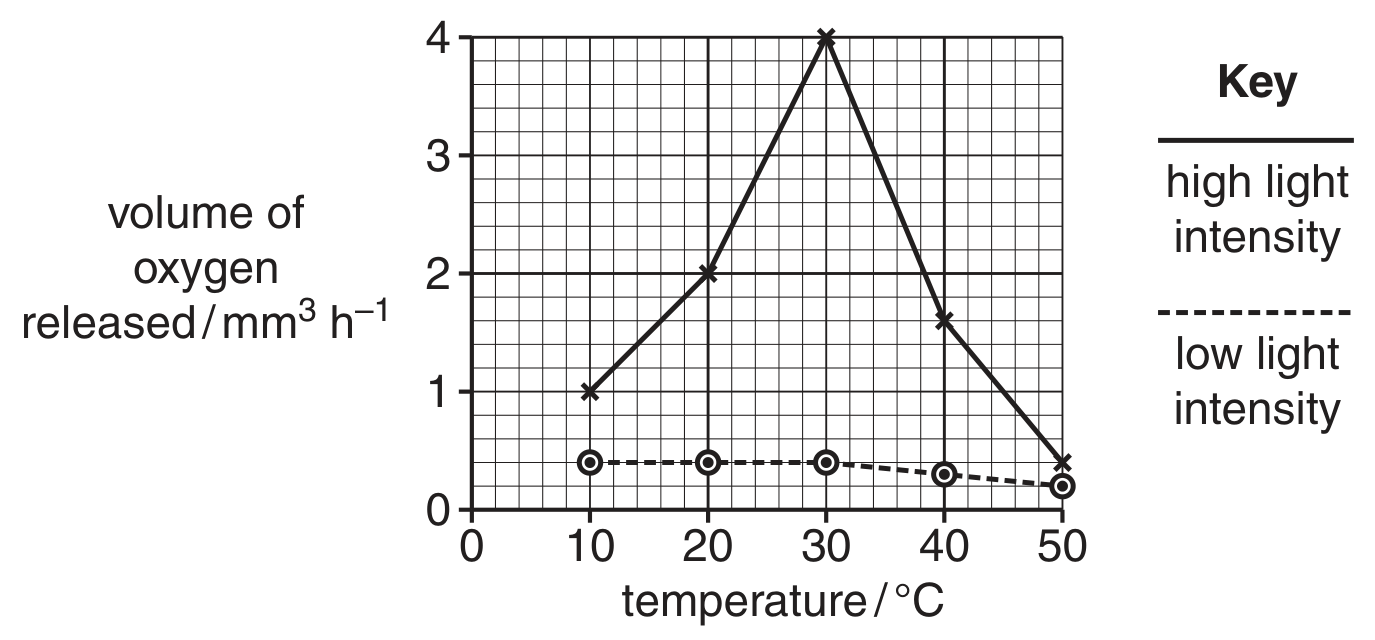
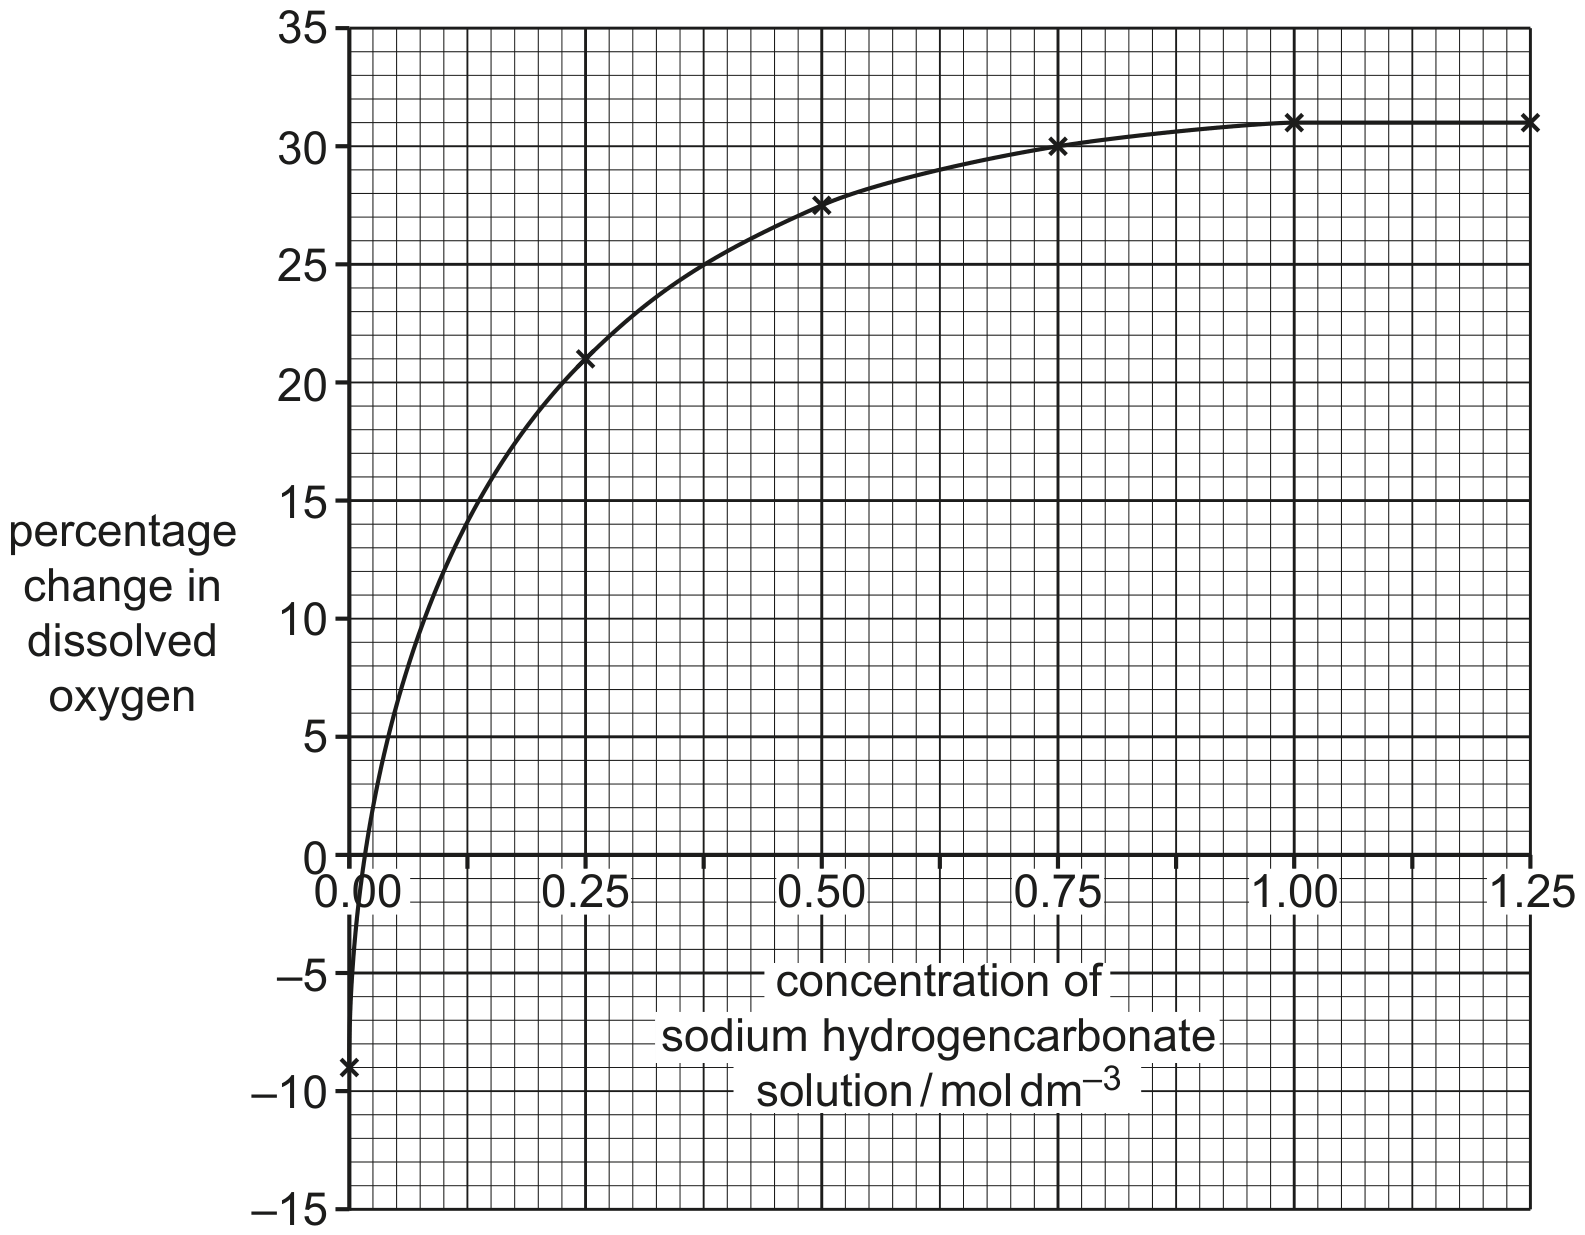
Question 1
Question 1(c)
Question 1(c)(i)
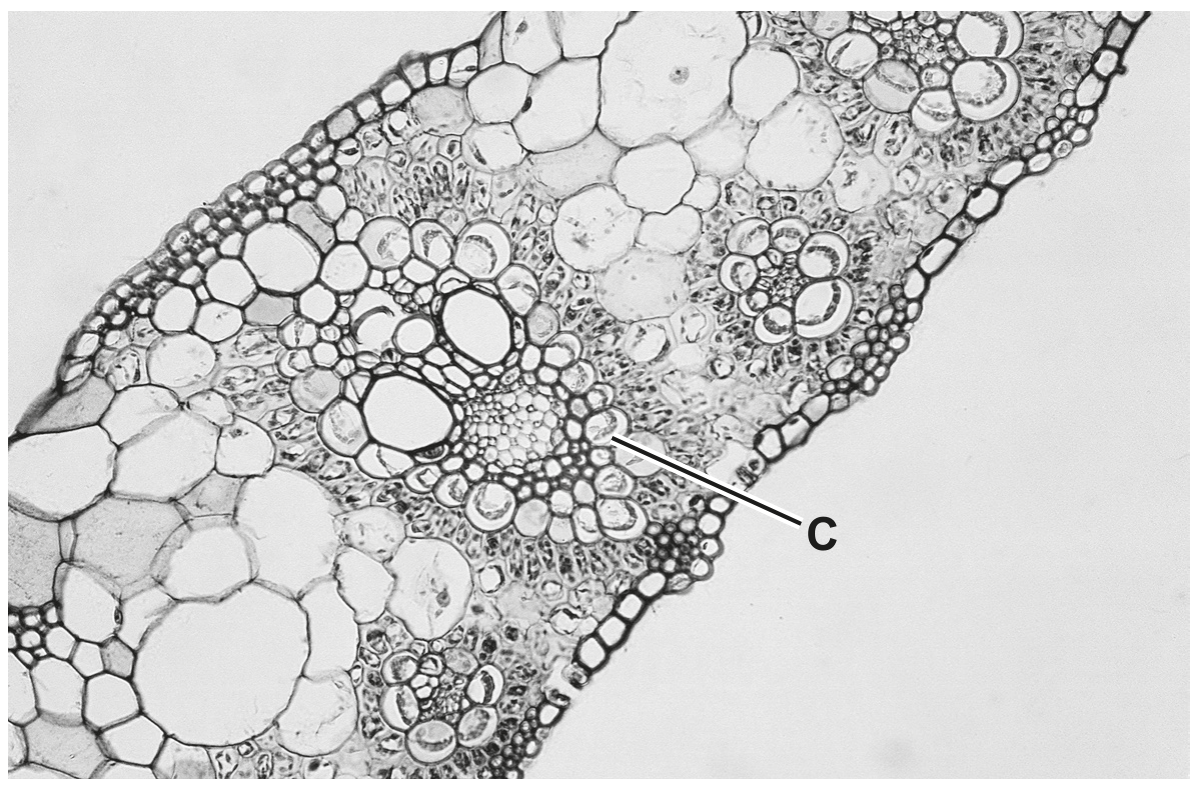
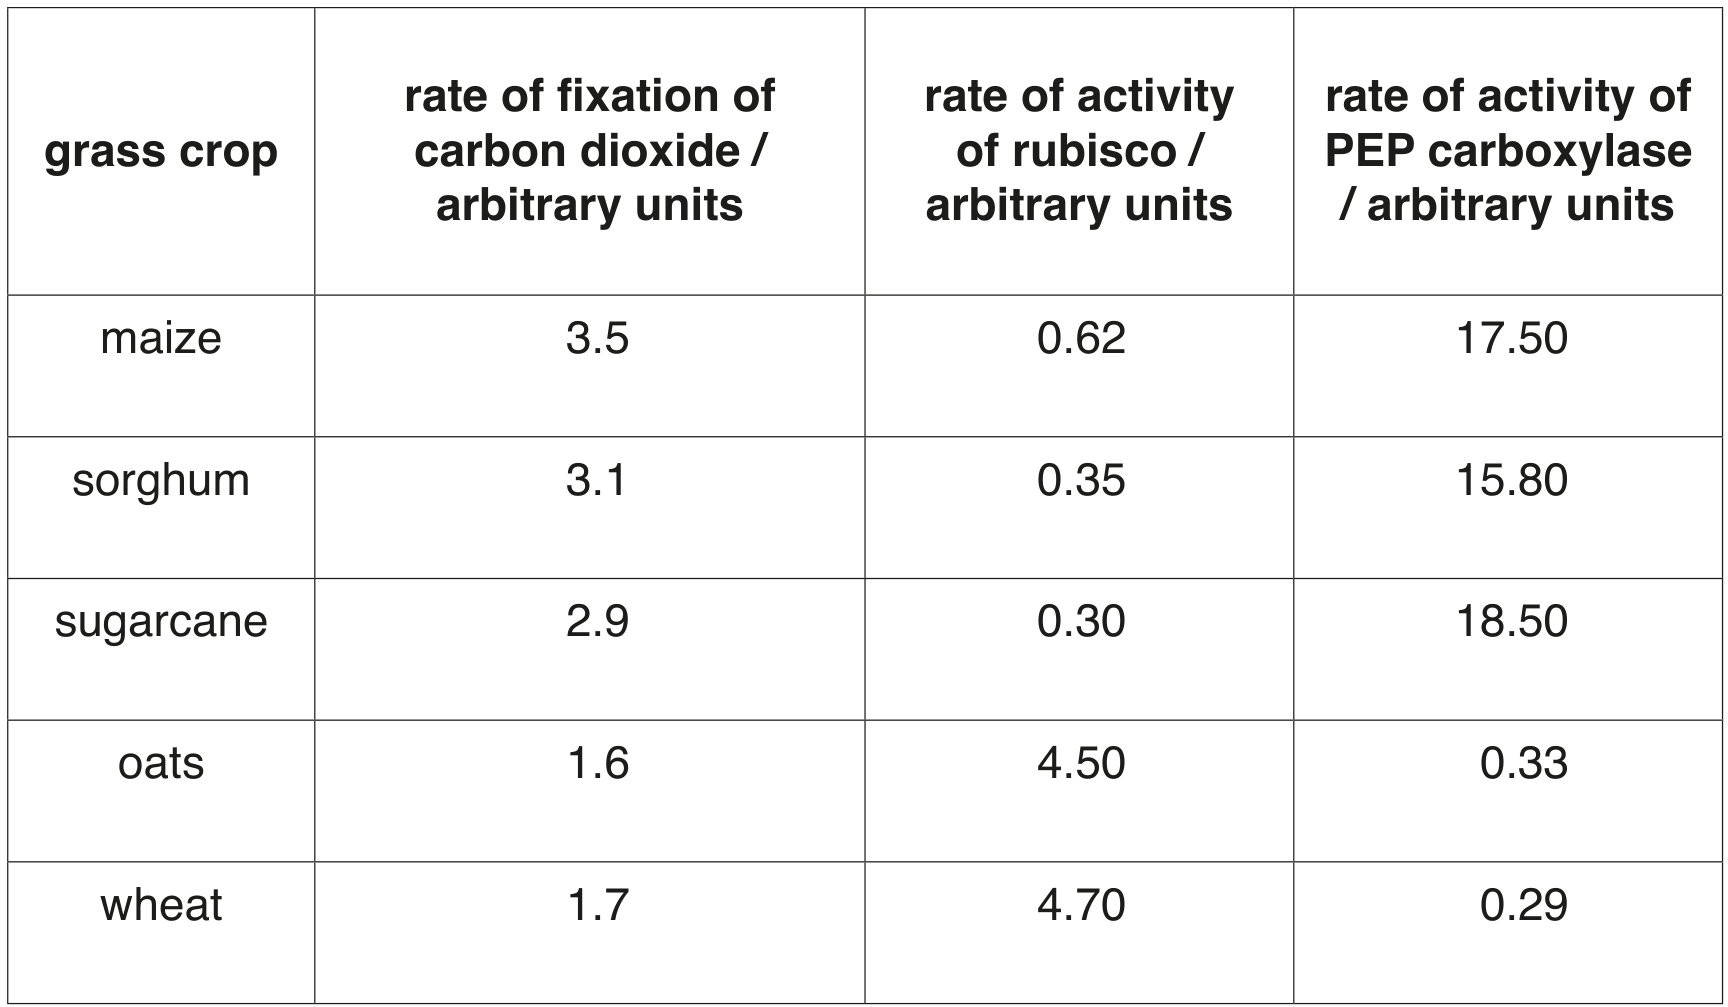
(a)
(i)
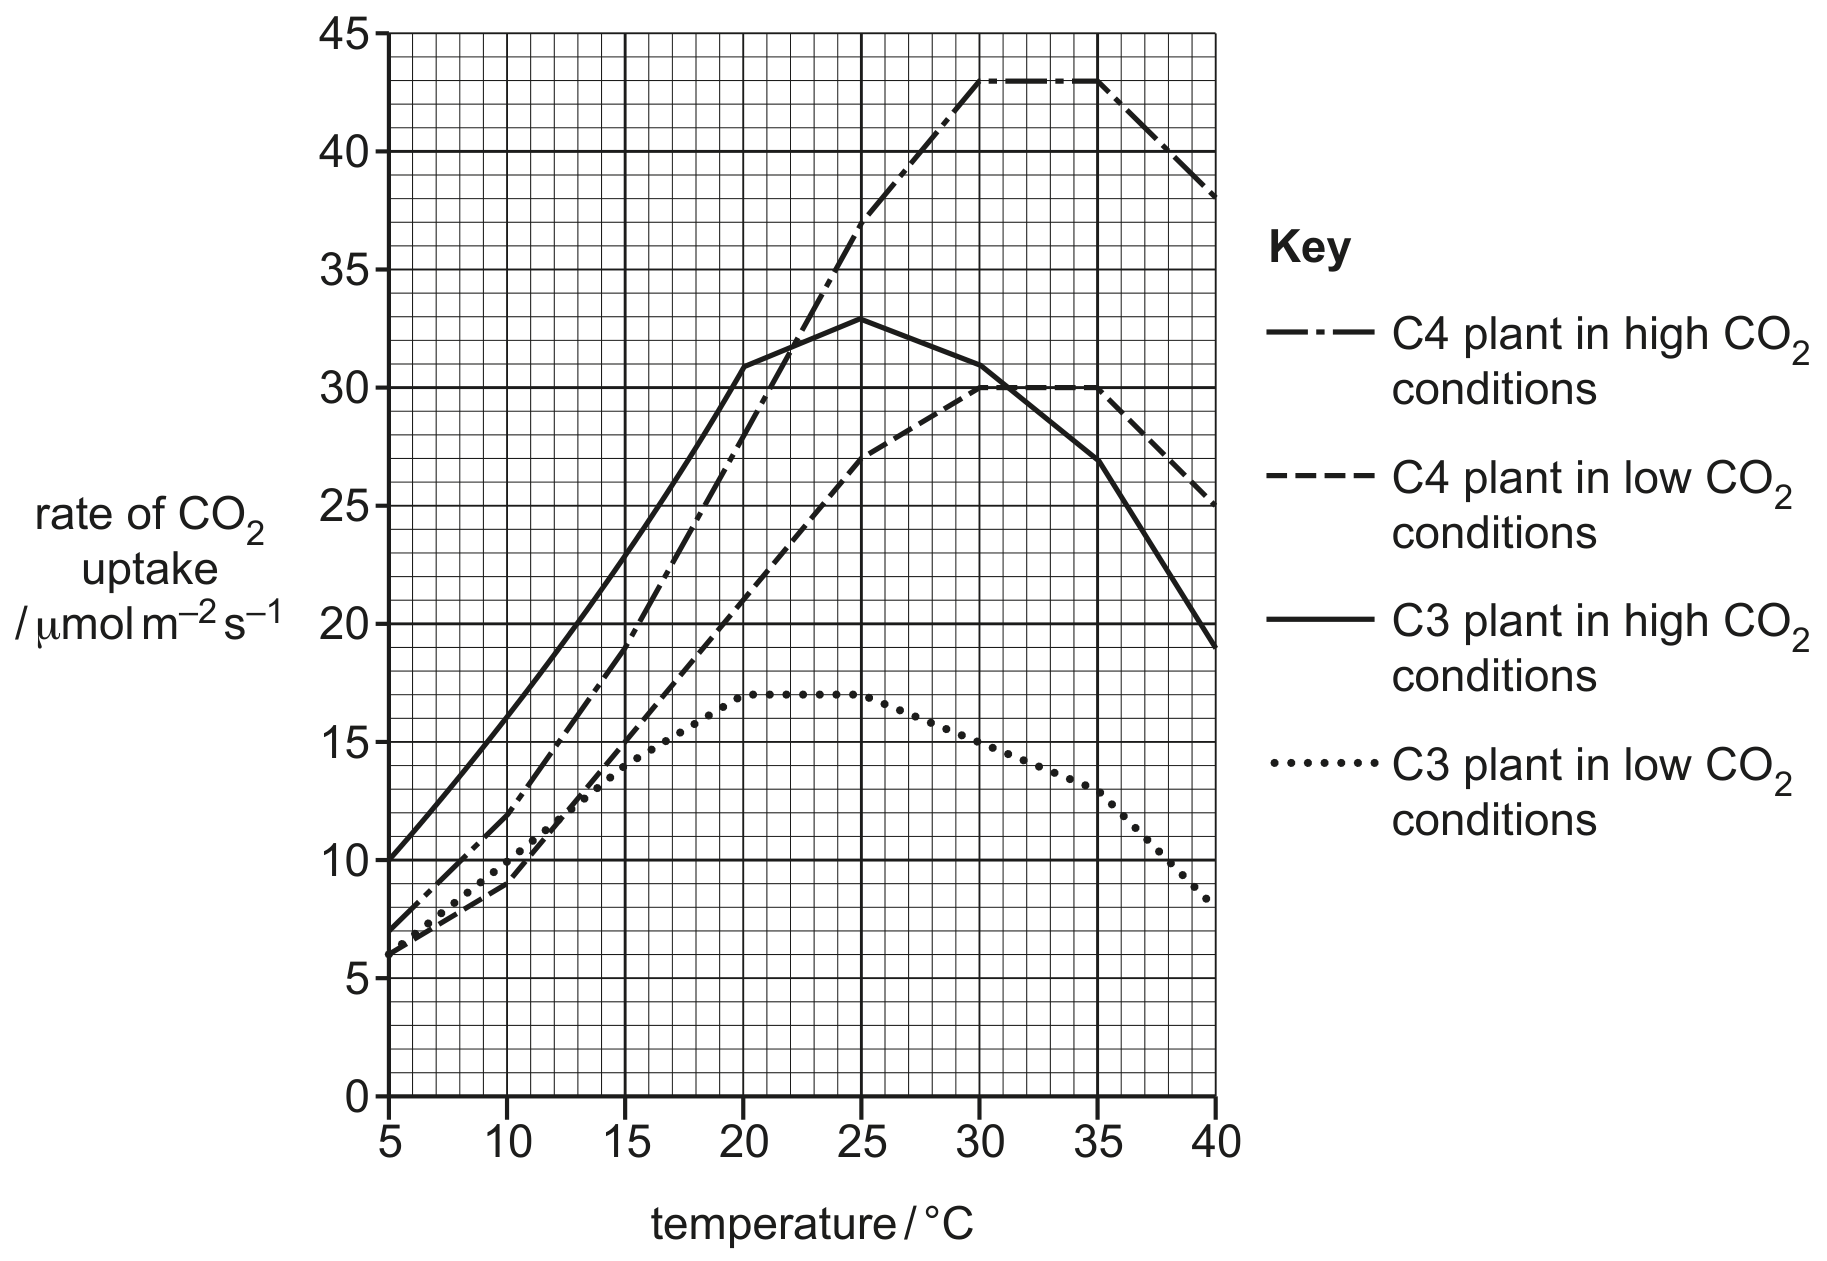
The anatomy of C 4 plants is adapted to allow the rate of photosynthesis to remain high at high temperatures.
C3 plants do not have these adaptations and an additional reaction occurs at high temperatures that reduces the rate of photosynthesis.
Explain why the reaction that takes place at high temperatures in C3 plants reduces the rate of photosynthesis.
[ 2 ]