Reactivity 3. What are the mechanisms of chemical change?
- Syllabus
- First assessment 2025
- Section
- —
- Level
- HL
A Brønsted–Lowry acid donates H+ and a Brønsted–Lowry base accepts H+. An alkali is a base that is soluble in water.
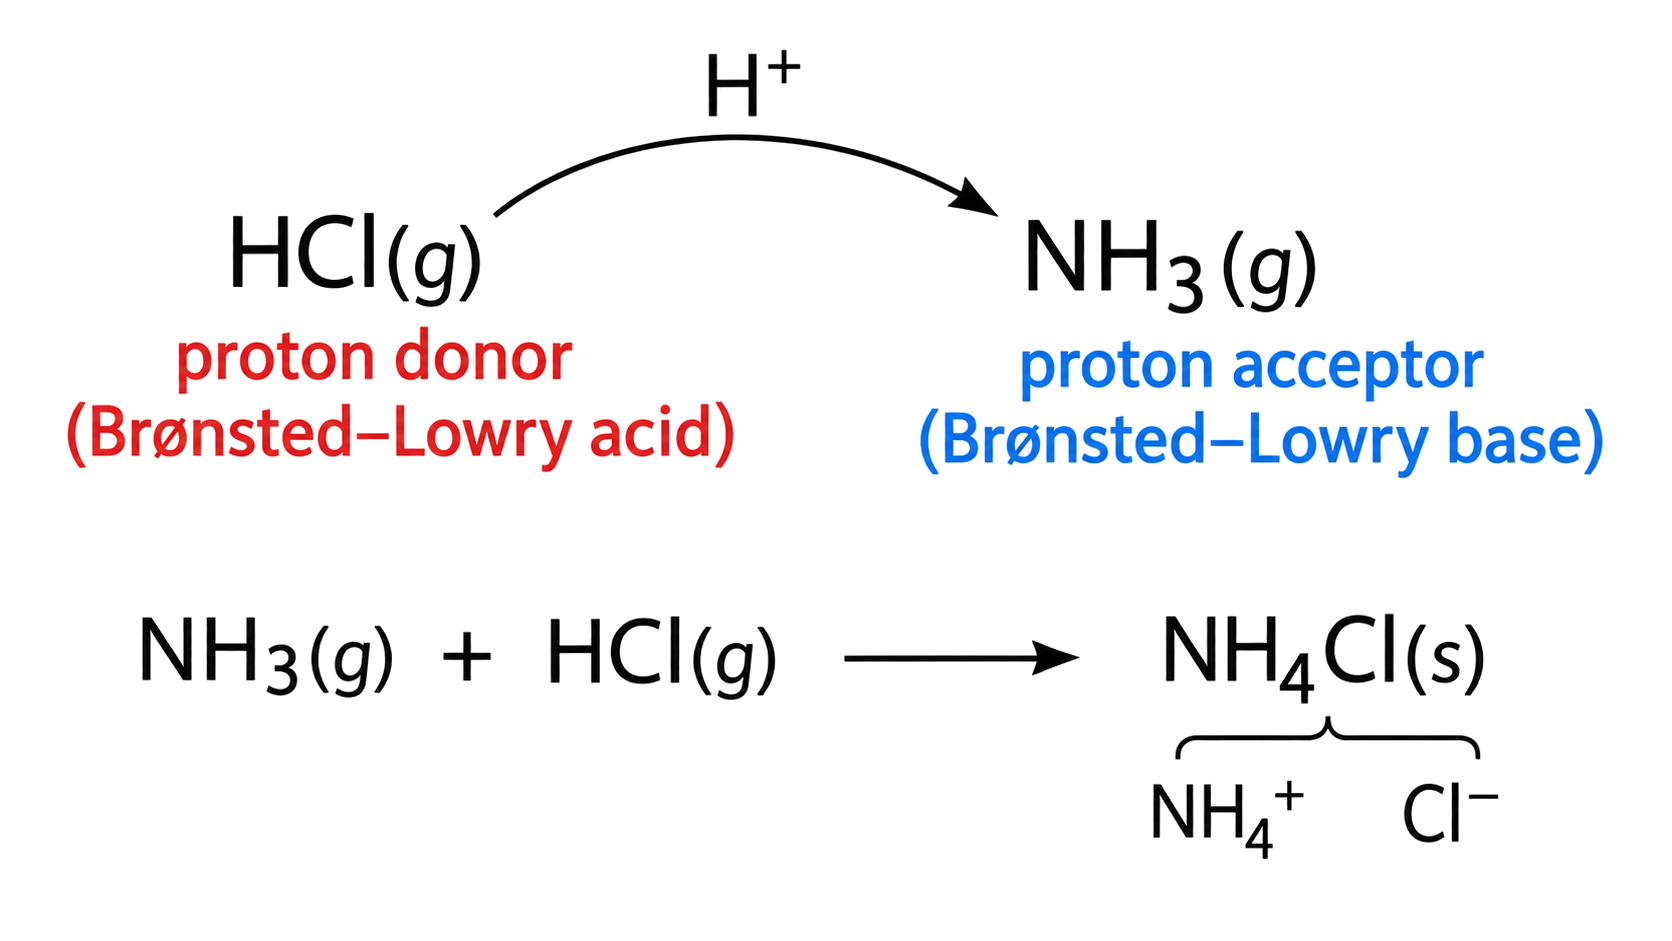
Follow the proton: the species losing it is the acid and the species gaining it is the base.
Pair species that differ by exactly one H⁺ to identify conjugate acid–base pairs. Charge alone does not decide the role: in NH₄⁺ + H₂O ⇌ NH₃ + H₃O⁺, NH₄⁺ is the proton donor and water is the acceptor.
An amphiprotic species can donate H+ in one reaction and accept H+ in another.
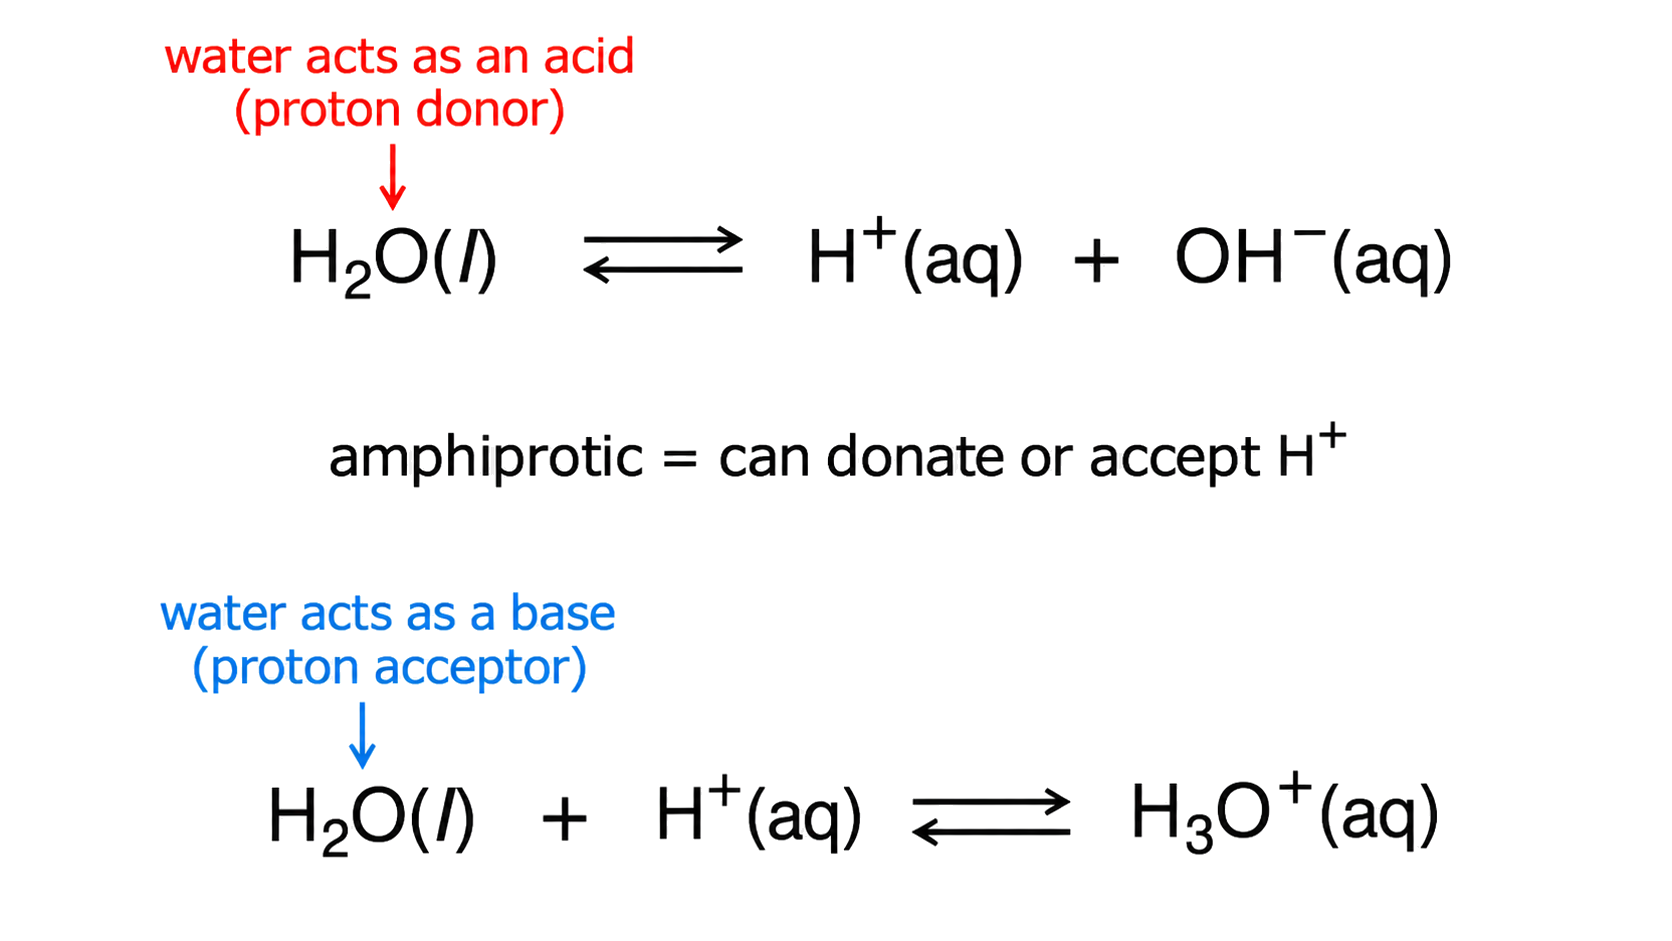
Write one equation in which the species becomes its conjugate base and another in which it becomes its conjugate acid.
For HCO₃⁻, donation gives CO₃²⁻ whereas acceptance gives H₂CO₃. Showing both reactions is the evidence for amphiprotic behaviour; one acid–base equation alone is insufficient.
A strong acid or base ionizes completely in aqueous solution; a weak acid or base ionizes only partially. The equilibrium favours the weaker conjugate species.
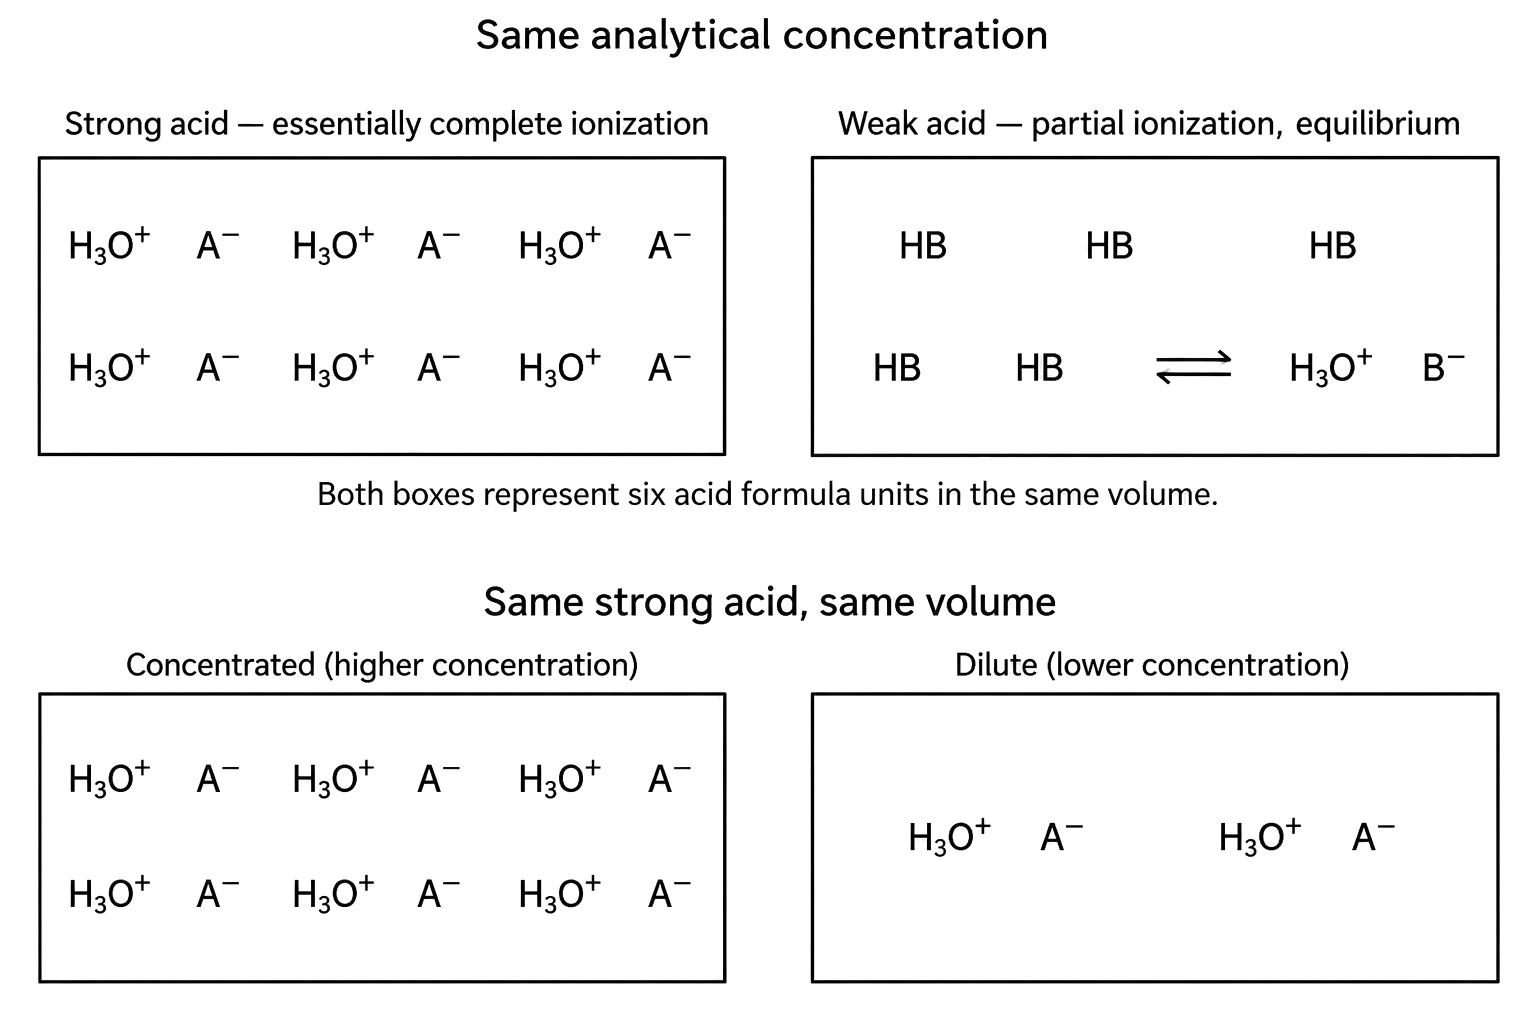
Strength is the extent of ionization, whereas concentration is the amount of solute per volume. A concentrated weak acid can be more acidic than a dilute strong acid.
Represent a strong acid with essentially complete ionization and a weak acid with an equilibrium containing substantial undissociated acid. Strength is an equilibrium property, while concentration is an initial amount per volume; pH depends on both, so strength alone cannot rank arbitrary solutions.
The equivalence point is where stoichiometric amounts of analyte and titrant have reacted. A monoprotic strong-acid–strong-base curve has a steep neutral region centred at the equivalence point.
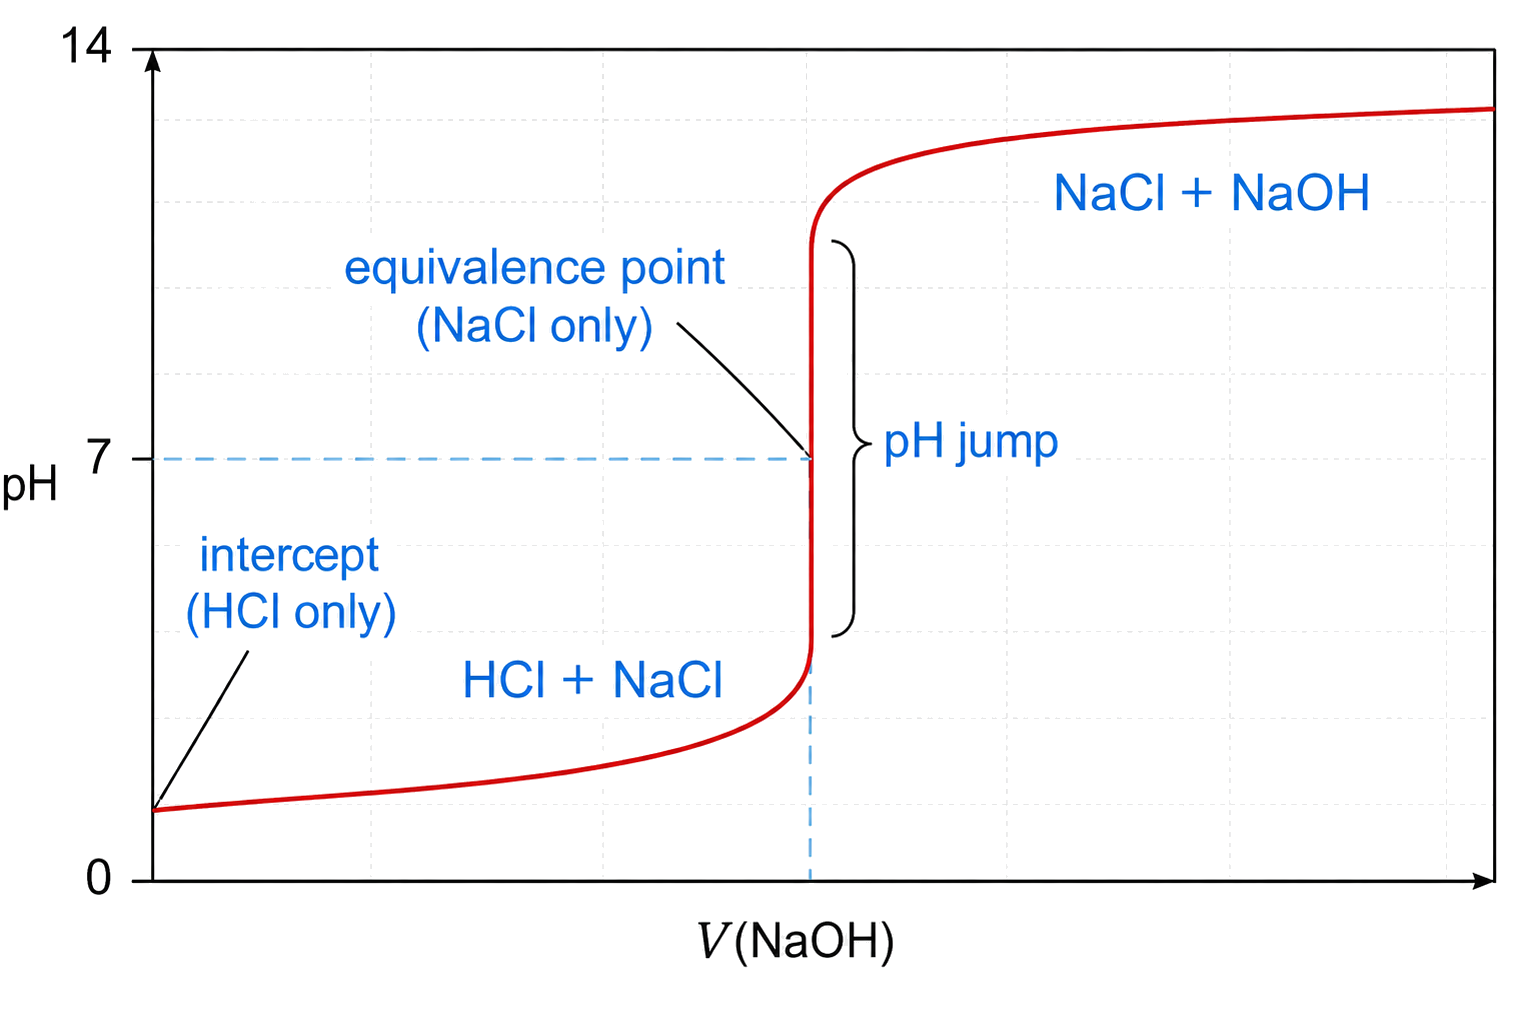
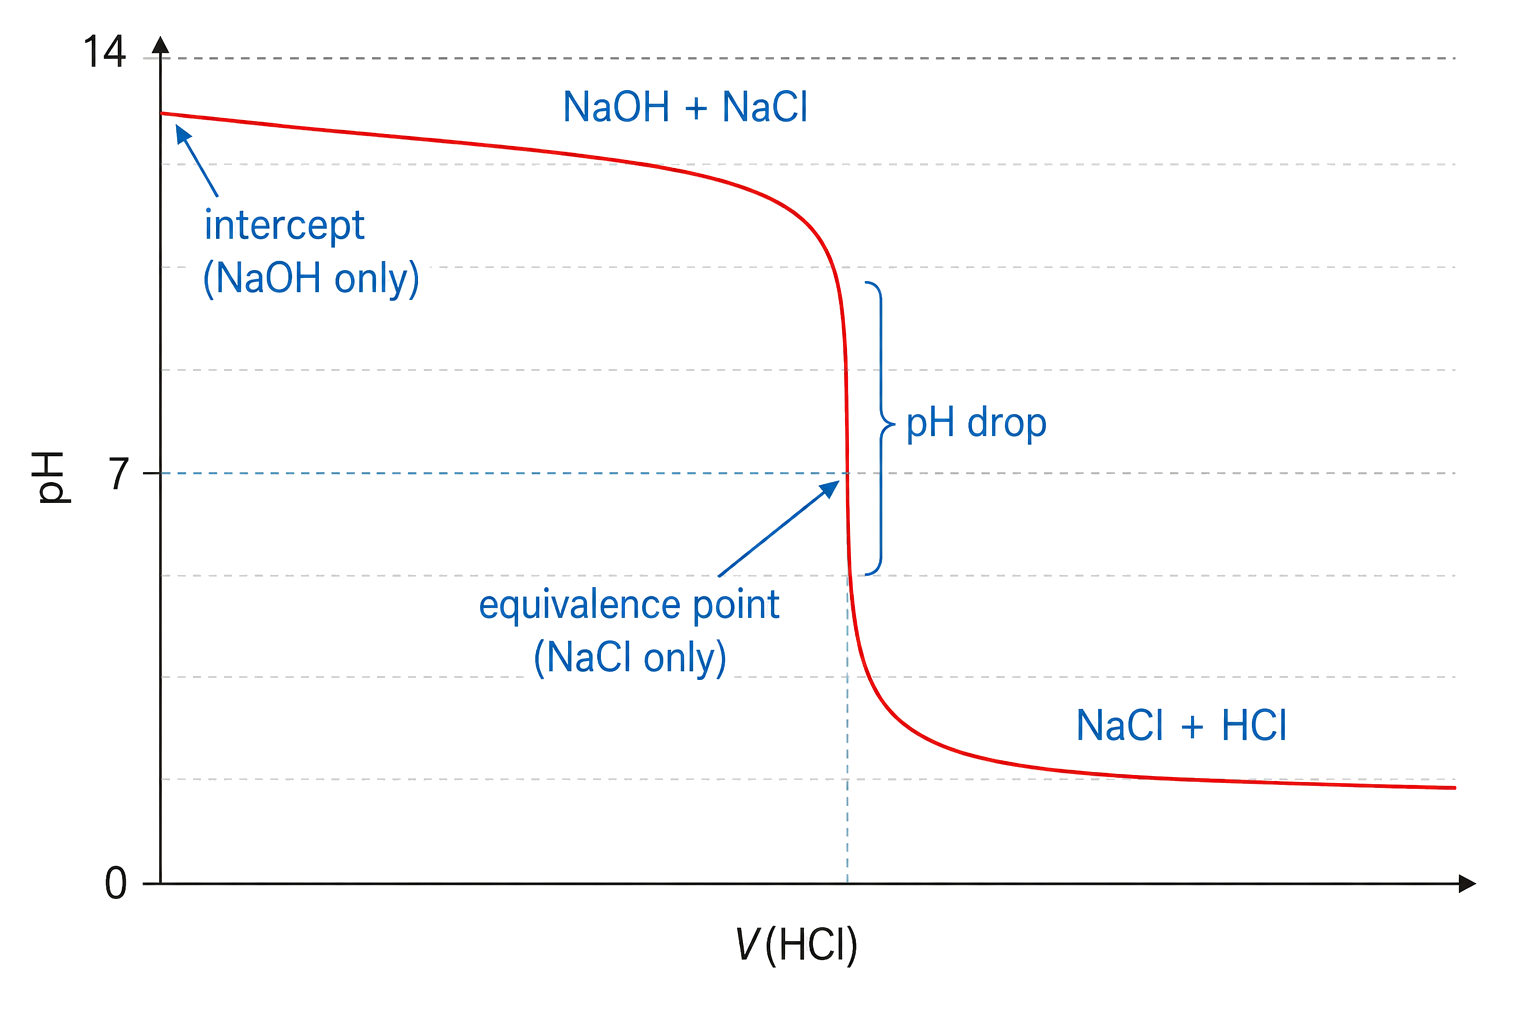
Read the initial pH, steep intercept region and final plateau; curve direction depends on whether acid or base is added.
For a strong acid titrated with strong base at 25 °C, calculate the initial pH from excess acid, locate equivalence from stoichiometric moles, and place the steep section around pH 7. Equivalence is a mole condition; it is not the same as equal solution volumes unless concentrations and stoichiometry make it so.
Trace each salt ion to its parent acid or base. A conjugate base from a weak acid can hydrolyse water to produce OH− and an alkaline solution; a conjugate acid from a weak base can produce H3O+.
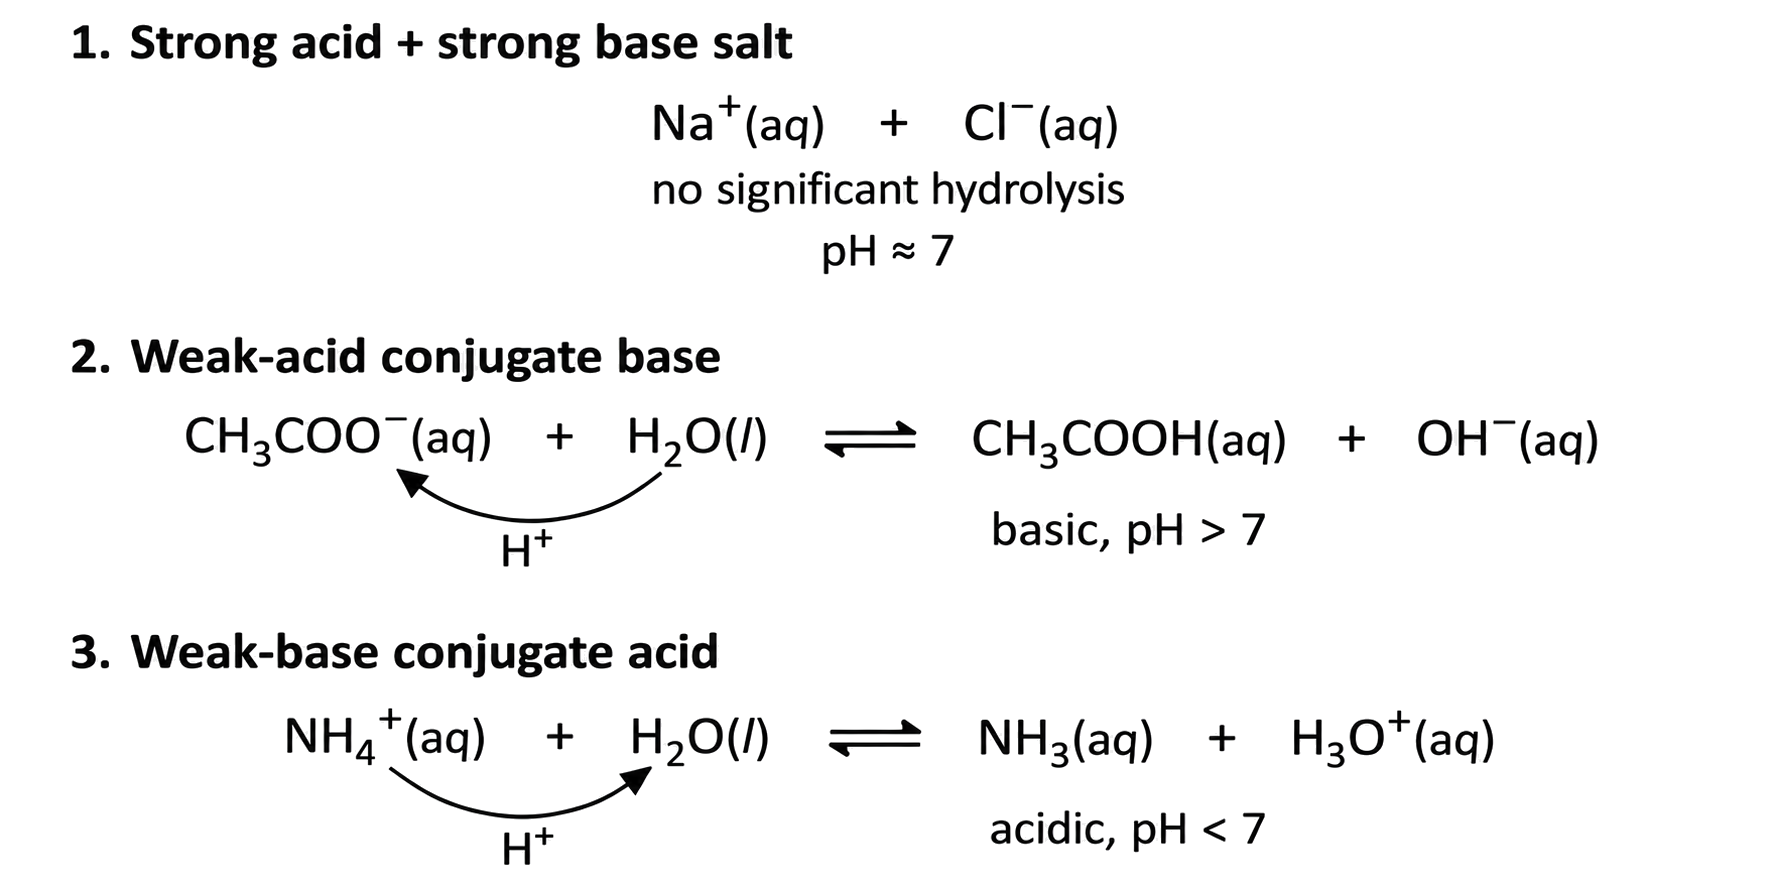
Spectator ions from strong parents do not control pH. NH₄Cl is acidic because NH₄⁺ donates a proton to water, while a carbonate salt is basic because CO₃²⁻ accepts one; write the hydrolysing ion, not the intact salt, in the equilibrium.
Compare all four strong/weak combinations by starting pH, buffer region, equivalence-point pH and steep-section position. For a weak acid titrated with strong base, half-equivalence gives pH = pKa and the equivalence solution is basic. For a weak base titrated with strong acid, half-equivalence gives pOH = pKb (then pH = pKw − pOH) and the equivalence solution is acidic. Weak–weak curves often lack a sufficiently steep indicator region.
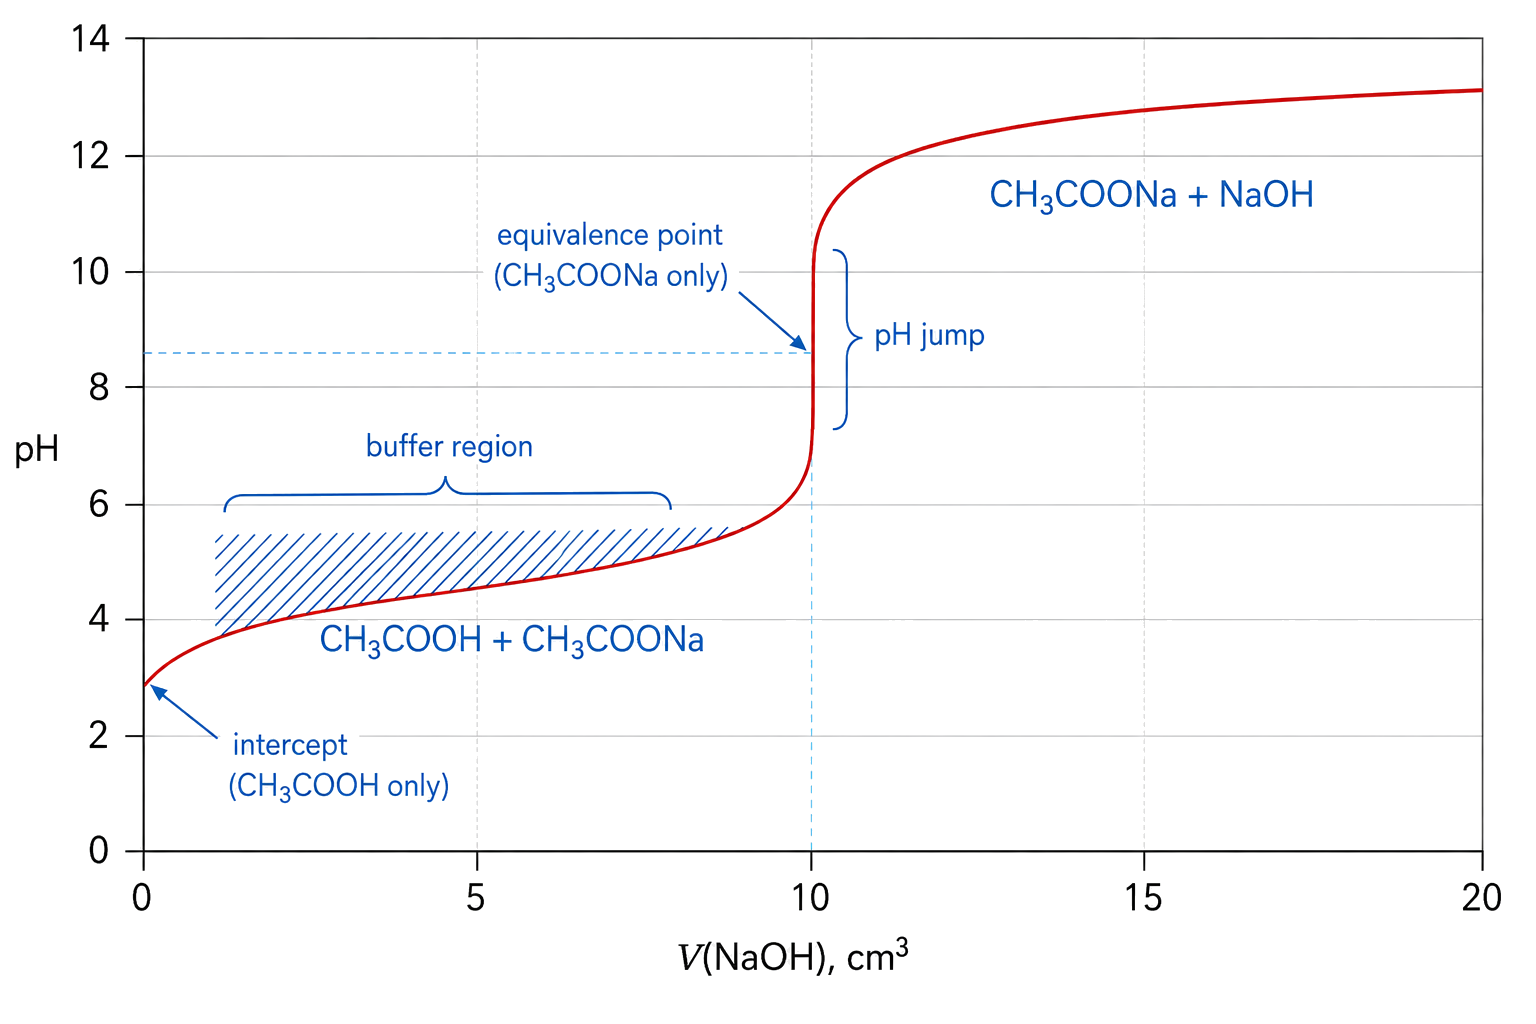
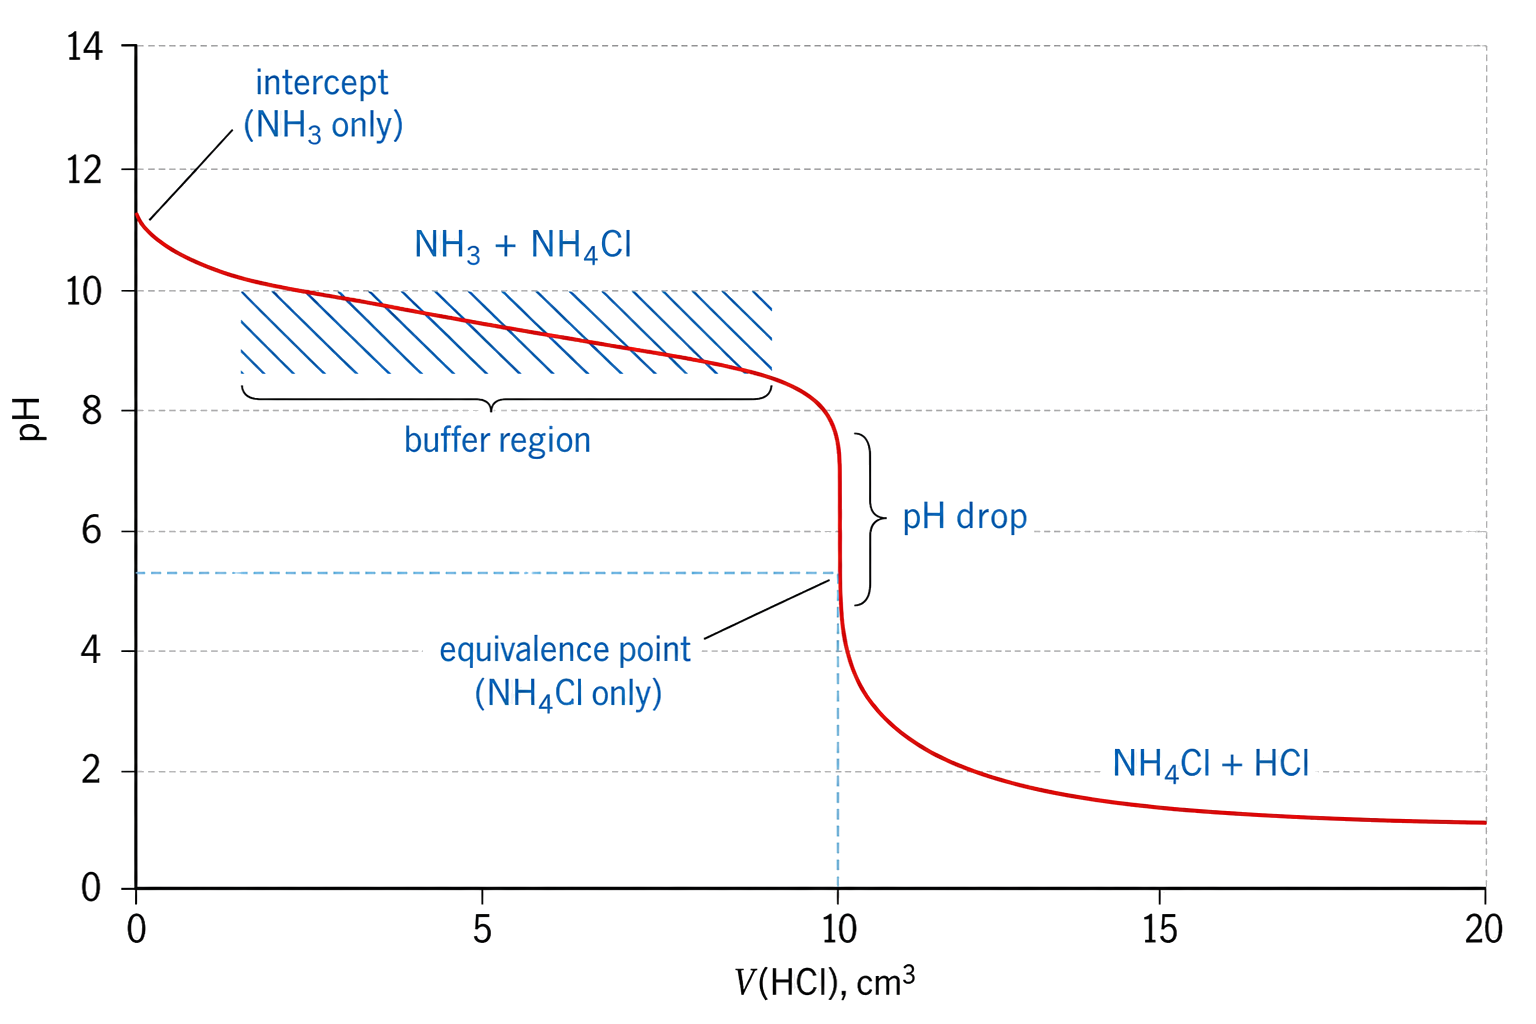
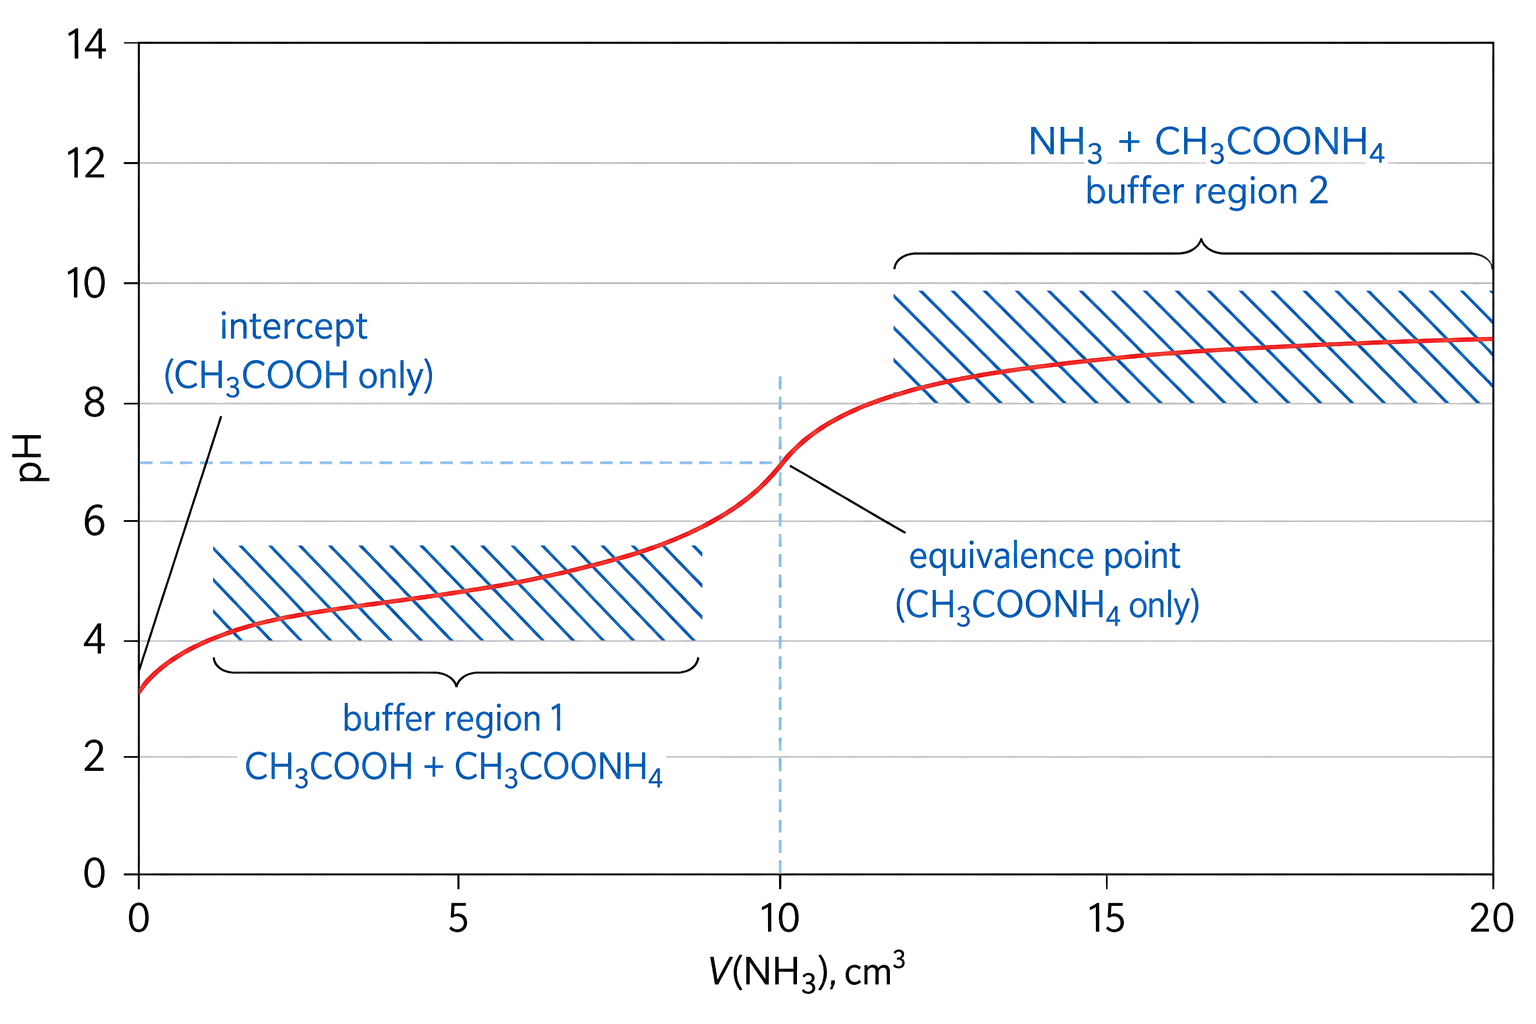
A buffer region contains appreciable weak acid and conjugate base, so the pH changes relatively slowly as titrant is added.
A weak acid–strong base curve starts at a higher pH than an equally concentrated strong acid, contains a buffer region, has pH = pKa at half-equivalence, and has an alkaline equivalence point from conjugate-base hydrolysis. Weak–weak titrations often lack a sufficiently steep jump for a simple indicator endpoint.
Choose an indicator whose endpoint transition range lies within the steep pH change around the equivalence point. Use salt identity to predict whether that equivalence pH is acidic, neutral or alkaline.
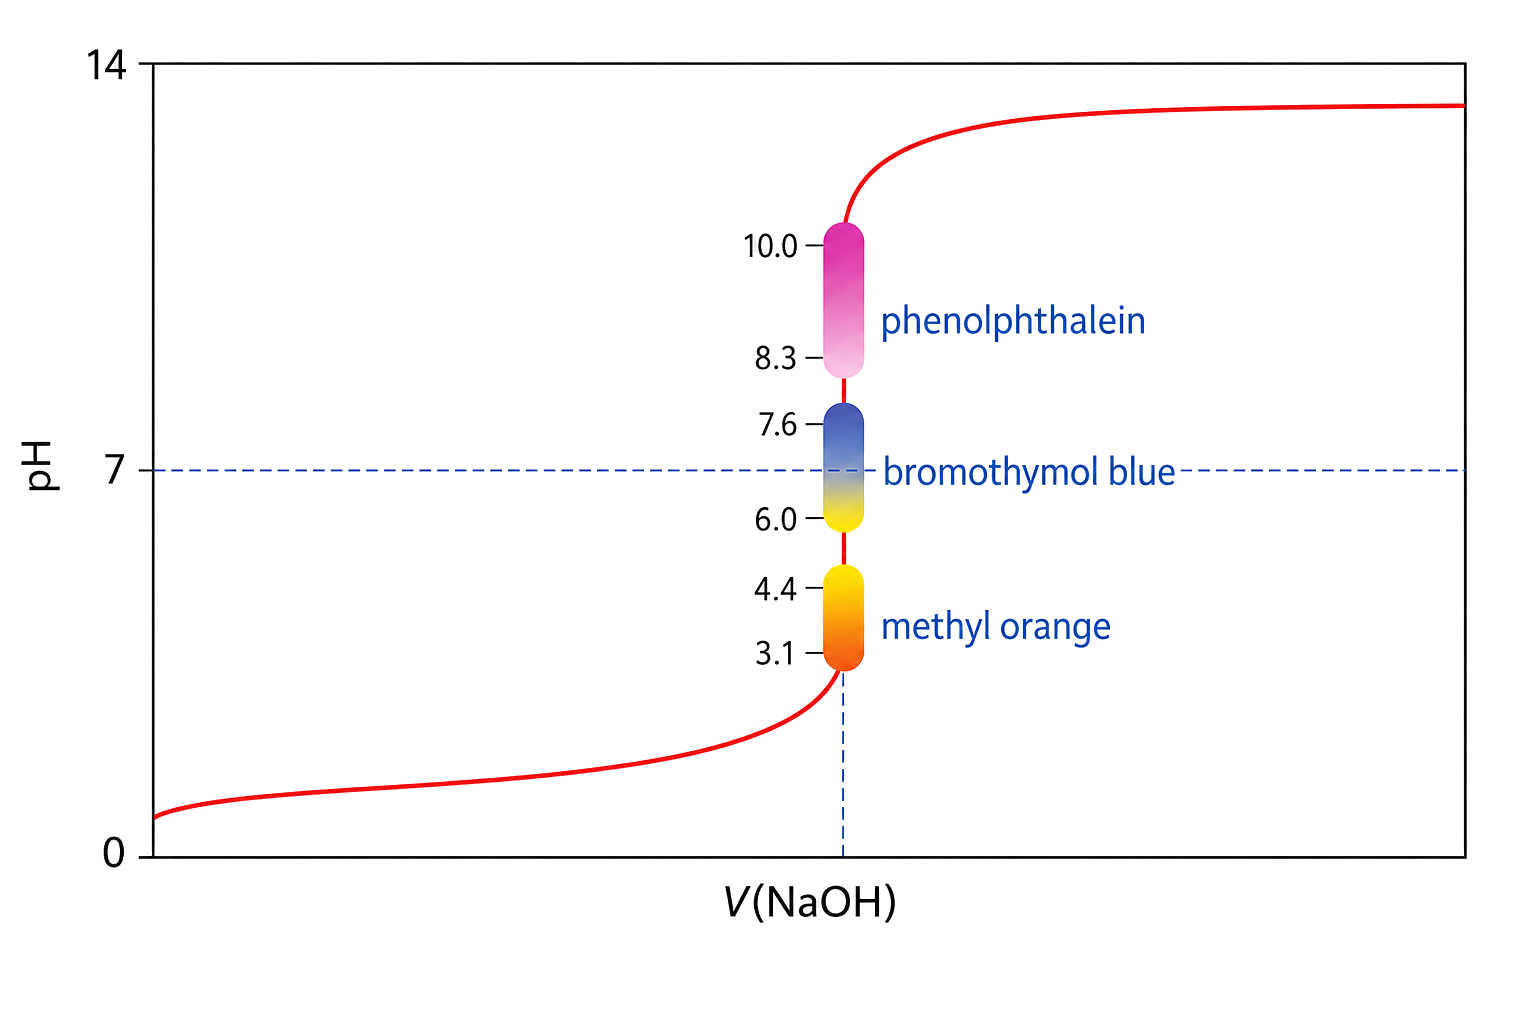
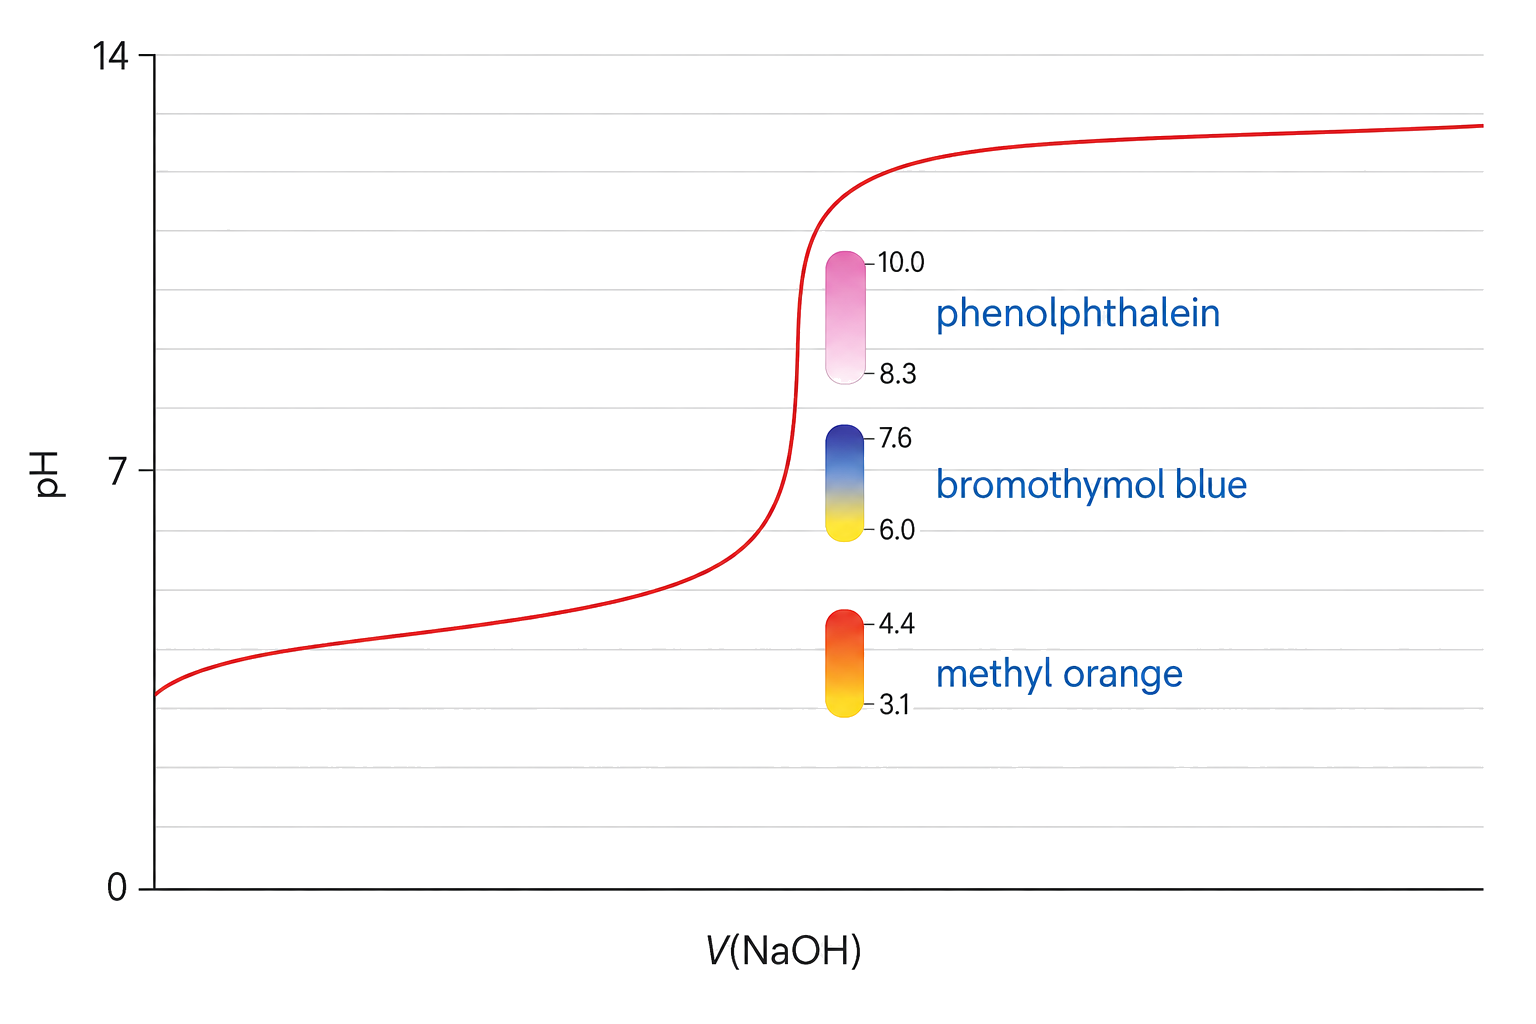
The equivalence point is the stoichiometric condition; the endpoint is the observed indicator colour change. A good indicator makes them coincide closely.
Overlay the indicator transition range on the titration curve and require the whole visible change to fall inside the steep region. A weak acid–strong base equivalence is alkaline and favours an alkaline-range indicator; a strong acid–weak base equivalence is acidic. Endpoint proximity, not a memorized indicator name alone, is the criterion.
An acidic buffer contains a weak acid and its conjugate base; a basic buffer contains a weak base and its conjugate acid. The pair resists pH change when small amounts of strong acid or base are added.
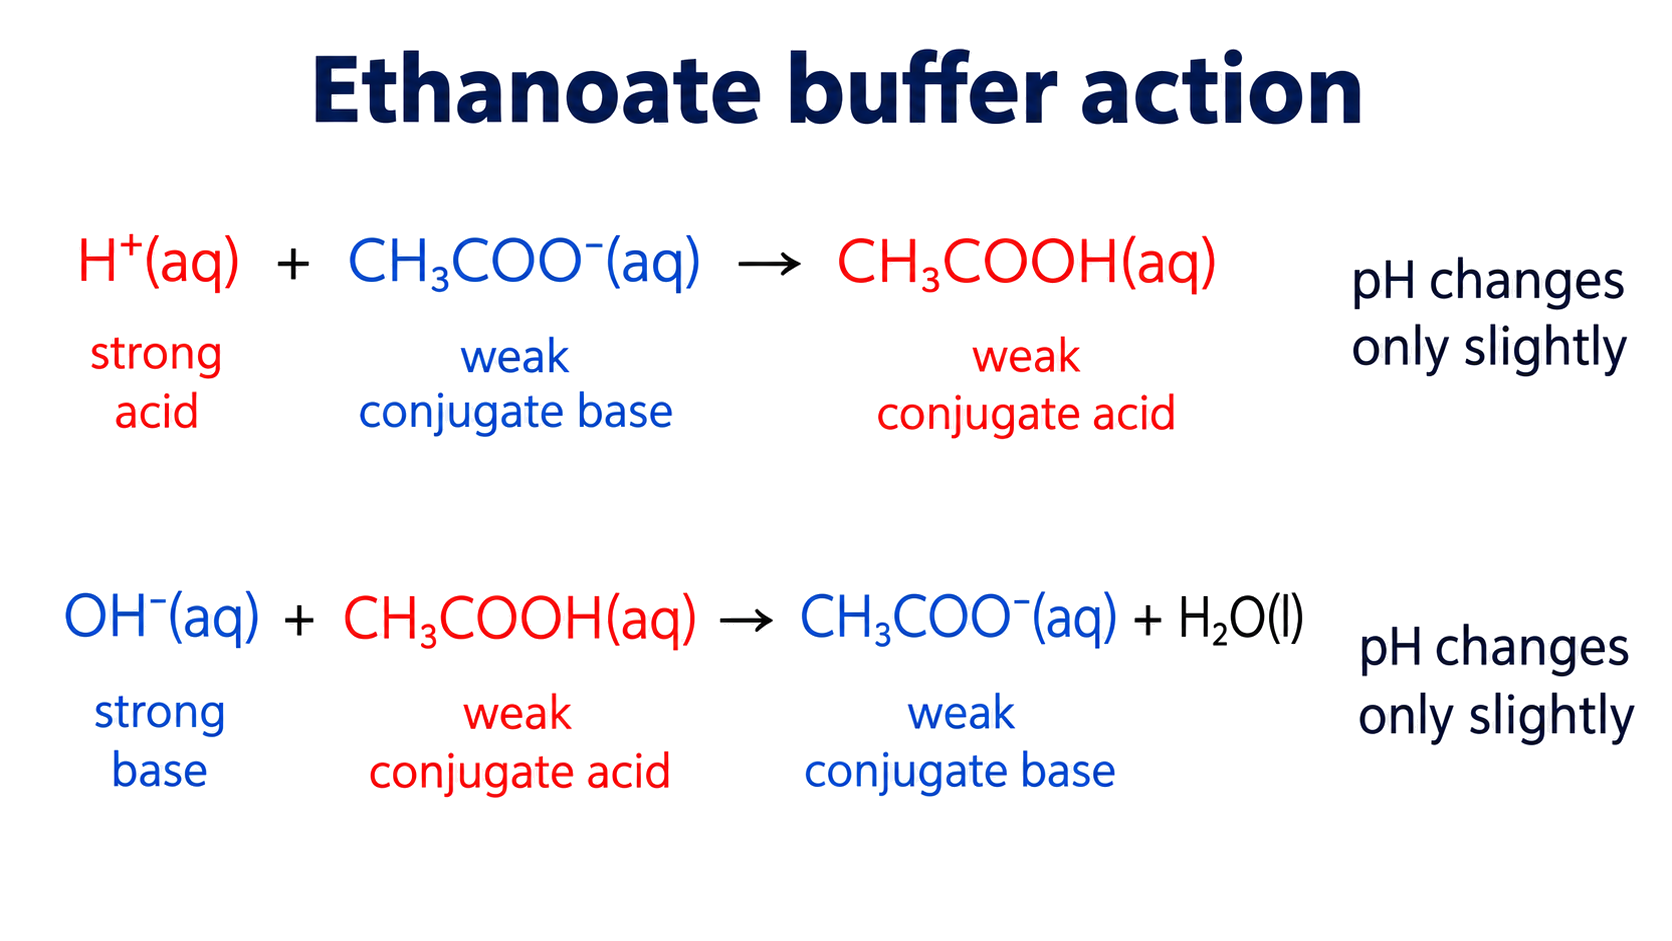
The conjugate base consumes added H+; the weak acid equilibrium supplies H+ when added OH− removes it. In both cases the conjugate equilibrium shifts to oppose the change.
In an ethanoic acid/ethanoate buffer, CH₃COO⁻ consumes added H⁺ and CH₃COOH consumes added OH⁻, so the conjugate ratio changes only slightly. A buffer resists small additions but has finite capacity; once one component is nearly exhausted, the pH can change sharply.
Oxidation always occurs at the anode and reduction always occurs at the cathode. In a voltaic cell the anode is negative and cathode positive; in an electrolytic cell the anode is positive and cathode negative.
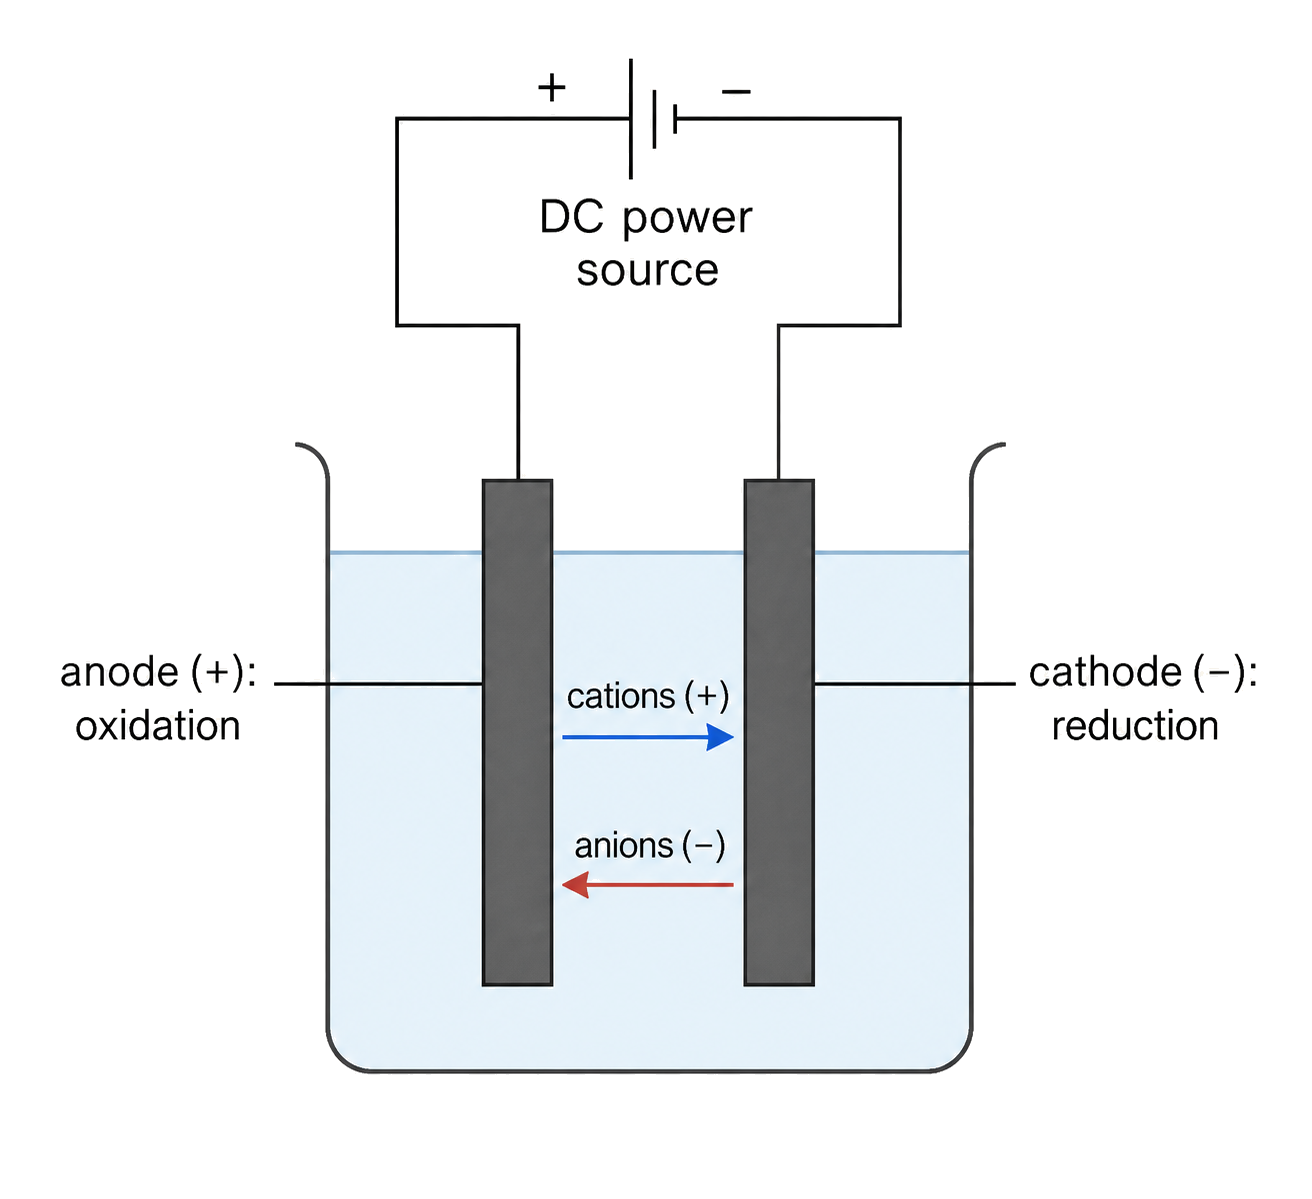
Name electrodes from the half-reactions before assigning signs. Electrons leave the anode and reach the cathode through the external circuit; a power supply reverses the polarities in an electrolytic cell but never changes where oxidation and reduction occur.
A voltaic cell uses a spontaneous redox reaction to convert chemical energy to electrical energy. Electrons flow through the wire from anode to cathode; the salt bridge carries ions to maintain charge neutrality.
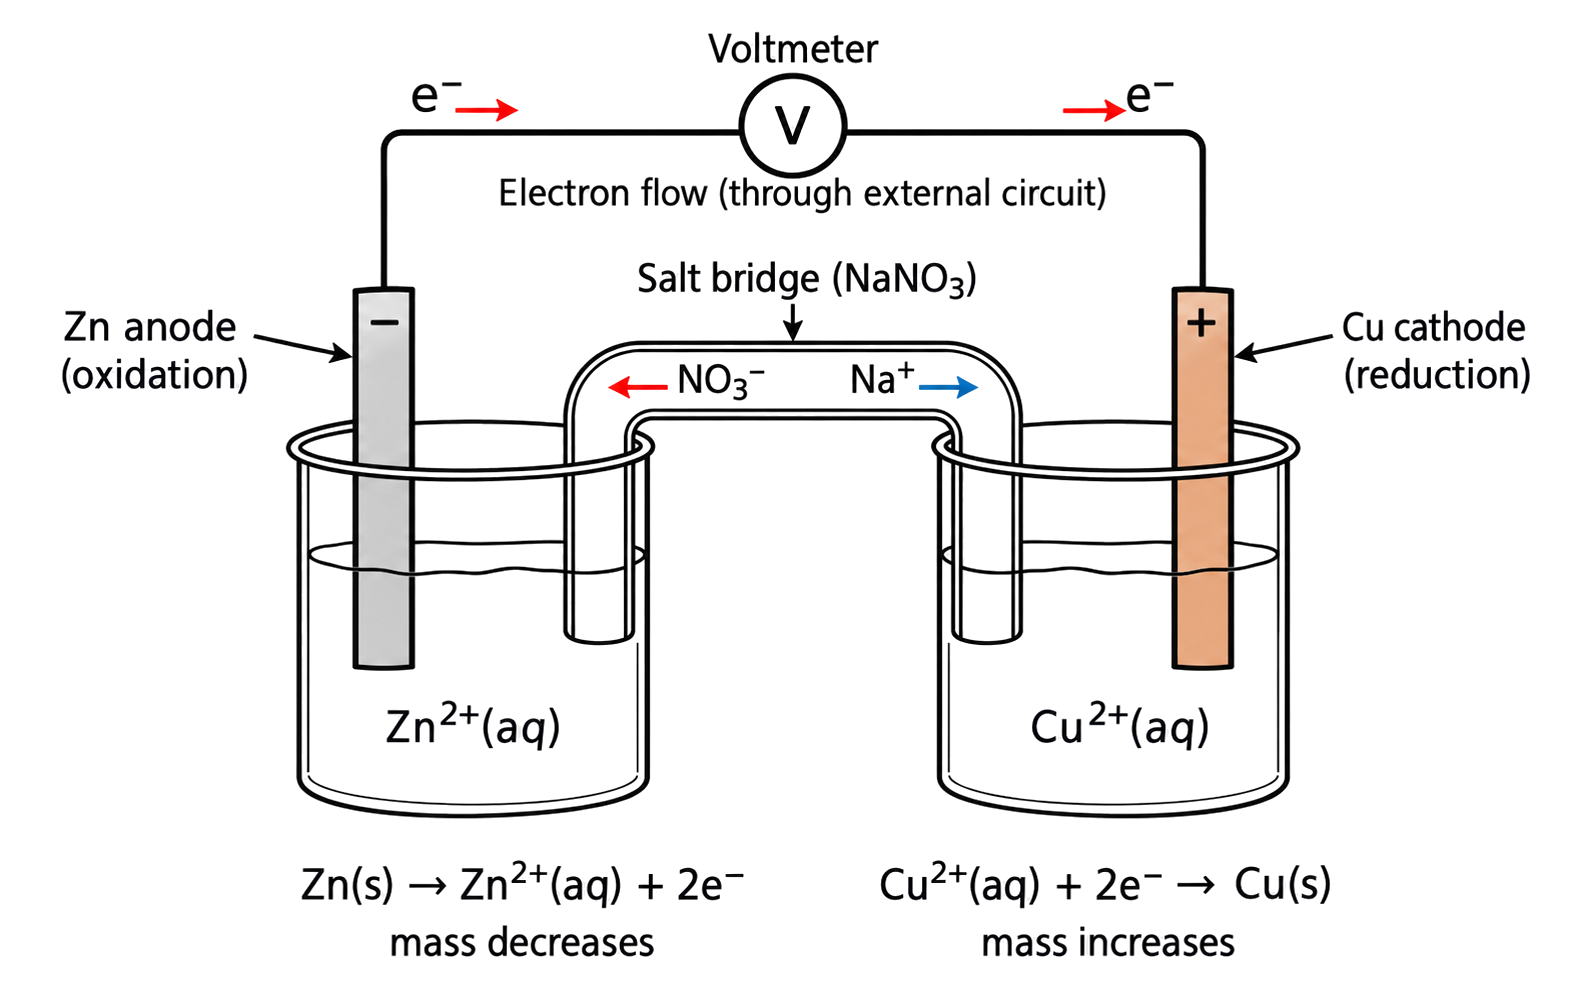
Both half-cells connect to the external circuit and the salt bridge must contact both solutions.
In a Zn|Zn²⁺ || Cu²⁺|Cu cell, Zn is oxidized at the negative anode and electrons travel through the wire to the positive Cu cathode, where Cu²⁺ is reduced. Salt-bridge anions migrate toward the anode compartment and cations toward the cathode compartment to prevent charge buildup; electrons do not flow through the bridge.
In molten salt there is no water: metal ions are reduced to metal at the cathode and anions are oxidized at the anode. For molten chloride, chloride forms chlorine gas.
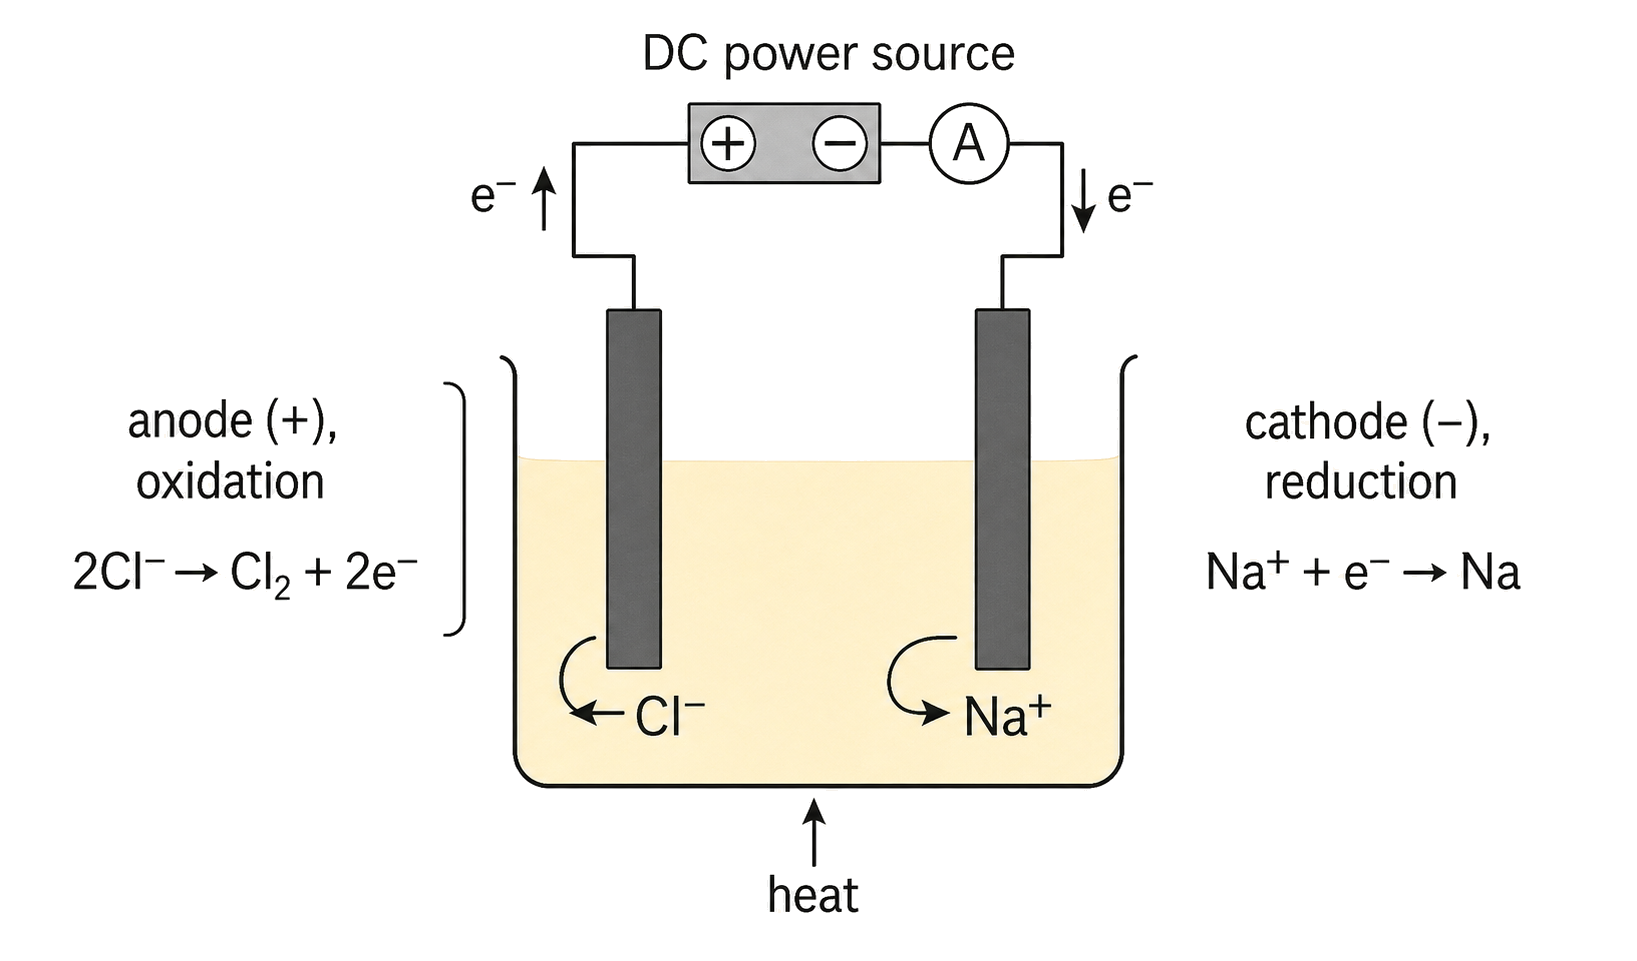
Molten MgCl₂ contains only Mg²⁺ and Cl⁻: Mg²⁺ + 2e⁻ → Mg at the cathode and 2Cl⁻ → Cl₂ + 2e⁻ at the anode. The melt conducts by ion migration; do not introduce H₂, O₂ or water-based competition into a molten-salt question.
A primary alcohol oxidizes to an aldehyde and then a carboxylic acid; a secondary alcohol oxidizes to a ketone. Reflux supports further oxidation to the acid, while distillation can remove an aldehyde.
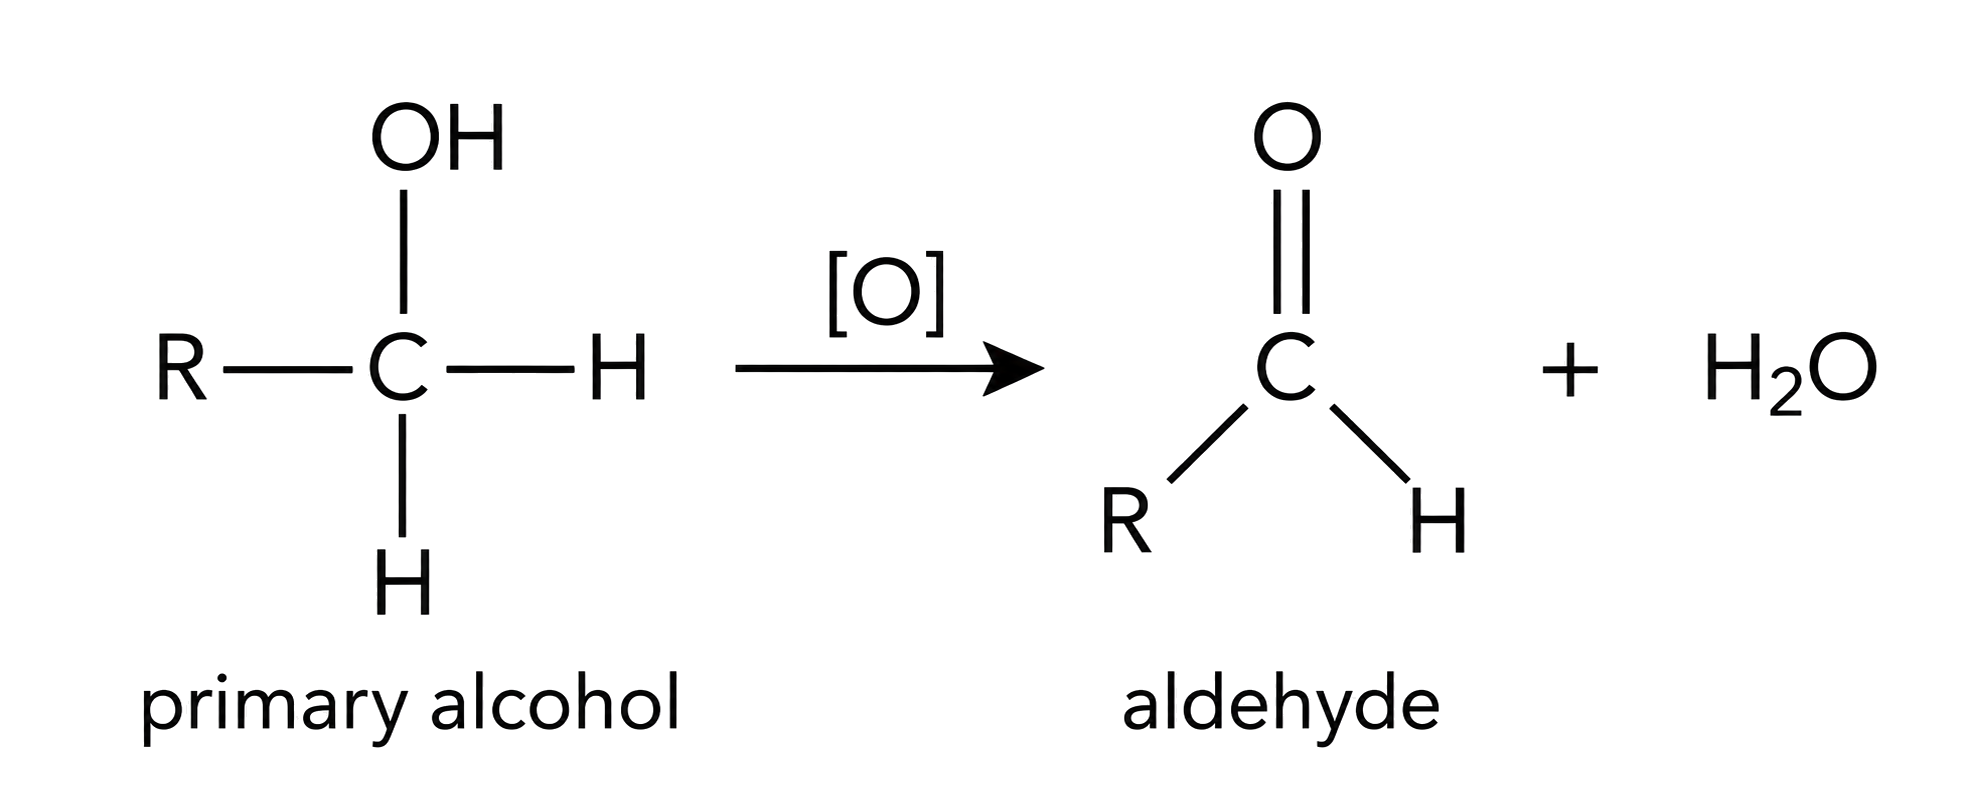
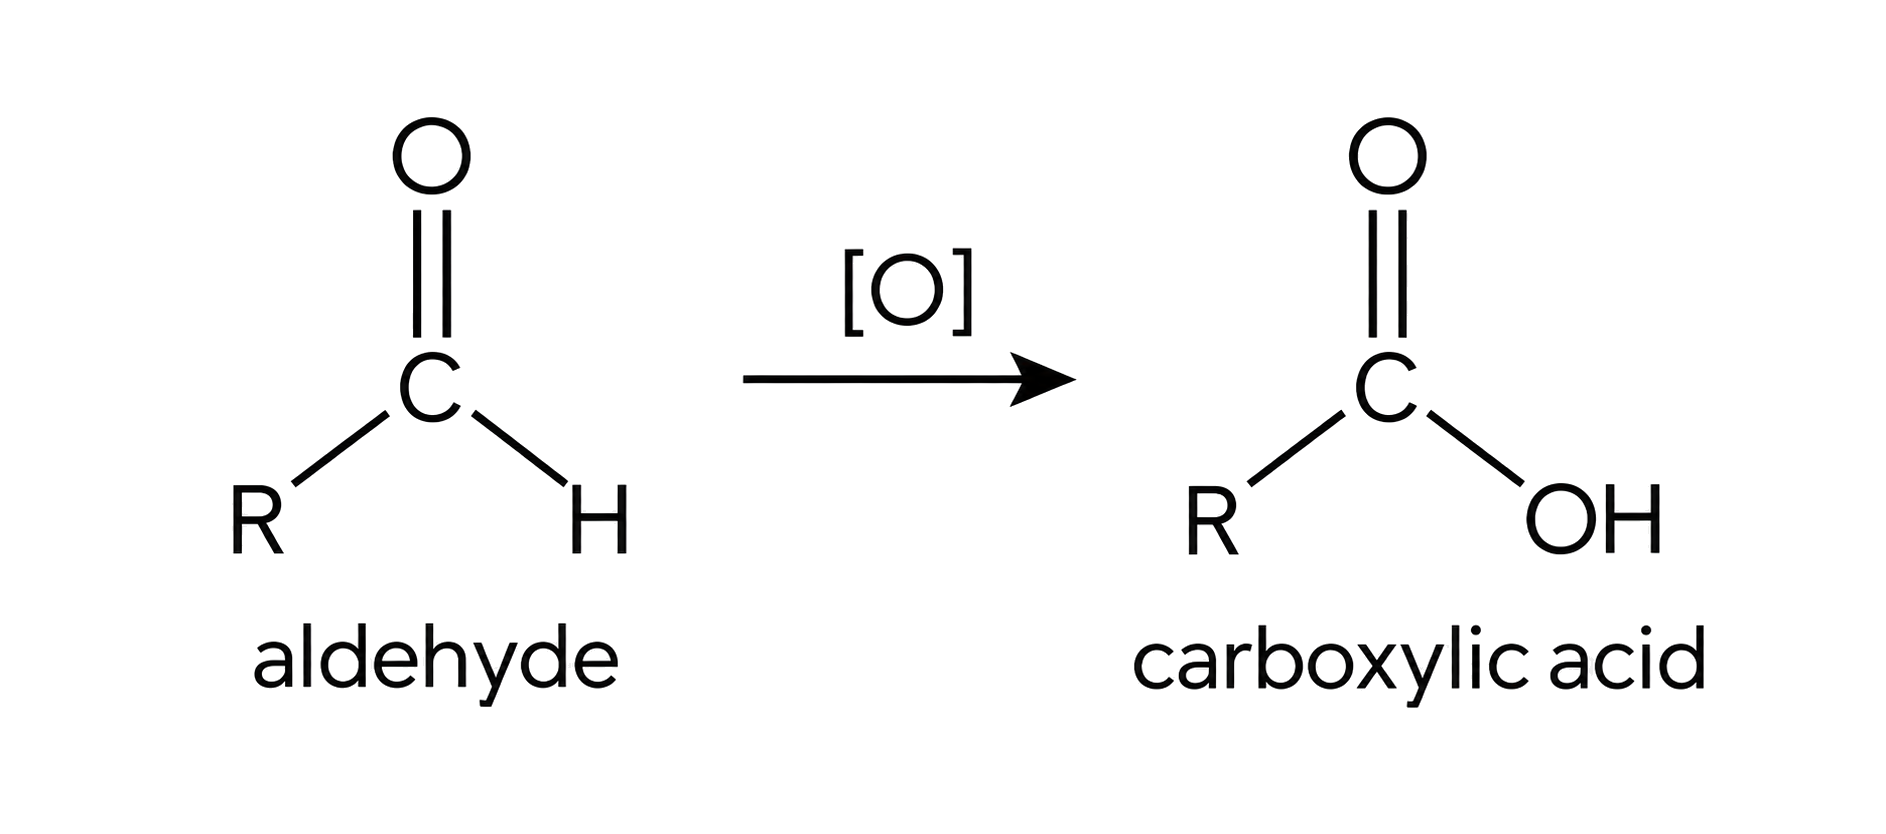
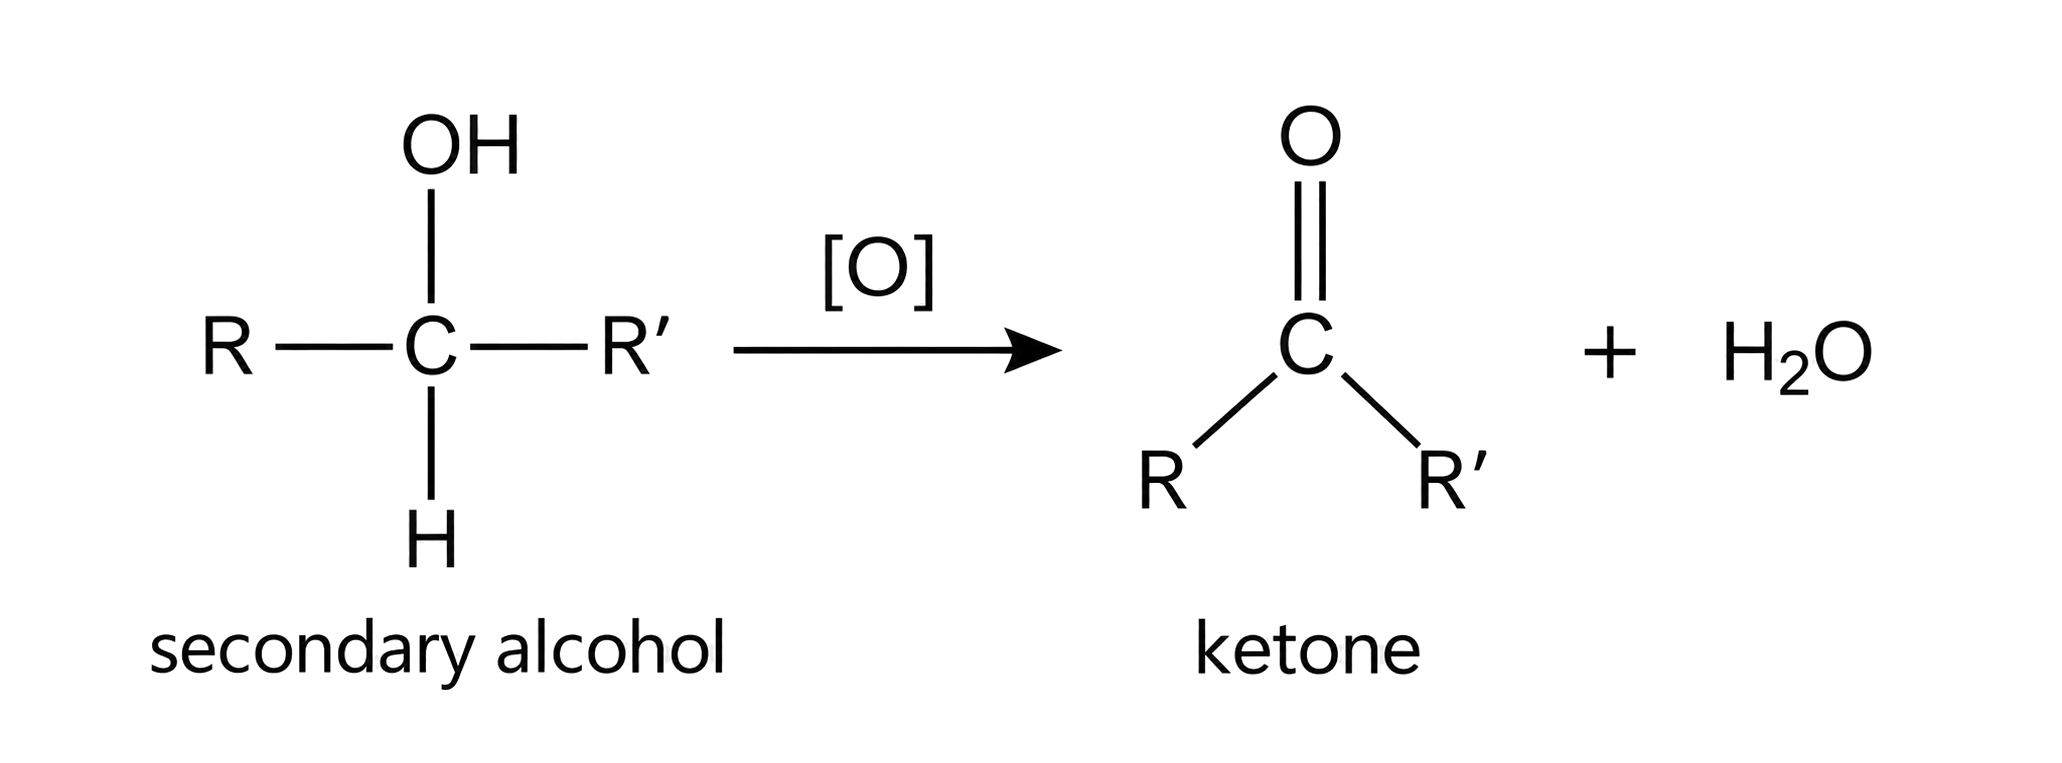
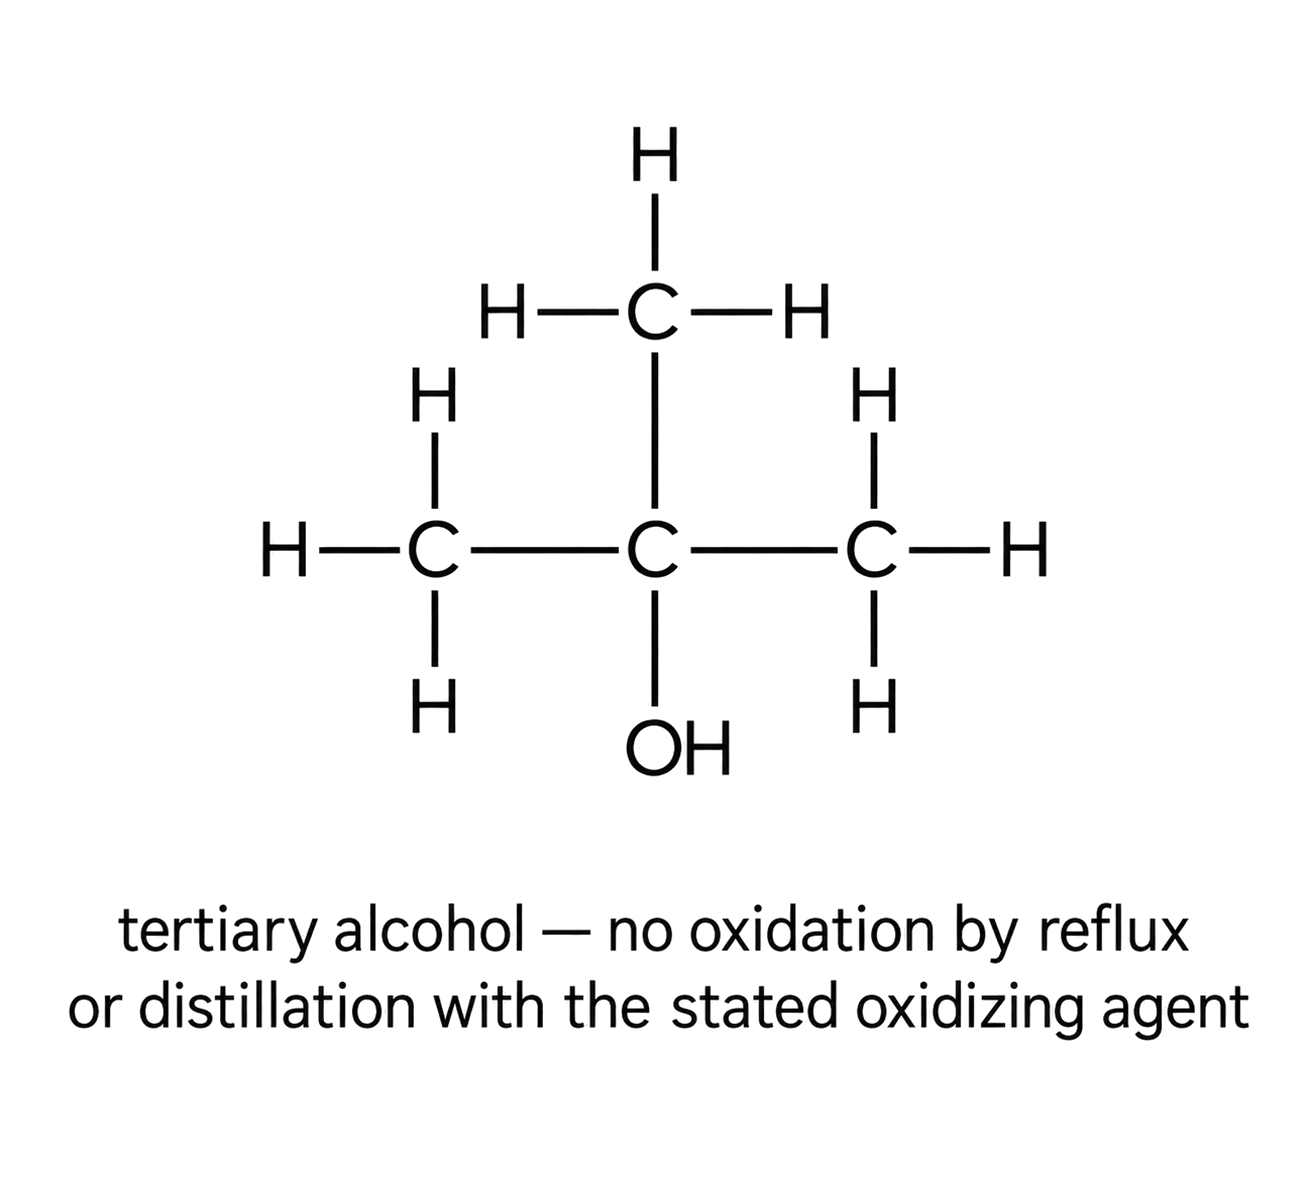
In a primary-alcohol experiment, distil the aldehyde as it forms to limit further oxidation; heat under reflux when the carboxylic acid is required. Tertiary alcohols lack the required hydrogen on the carbon bearing –OH and are not oxidized in the same way.
A carboxylic acid can be reduced through an aldehyde to a primary alcohol; a ketone is reduced to a secondary alcohol. Hydride ions supply the reduction equivalent in these transformations.
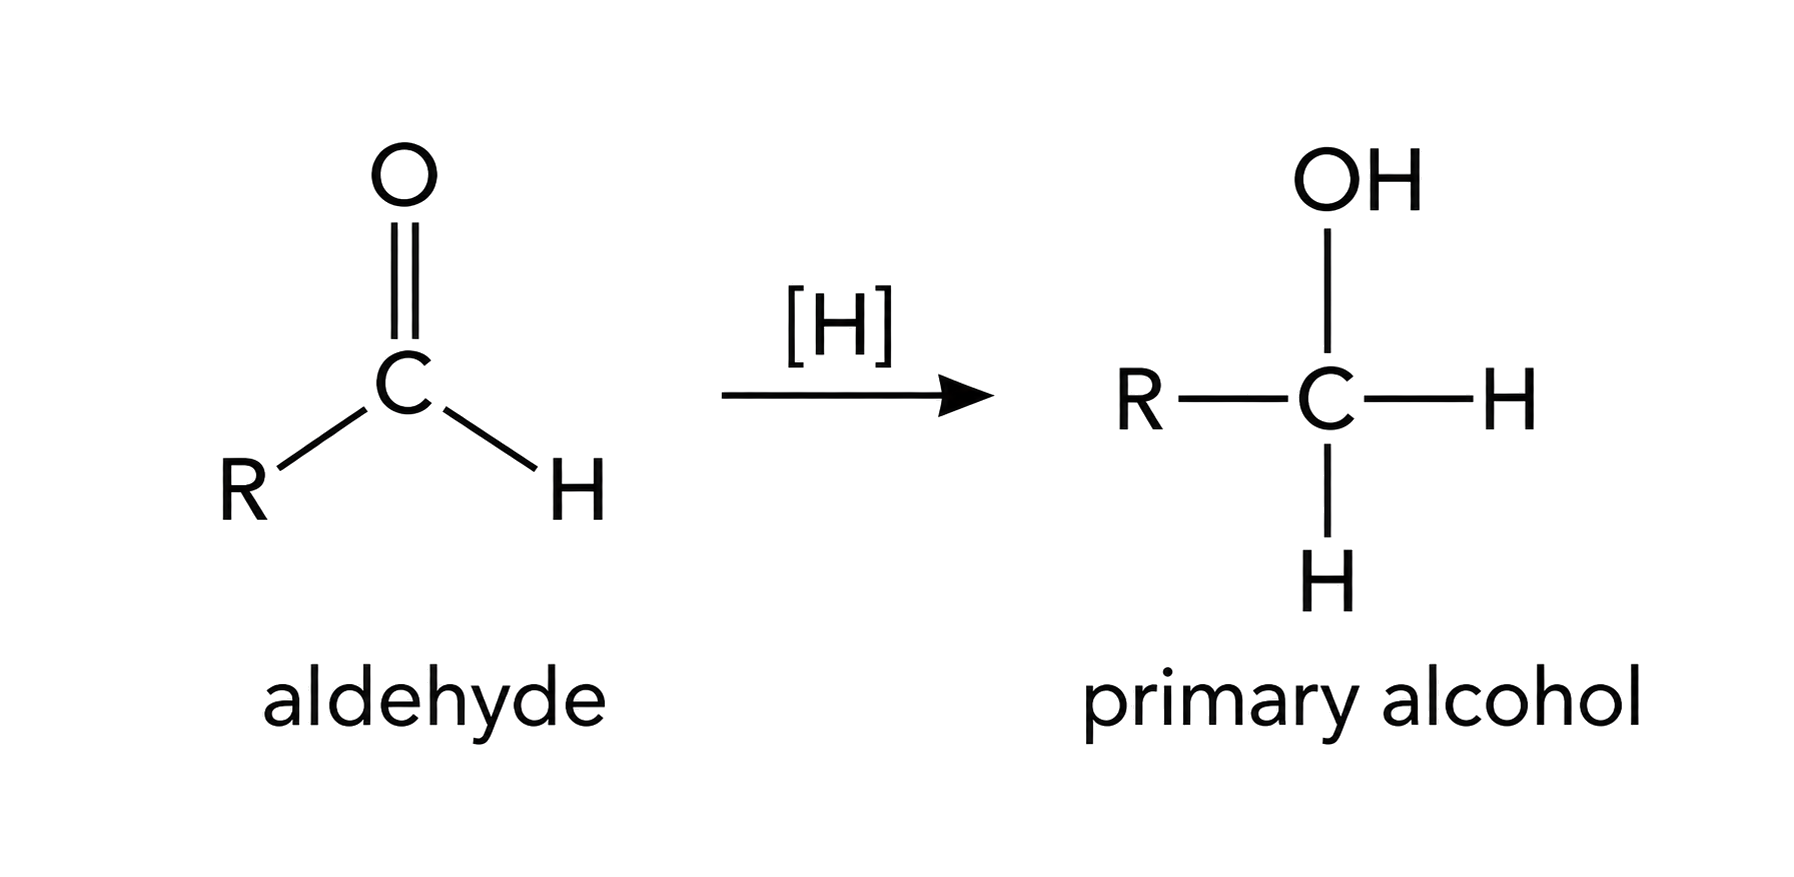
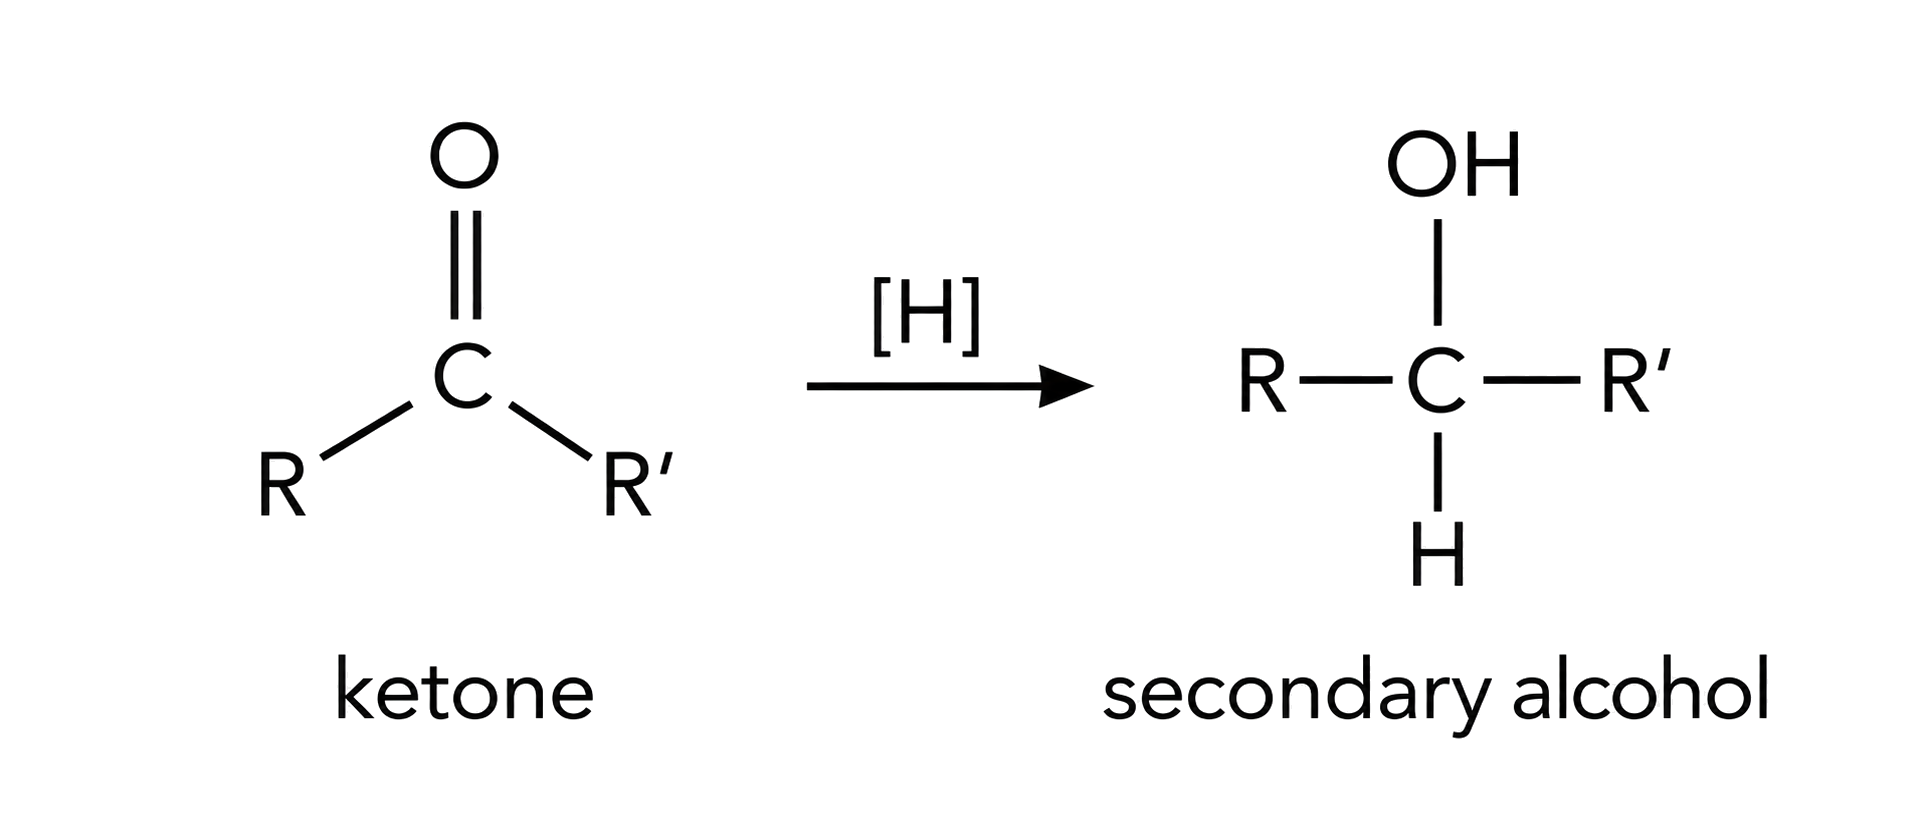
Track the carbon functional group rather than only the reagent: an aldehyde gives a primary alcohol and a ketone gives a secondary alcohol. Hydride supplies an electron-rich H unit to the carbonyl carbon; named reducing agents and detailed mechanisms are outside this objective.
Hydrogenation adds H2 across π bonds. Continue addition until the required saturated product is formed; nickel, palladium or platinum catalysts with heat or pressure are typical conditions.
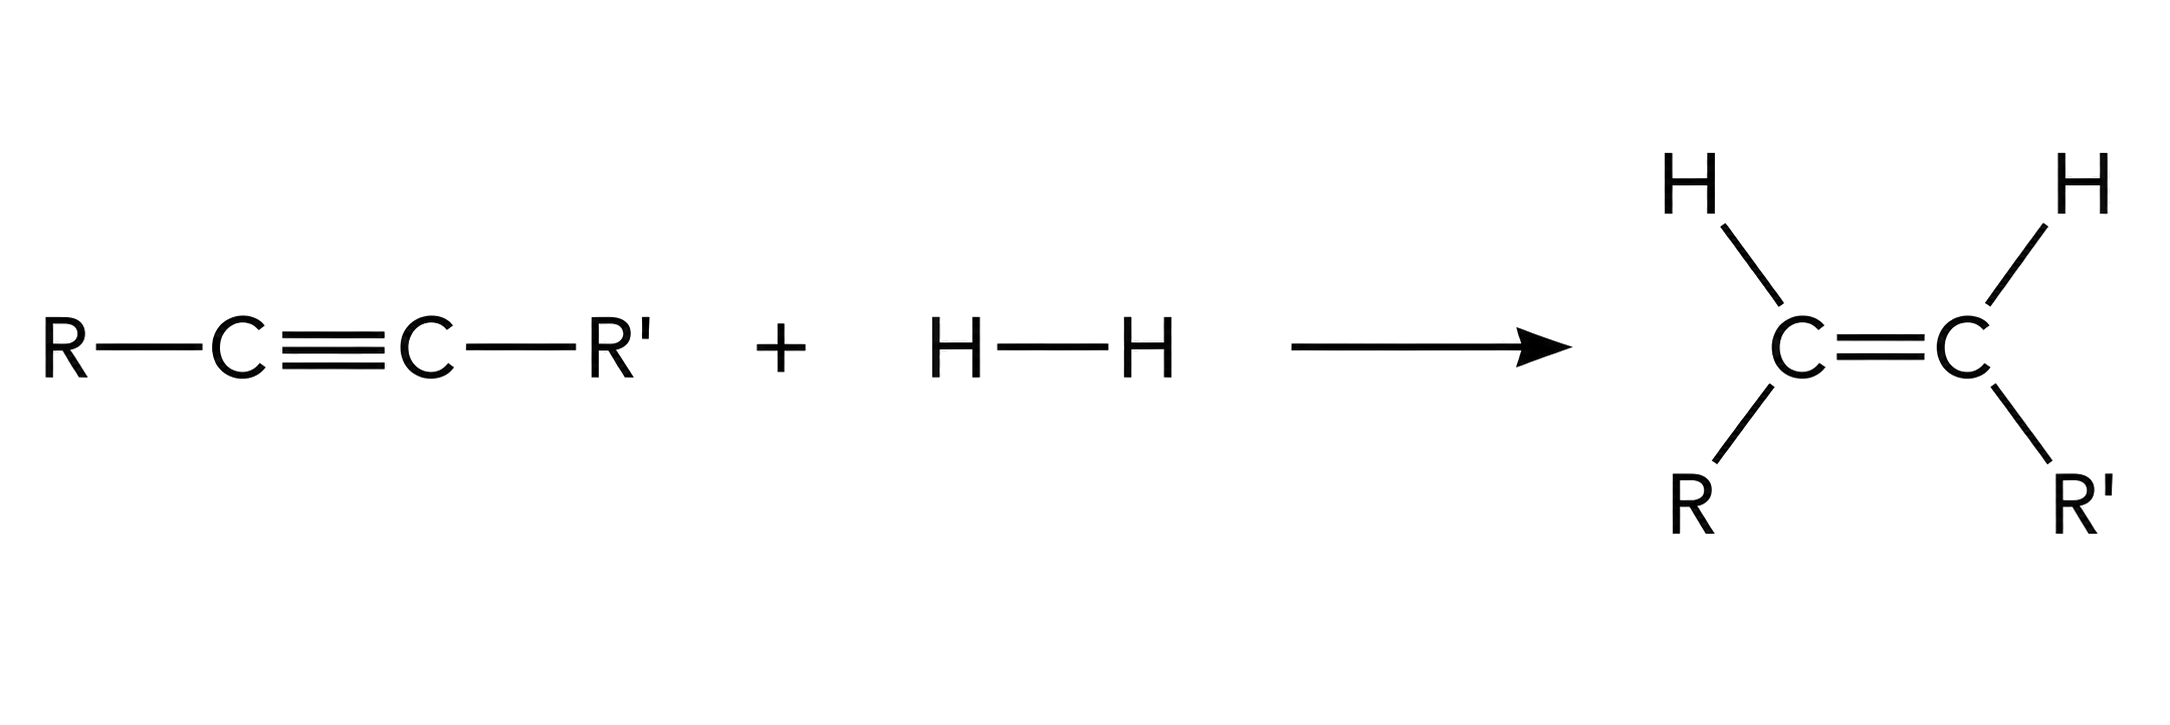
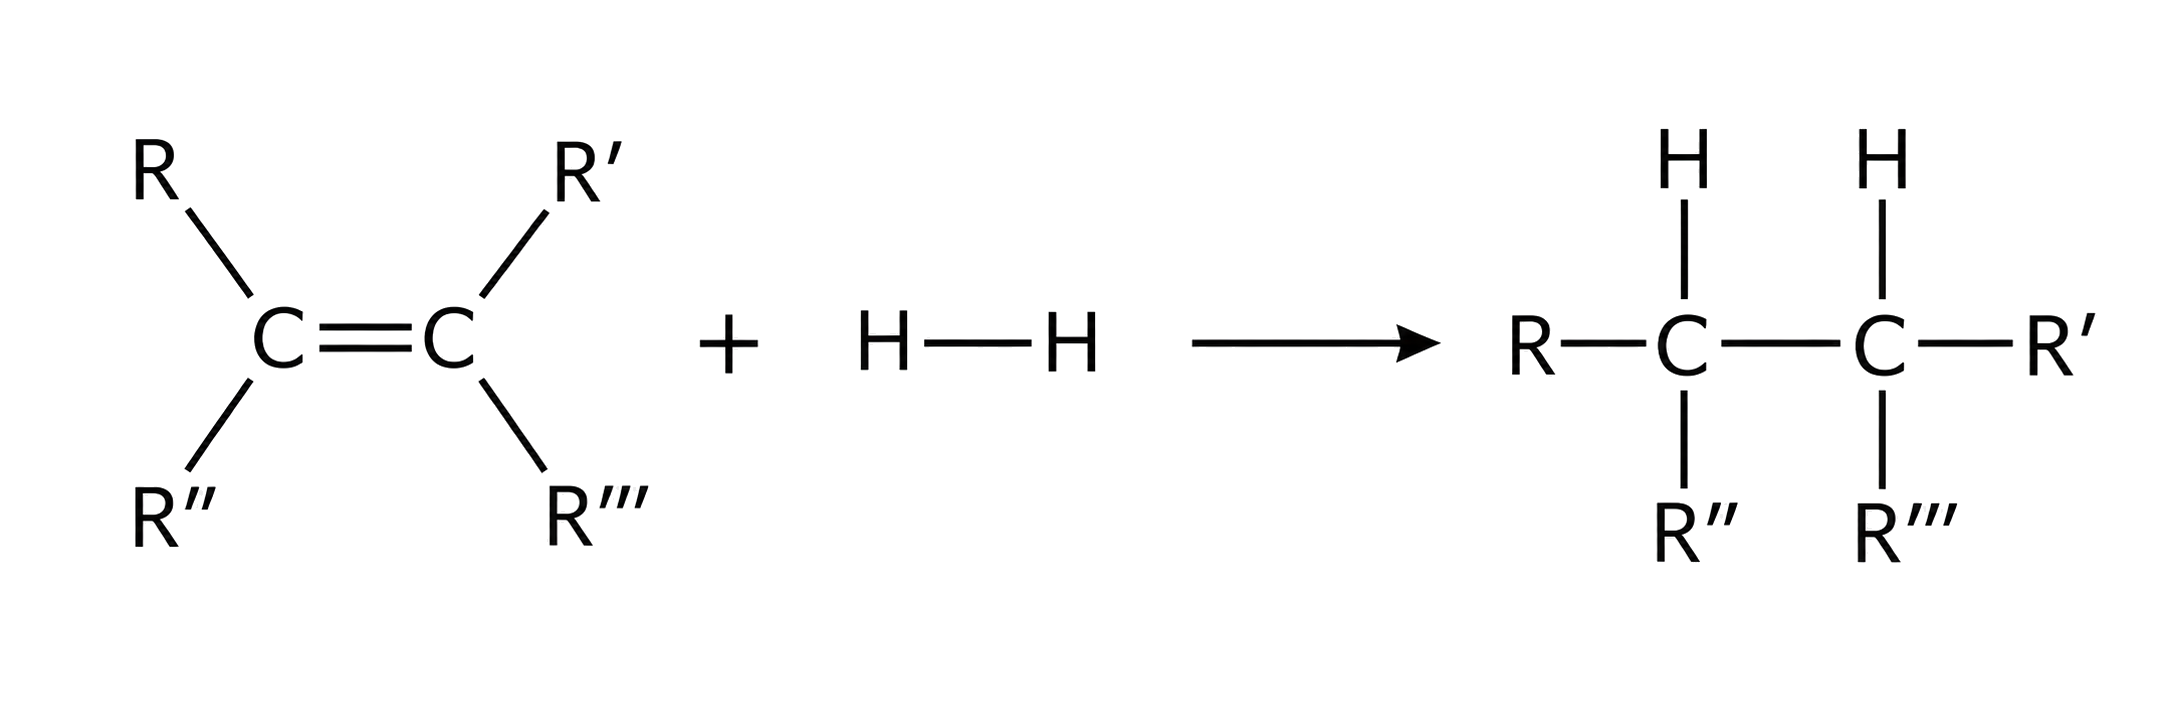
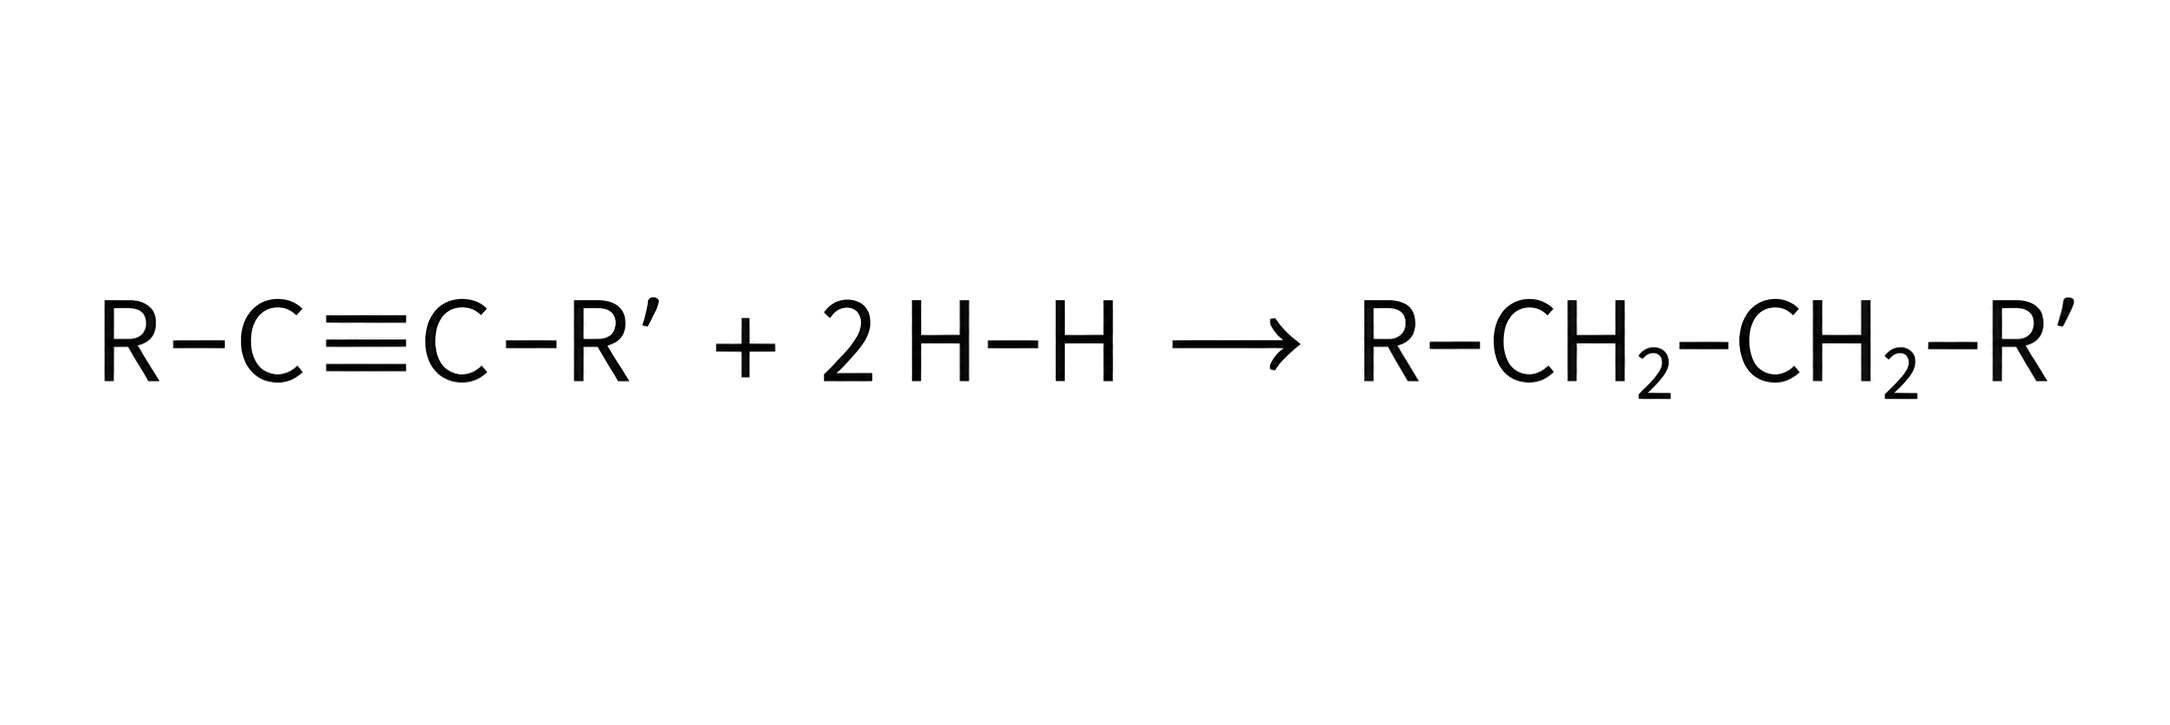
Count π bonds to determine hydrogen demand: one mole of H₂ saturates one C=C, while full conversion of one C≡C to C–C needs two moles of H₂. Keep the carbon skeleton unchanged when drawing the product.
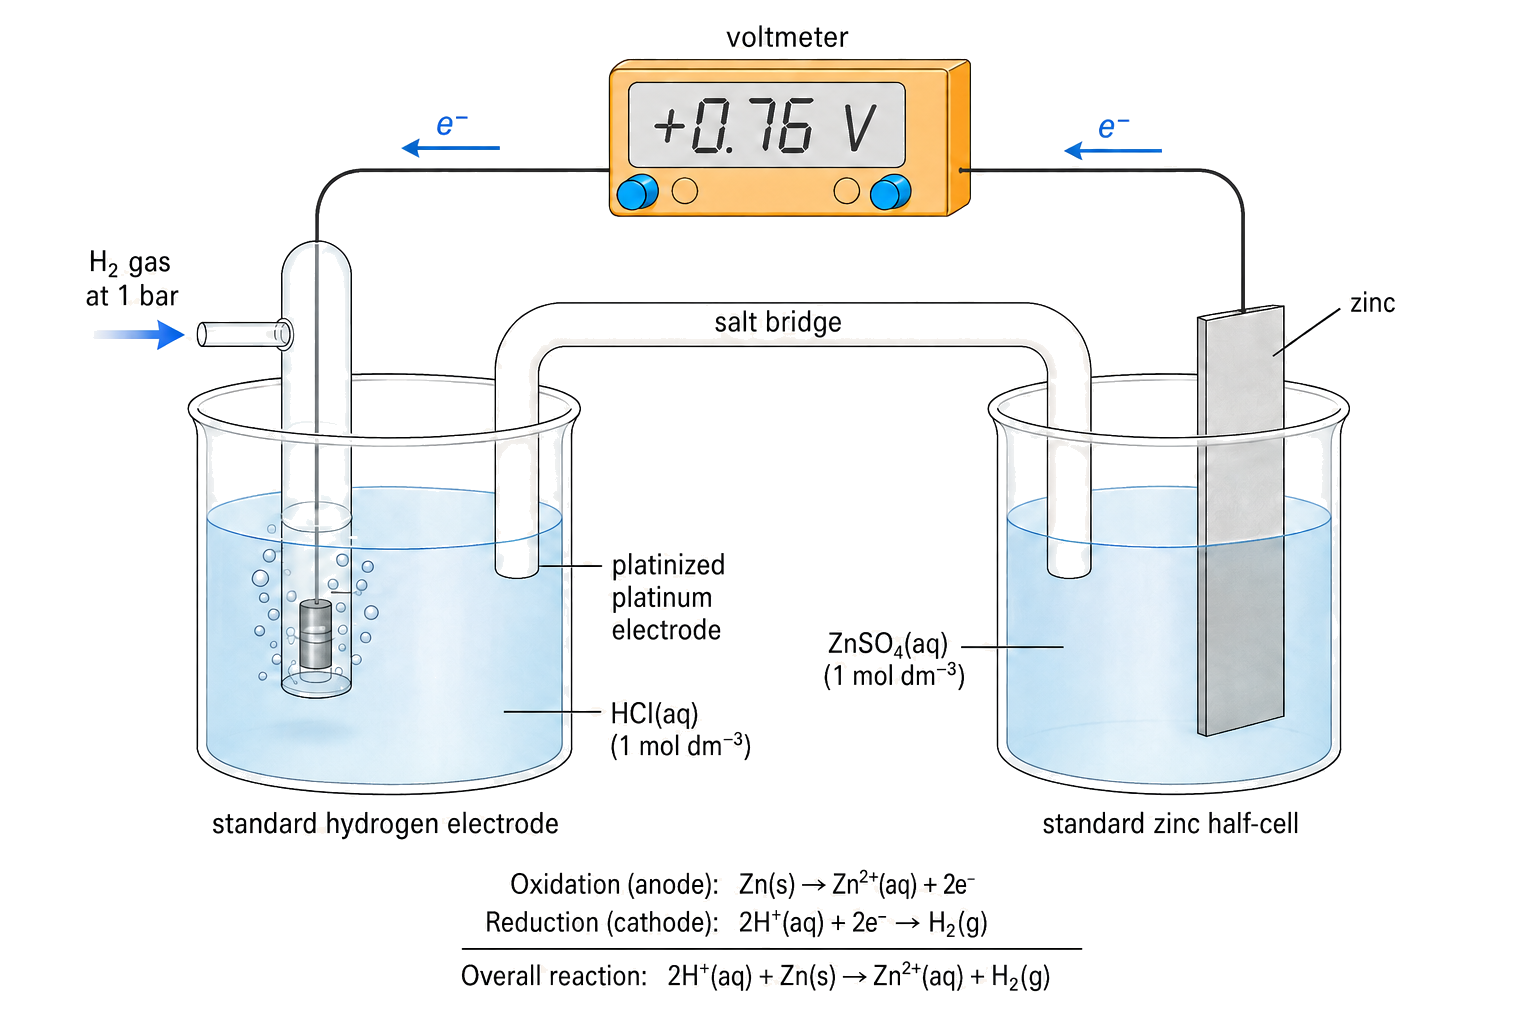
Use reduction-form data: a more positive E° means greater tendency to be reduced and stronger oxidizing behaviour. A very negative metal reduction potential indicates ease of reverse oxidation and strong reducing behaviour.
The standard hydrogen electrode uses H₂(g) at 100 kPa in contact with aqueous H⁺ of unit activity (commonly represented as 1 mol dm⁻³) at 298 K on an inert platinum surface, and is assigned E° = 0.00 V. Pair an unknown half-cell with this reference, use polarity to identify reduction, then interpret more positive reduction potential as stronger oxidizing tendency.
A positive E°cell indicates a spontaneous voltaic direction. Reverse the direction if the calculated sign is negative.
Select the more positive reduction potential as the cathode reaction, keep both tabulated values as reduction potentials, and calculate E°cell = E°cathode − E°anode. Do not multiply an electrode potential when a half-equation is scaled.
Worked example: and . Silver is the cathode, so . The positive result predicts the spontaneous reaction under standard conditions. Do not multiply when doubling the silver half-equation.
At each electrode compare the possible aqueous species using reduction or oxidation tendencies. Water may react instead of sulfate or in dilute halide solution; concentrated halide can be oxidized, while molten salt contains no water.
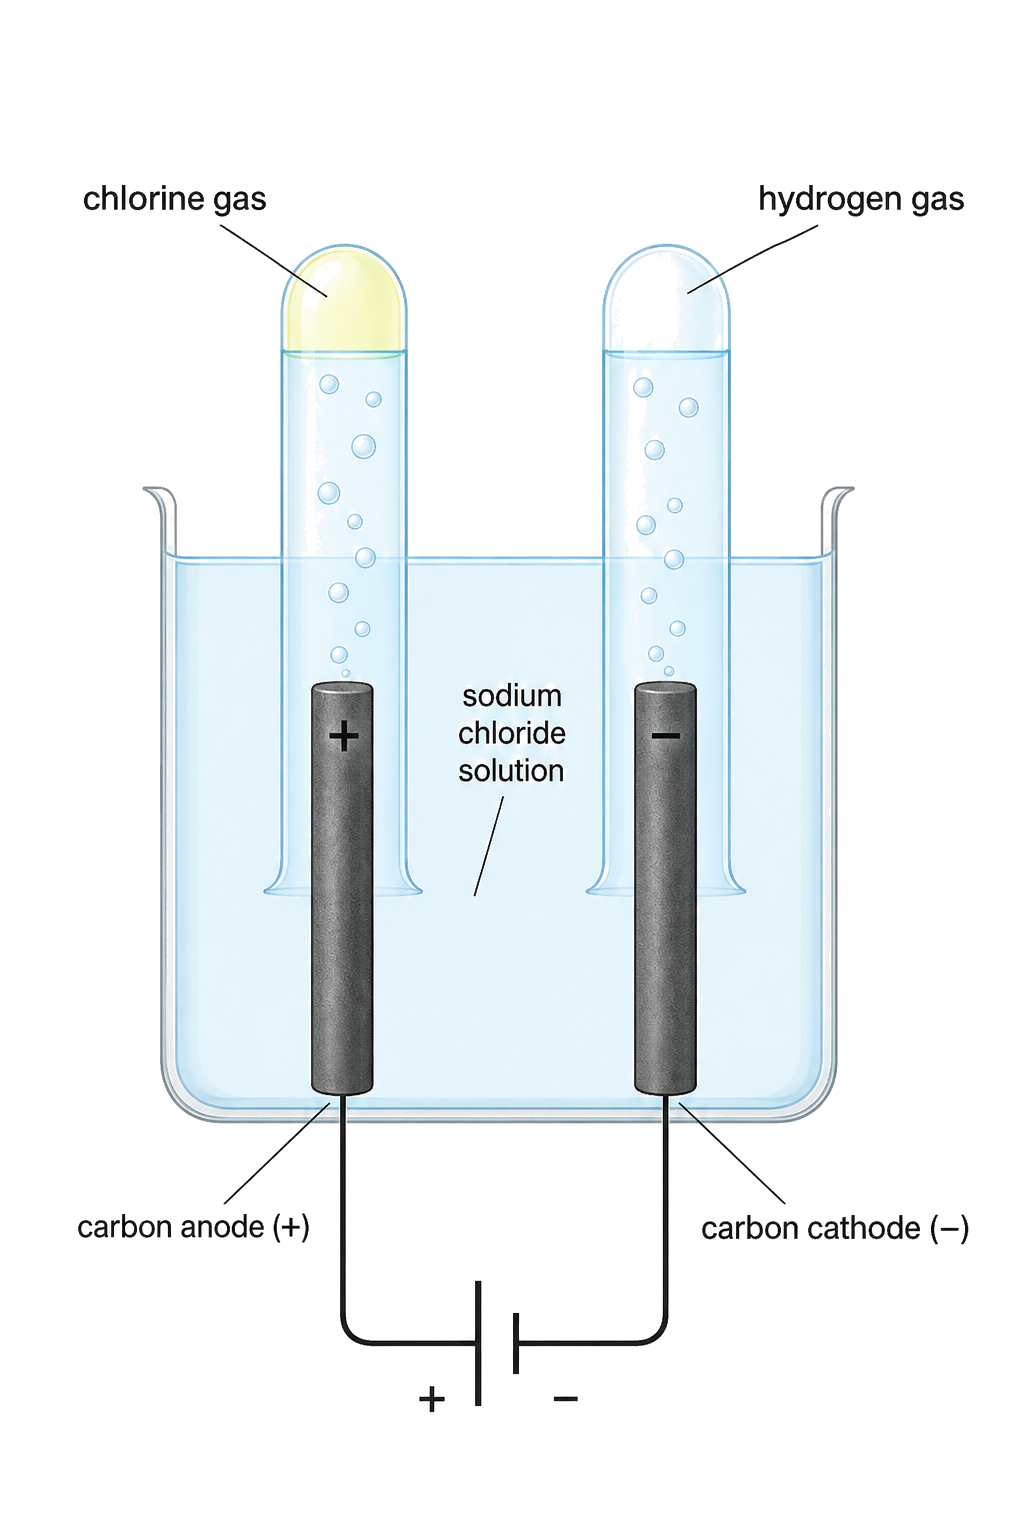
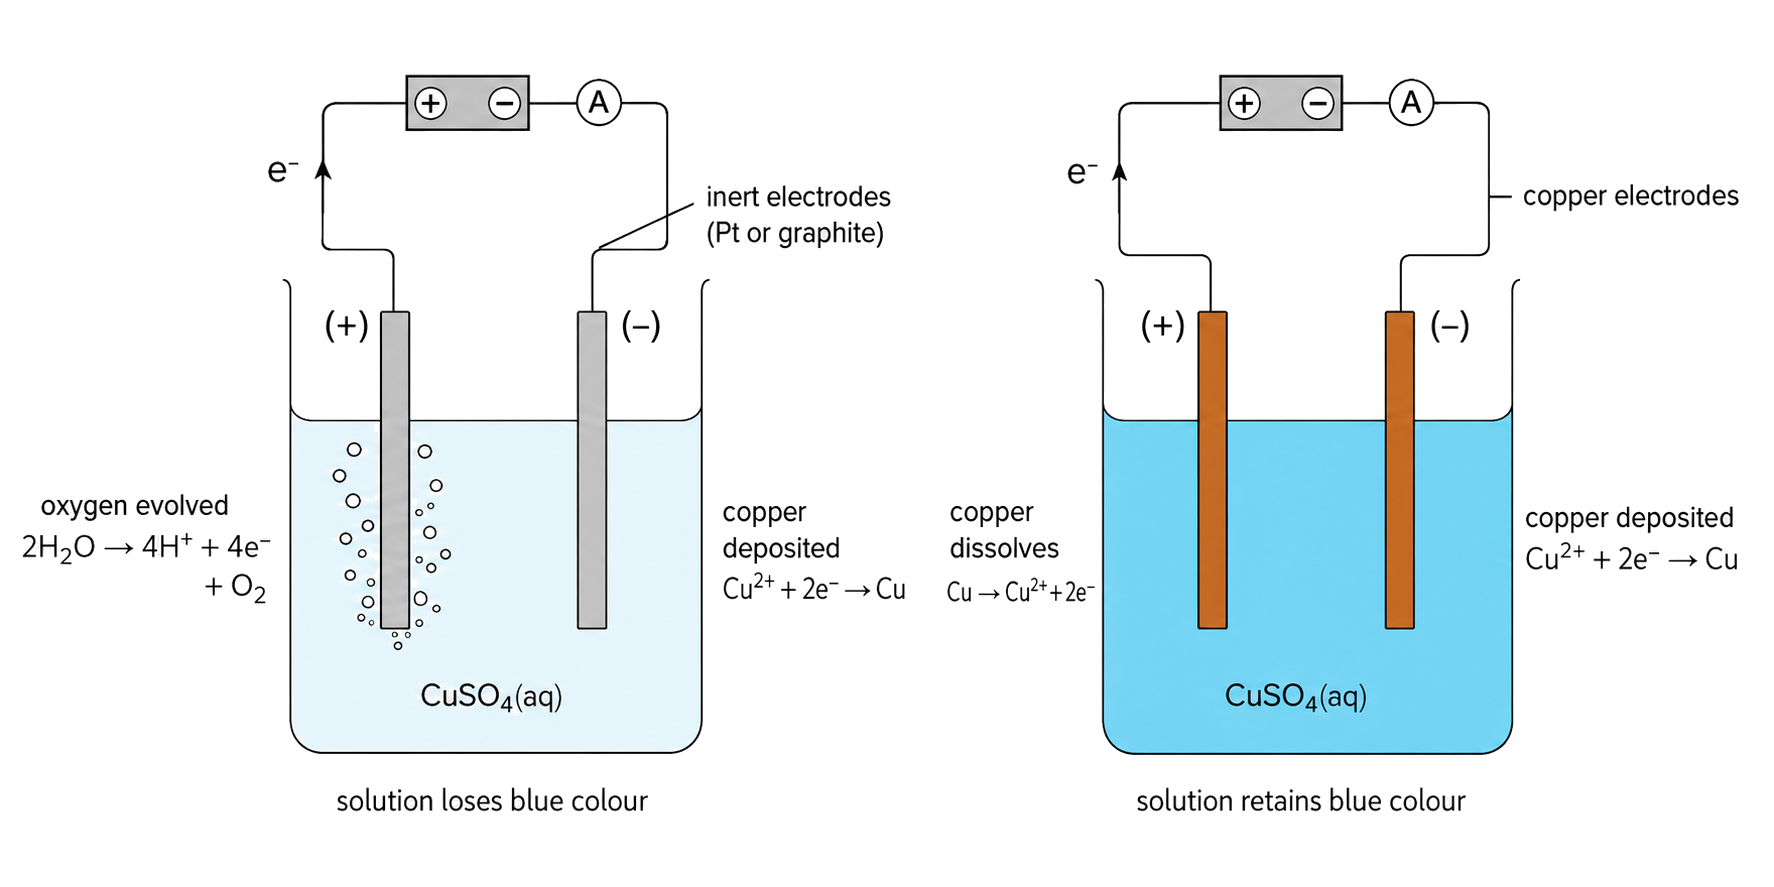
List the solute ion and water as competing possibilities at each electrode, then use electrode-potential data together with stated concentration conditions to select products. In aqueous sulfate, water commonly supplies the anode gas; in concentrated halide, halogen formation may compete. Do not transfer molten-salt products automatically to solution.
The object being coated is the cathode, where coating-metal ions are reduced to metal. Use an electrolyte containing those ions; a coating-metal anode can replenish them.
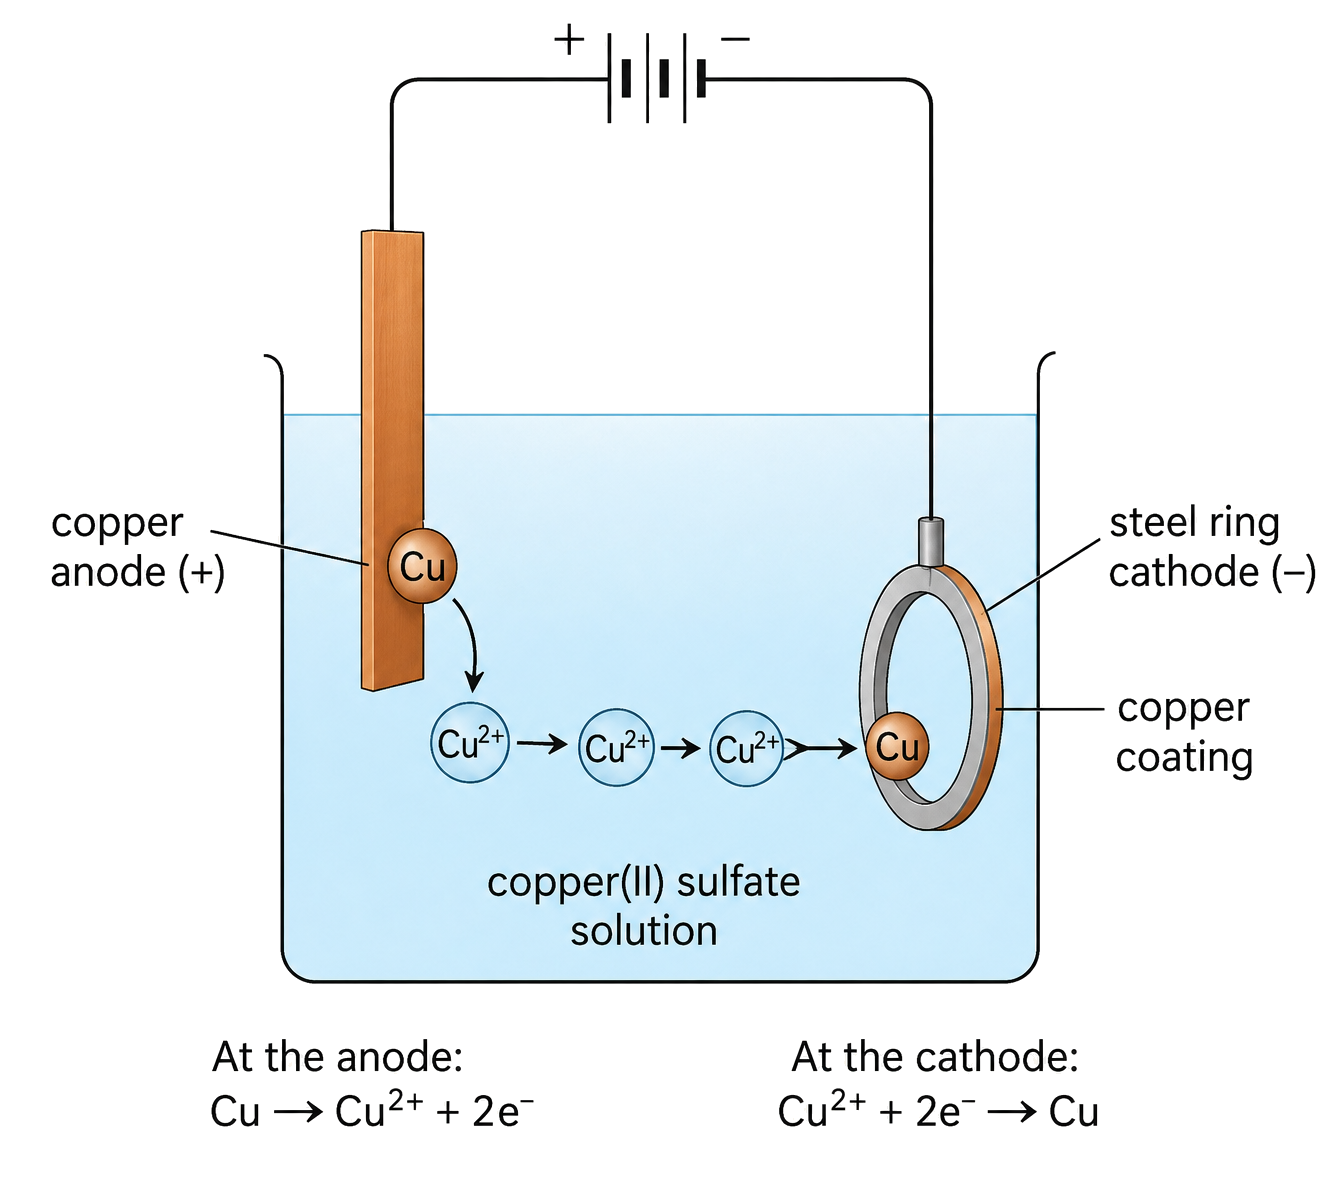
Trace metal atoms through the circuit: M atoms may oxidize at a soluble anode to maintain Mⁿ⁺, while Mⁿ⁺ gains electrons and deposits on the object. Reversing the object to the anode would remove metal rather than coat it.
A radical is a highly reactive species containing an unpaired electron. Show the unpaired electron with a dot next to the atom that carries it.

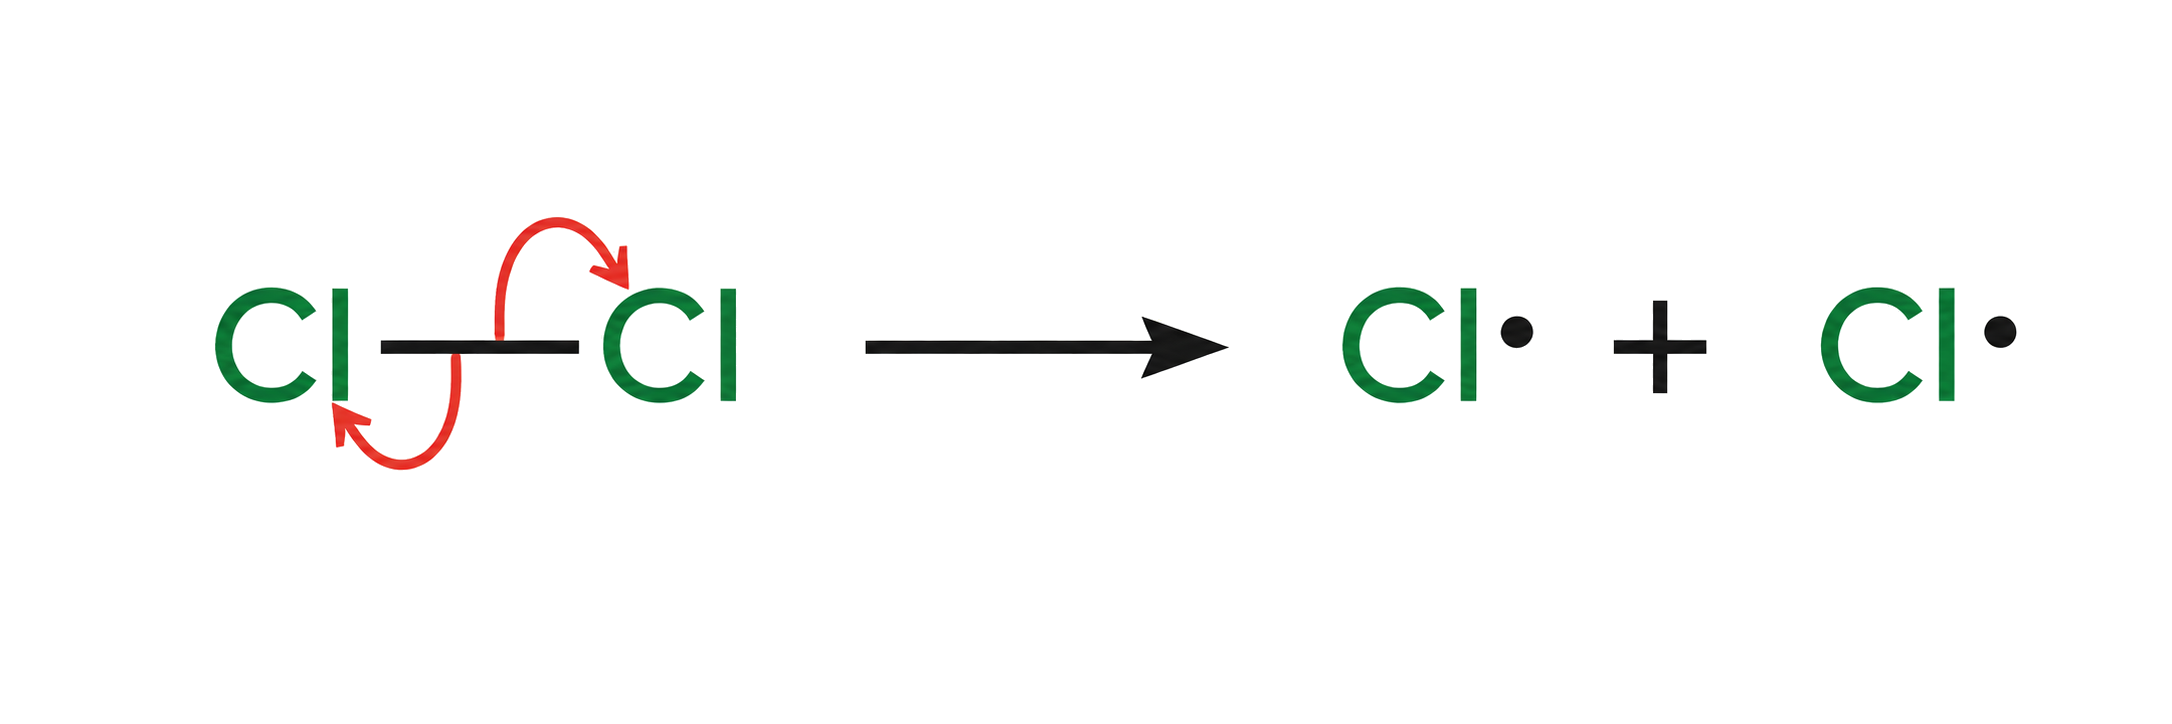
Homolytic fission creates radicals because each covalent-bond fragment retains one bonding electron.
The dot in Cl· or CH₃· represents one unpaired electron, not a positive or negative charge. Radicals react readily because pairing that electron can form a bond; track the dot through every equation so electron and atom accounting remain explicit.
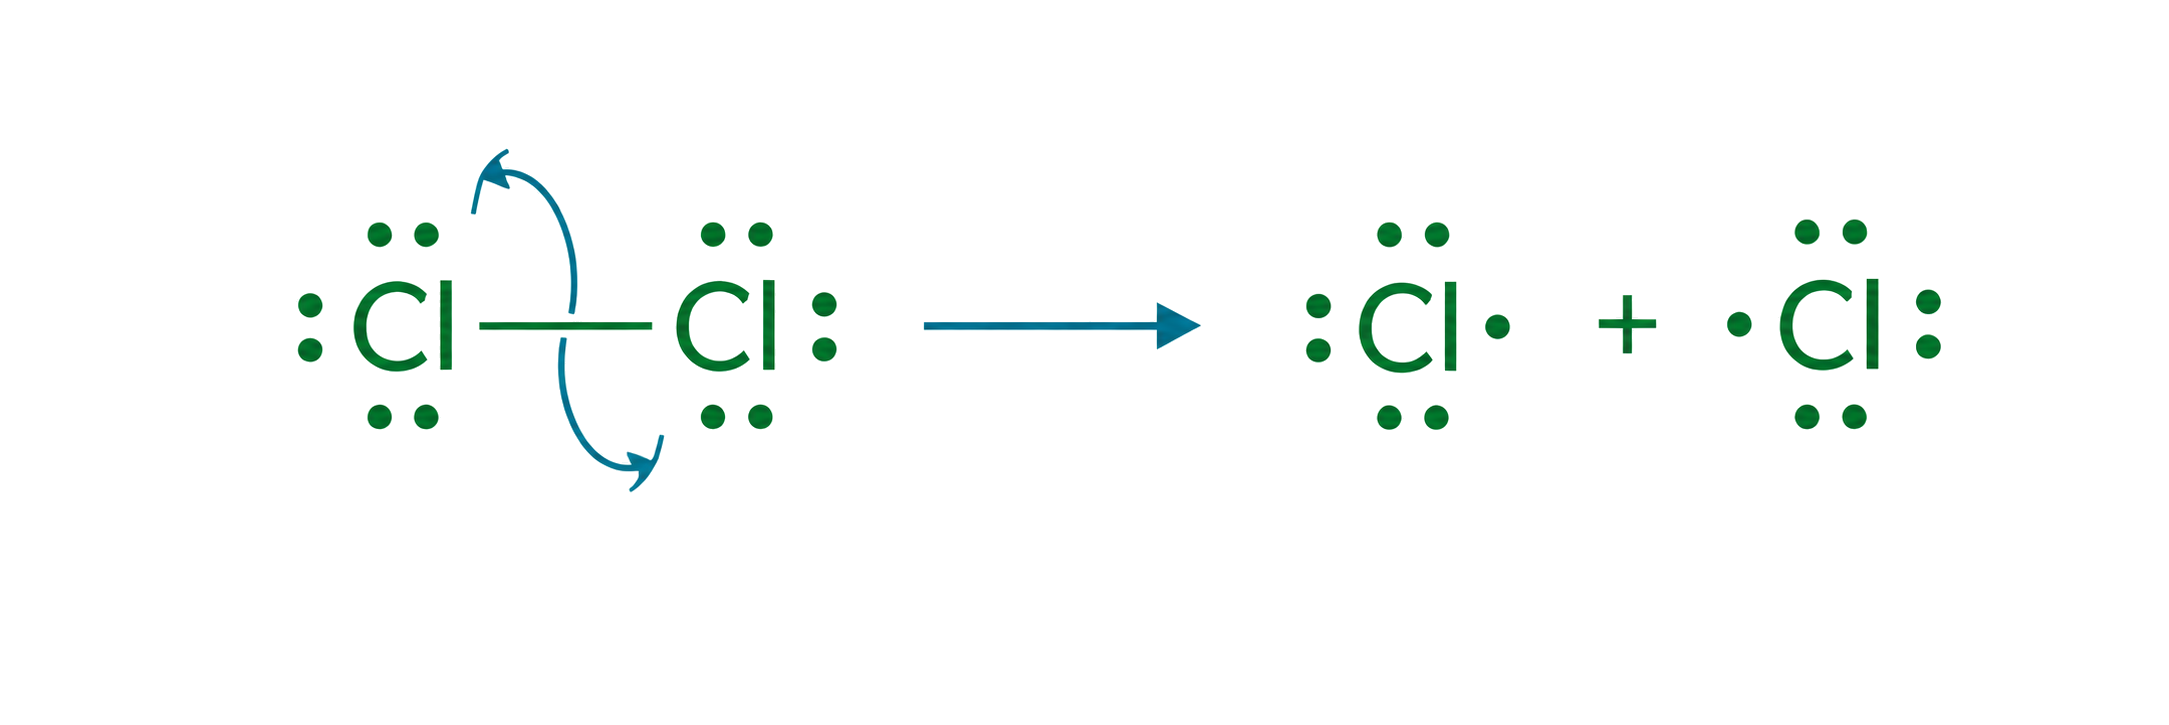
Homolytic cleavage gives one electron to each fragment. Use single-electron arrows to show radical movement in the chain mechanism.
Draw two single-barbed arrows from the breaking X–X bond, one toward each atom, to account for both electrons. The UV or heat step creates radicals and is initiation; a step that consumes one radical and forms another belongs to propagation.
Initiation creates radicals; propagation abstracts H from an alkane and then regenerates the halogen radical; termination combines radicals. A mixture can form because substitution may occur at different positions.
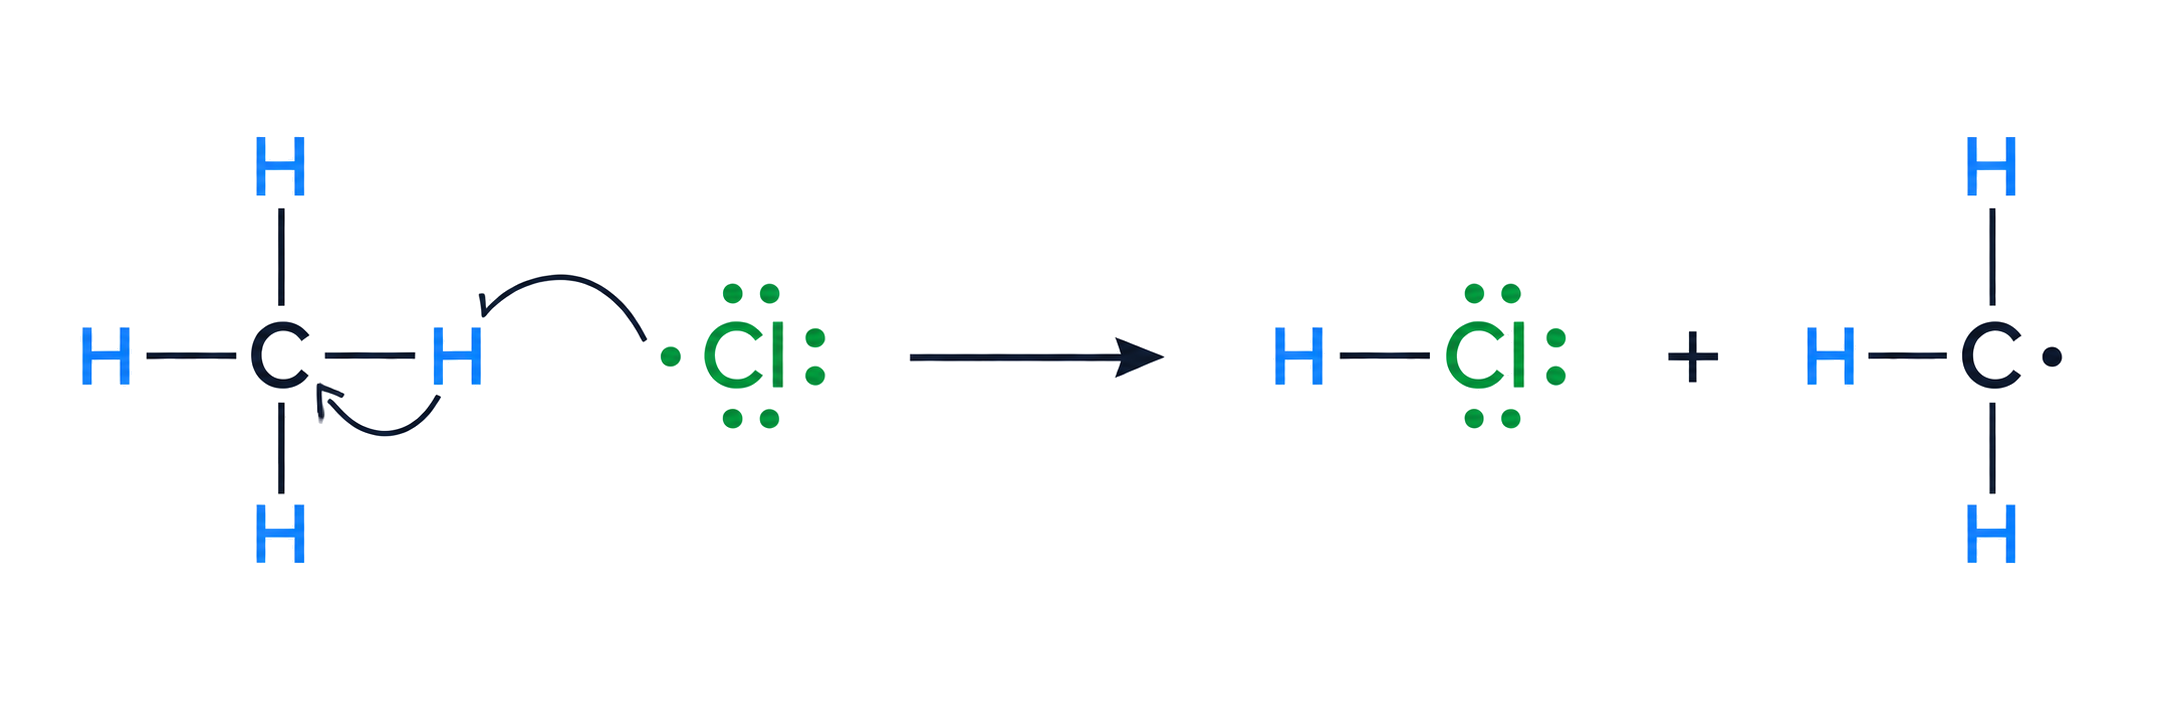
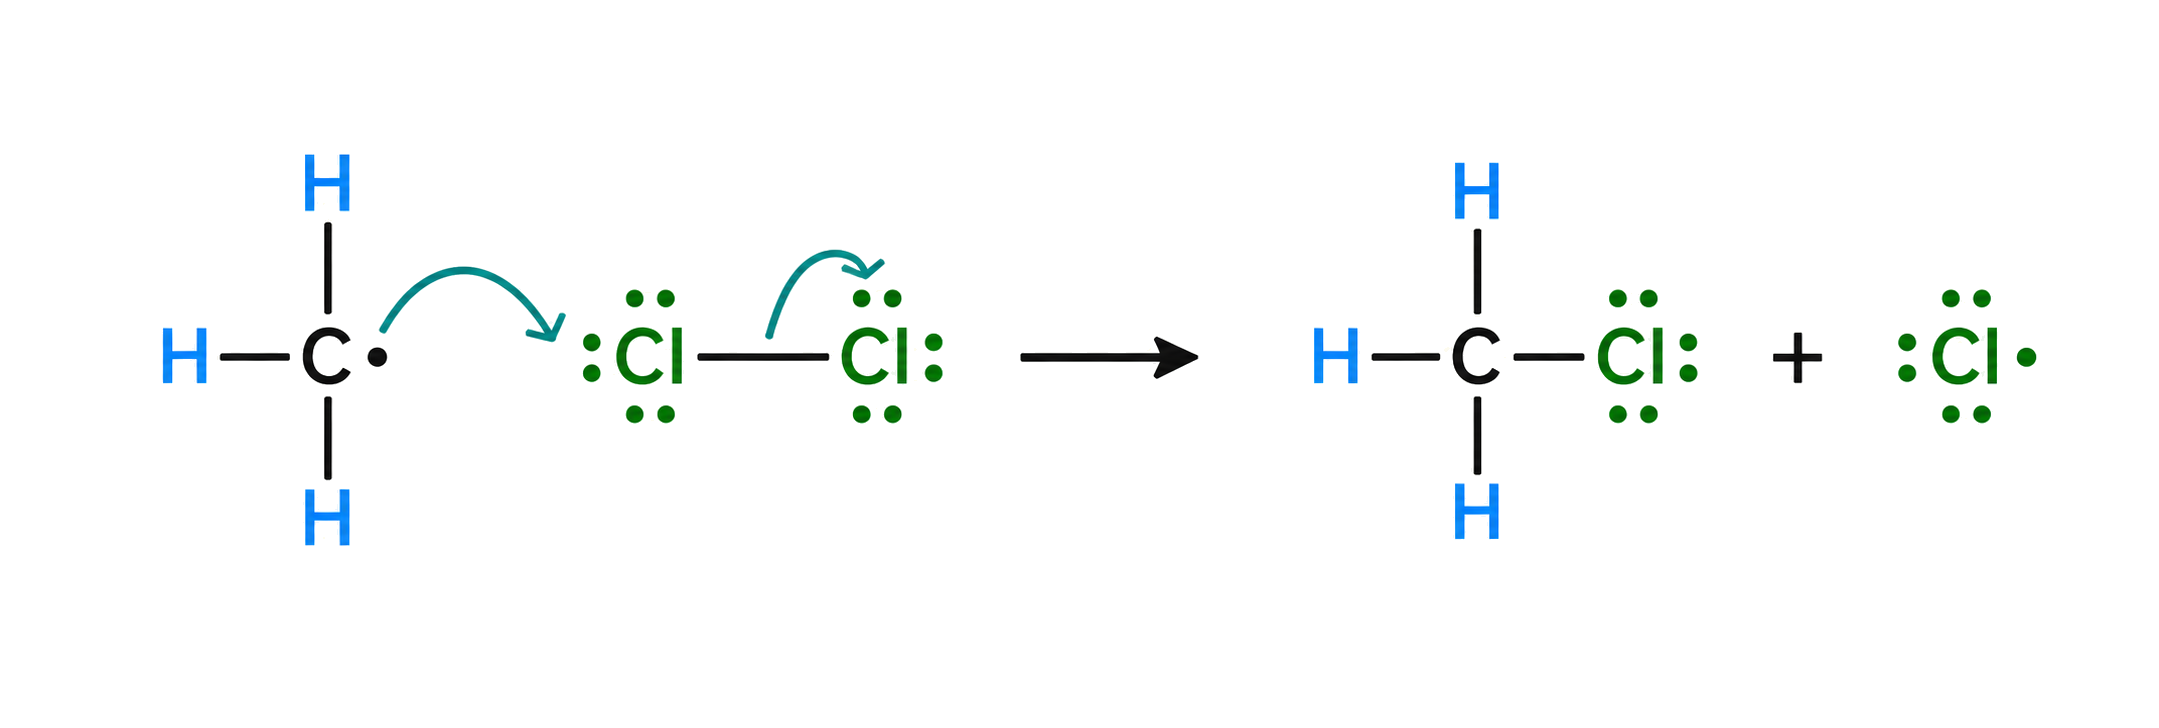
For methane chlorination, initiation forms 2Cl· from Cl₂ under UV. Propagation uses Cl· + CH₄ → HCl + CH₃· and CH₃· + Cl₂ → CH₃Cl + Cl·; termination combines two radicals. Further substitution creates a mixture, so the mechanism does not guarantee only CH₃Cl.
A nucleophile is an electron-rich species that donates an electron pair to an electron-deficient centre.
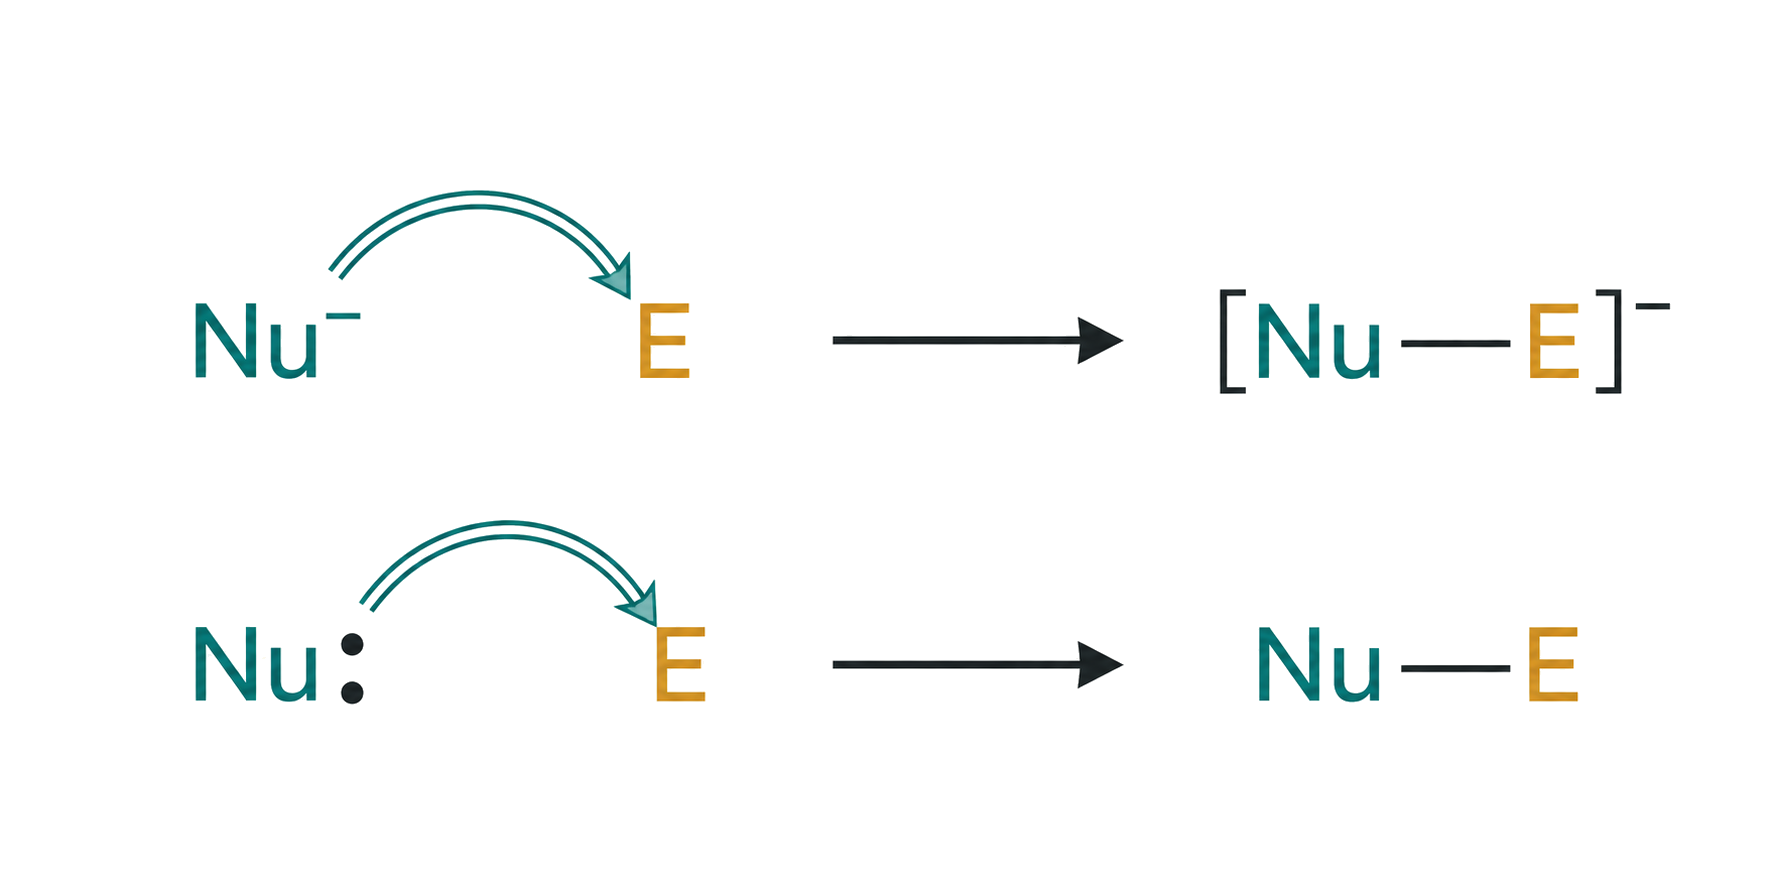
Look for an available electron pair: OH⁻ and CN⁻ use a negative charge and lone pair, while NH₃ uses a lone pair without being an anion. A curly arrow must start at that pair and point toward the atom where the new bond forms.
The nucleophile donates a pair to carbon while the leaving group departs with its bonding pair. Deduce the product by replacing the leaving group with the nucleophile.
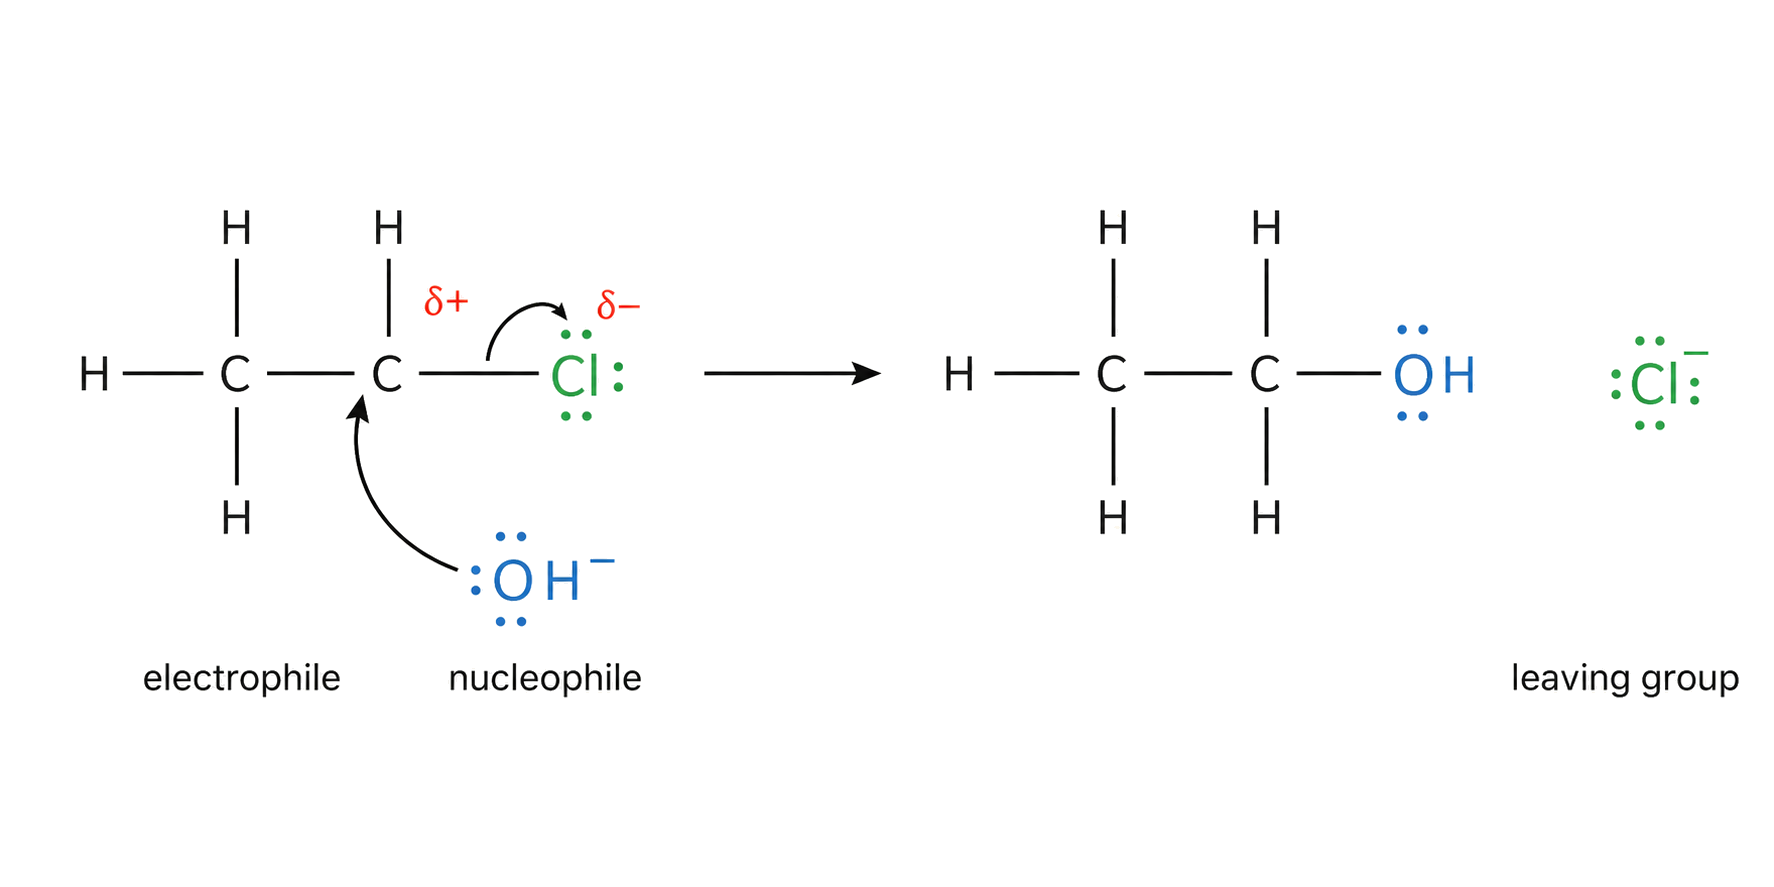
For CH₃CH₂Br + OH⁻, the C–O bond forms as the C–Br bond breaks, giving CH₃CH₂OH + Br⁻. Account for charge and every atom in the product; the leaving group takes the bonding pair rather than departing as a neutral bromine atom.
In heterolytic fission both bonding electrons remain with one fragment, producing ions. Curly arrows show movement of an electron pair.
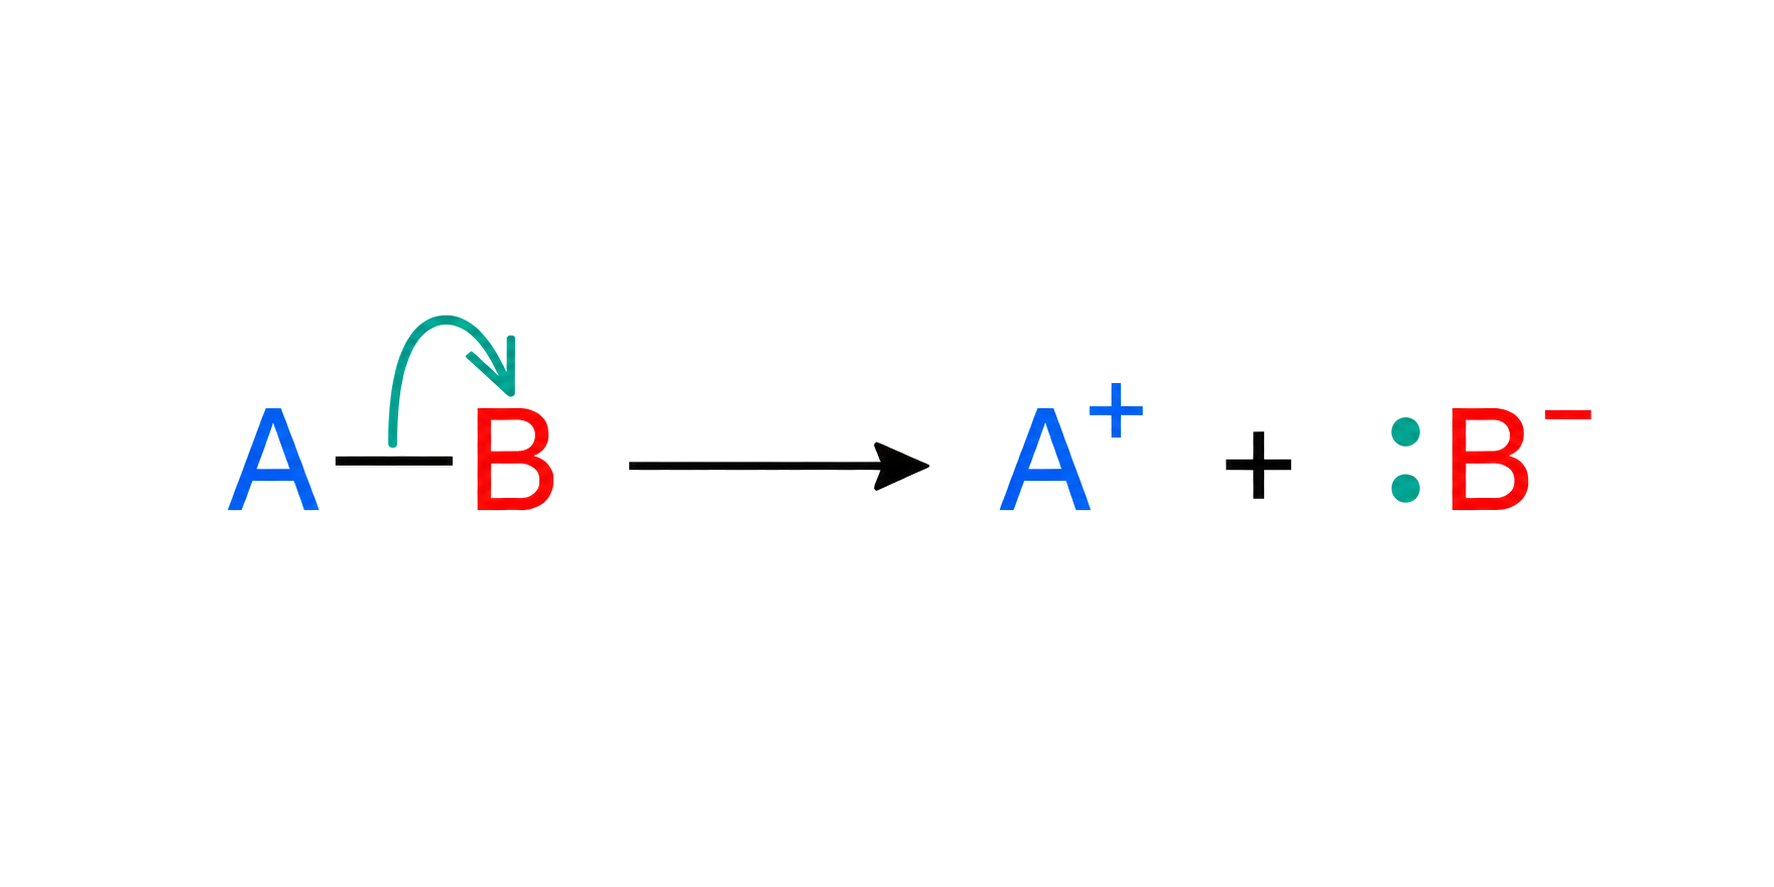
Place the curly-arrow tail on the bond being broken and its head on the fragment receiving both electrons. Then assign charges from electron ownership: heterolysis creates ions, unlike homolysis, which gives one electron to each radical.
An electrophile is an electron-deficient species that accepts an electron pair from a nucleophile.
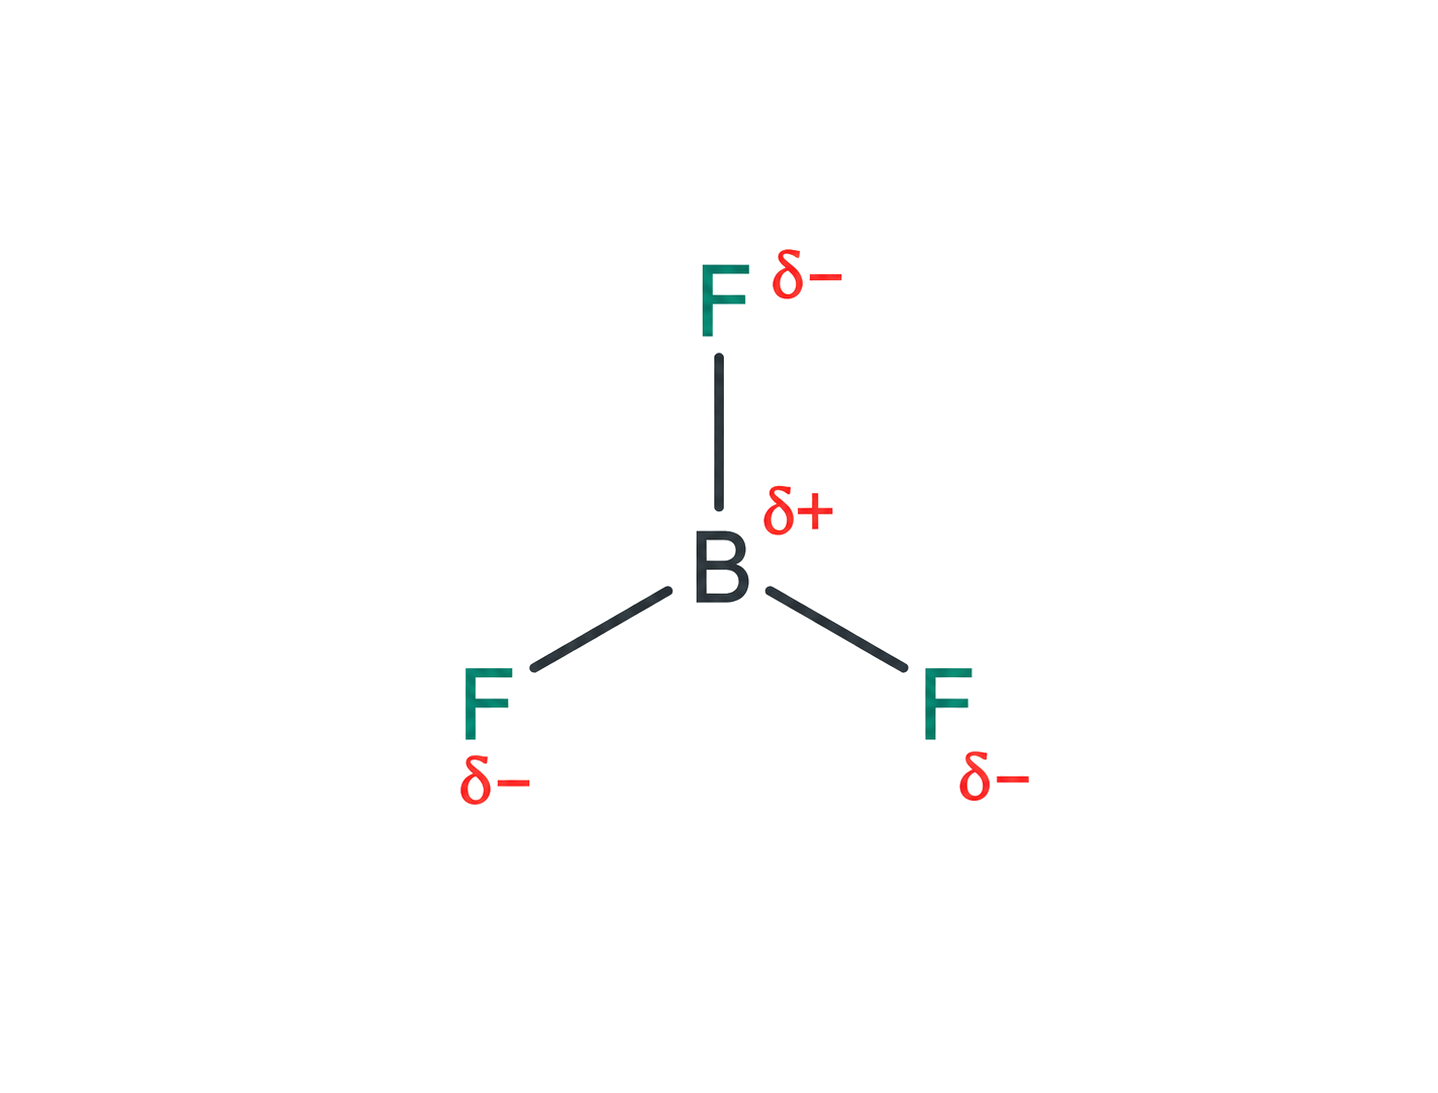
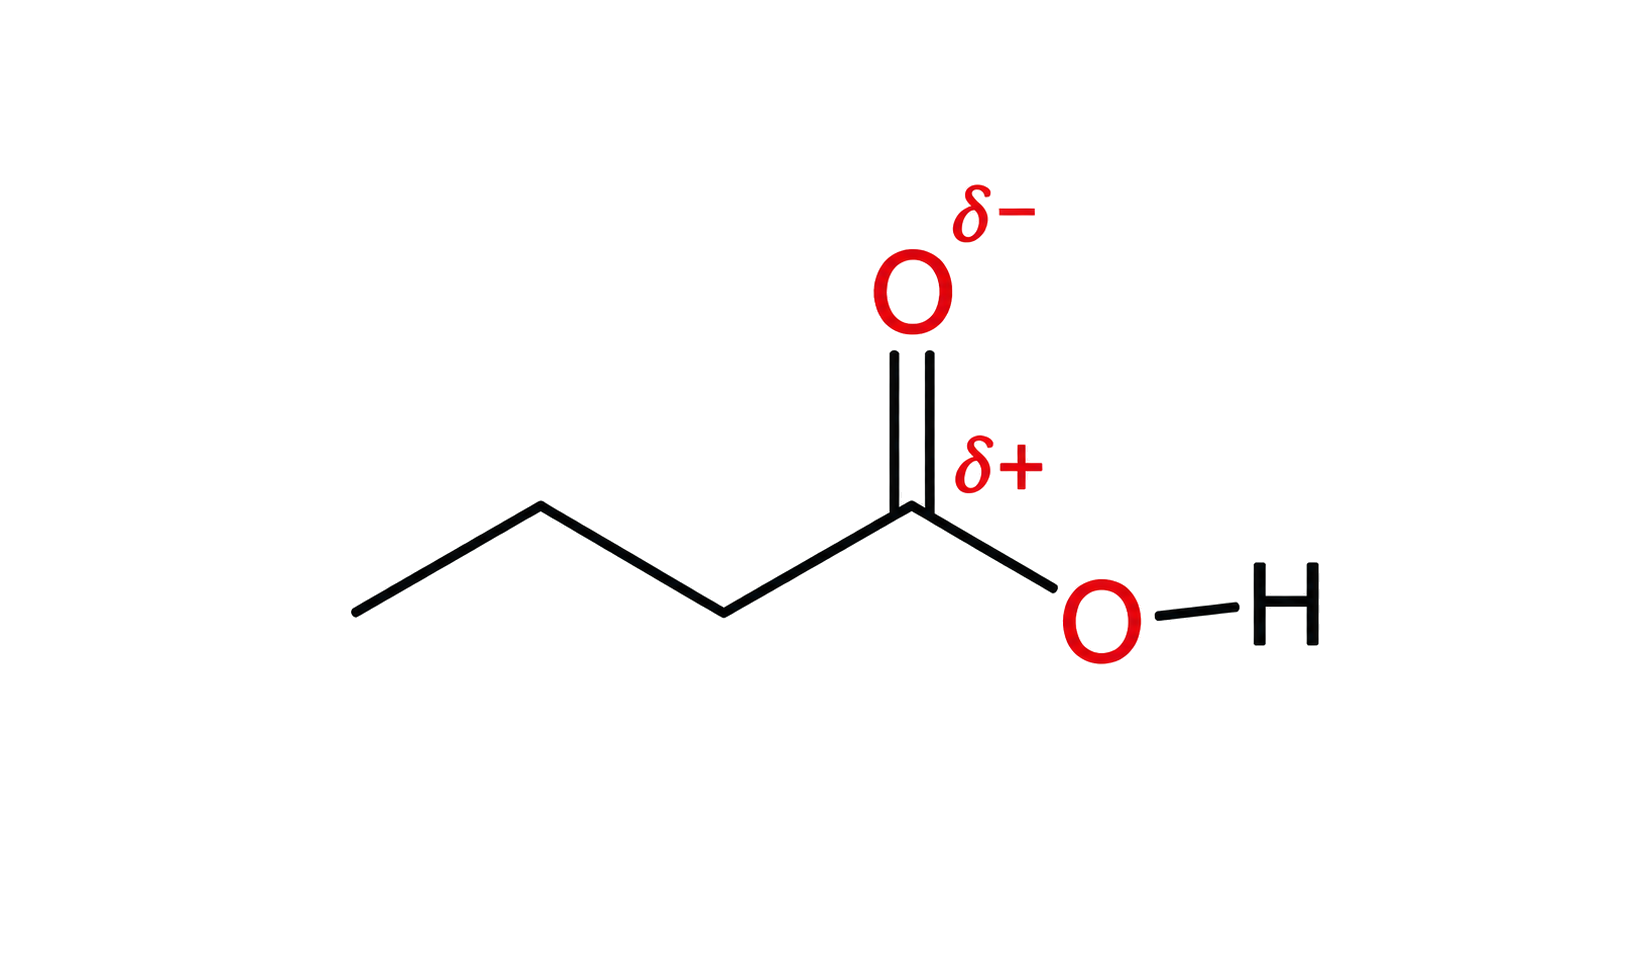
Identify the electron-poor atom, not merely a positive-looking formula. H⁺ and carbocations are electrophiles, and the δ⁺ carbon in a polar C–X bond can also accept a pair. The incoming curly arrow ends at this acceptor.
The electron-rich C=C attacks an electrophile. Deduce addition products with water, halogens or hydrogen halides within the SL mechanism boundary.
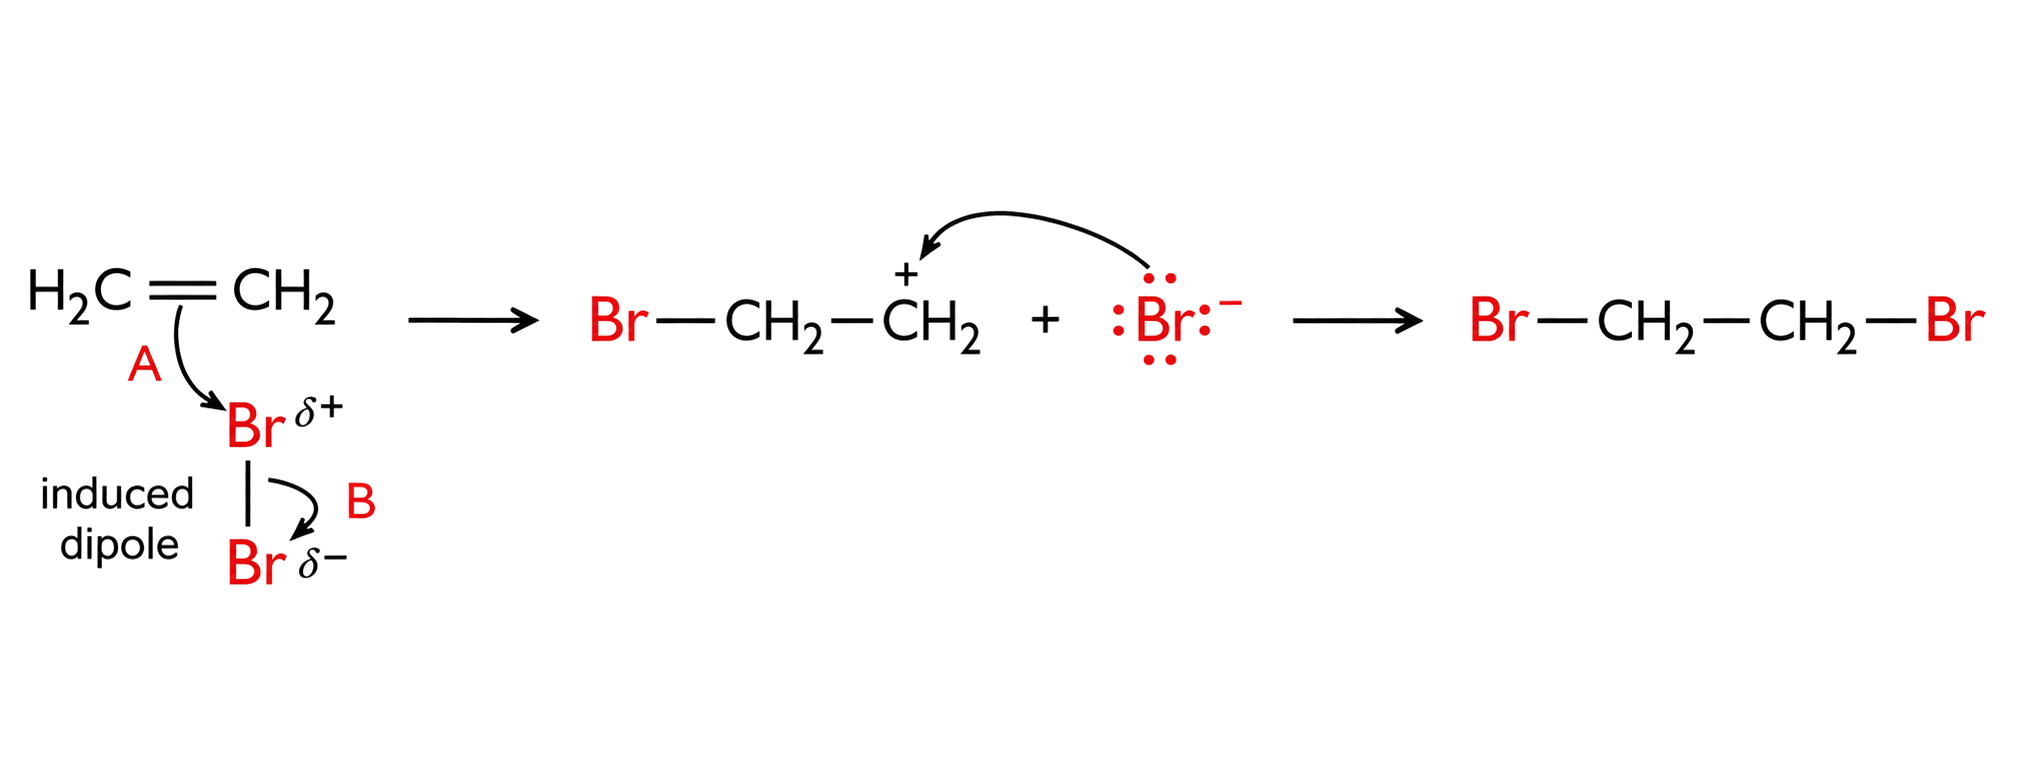
Treat the C=C as the reactive site and place the two added groups on its two carbon atoms. Bromine addition removes the double bond and forms a dibromoalkane; hydration forms an alcohol. At SL, deducing these products does not require a mechanism.
| Reagent | Groups added across C=C | Product check |
|---|---|---|
| X₂ (for example Br₂) | X and X | vicinal dihalogenoalkane; C=C becomes C–C |
| HX | H and X | halogenoalkane; conserve the H and halogen from HX |
| H₂O/steam under acid-catalysed hydration conditions | H and OH | alcohol; conserve the carbon skeleton |
At SL, use reagent and atom conservation to deduce products; curly-arrow mechanisms are not assessed in this card.
A Lewis acid accepts an electron pair; a Lewis base donates an electron pair. Nucleophiles correspond to Lewis bases and electrophiles to Lewis acids.
In BF₃ + NH₃ → F₃B←NH₃, NH₃ donates the pair and is the Lewis base; BF₃ accepts it and is the Lewis acid. Classify the roles from electron-pair movement rather than from whether H⁺ appears.
A ligand acts as a Lewis base and donates an electron pair to a Lewis-acid transition-metal cation, forming a coordinate bond.
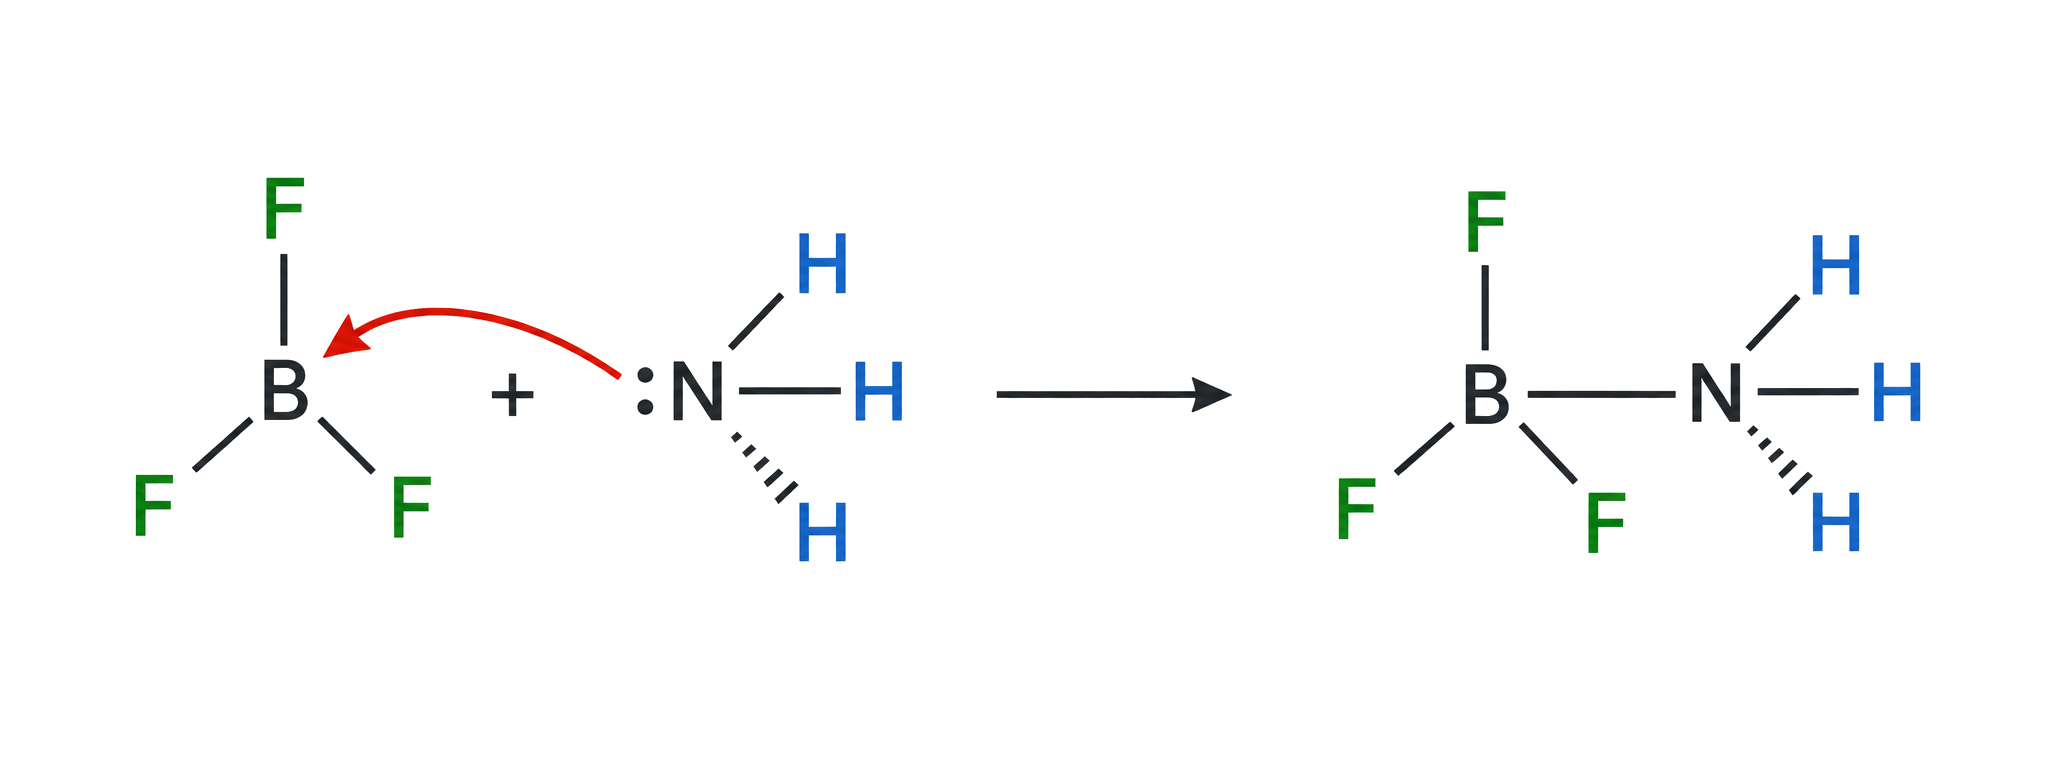
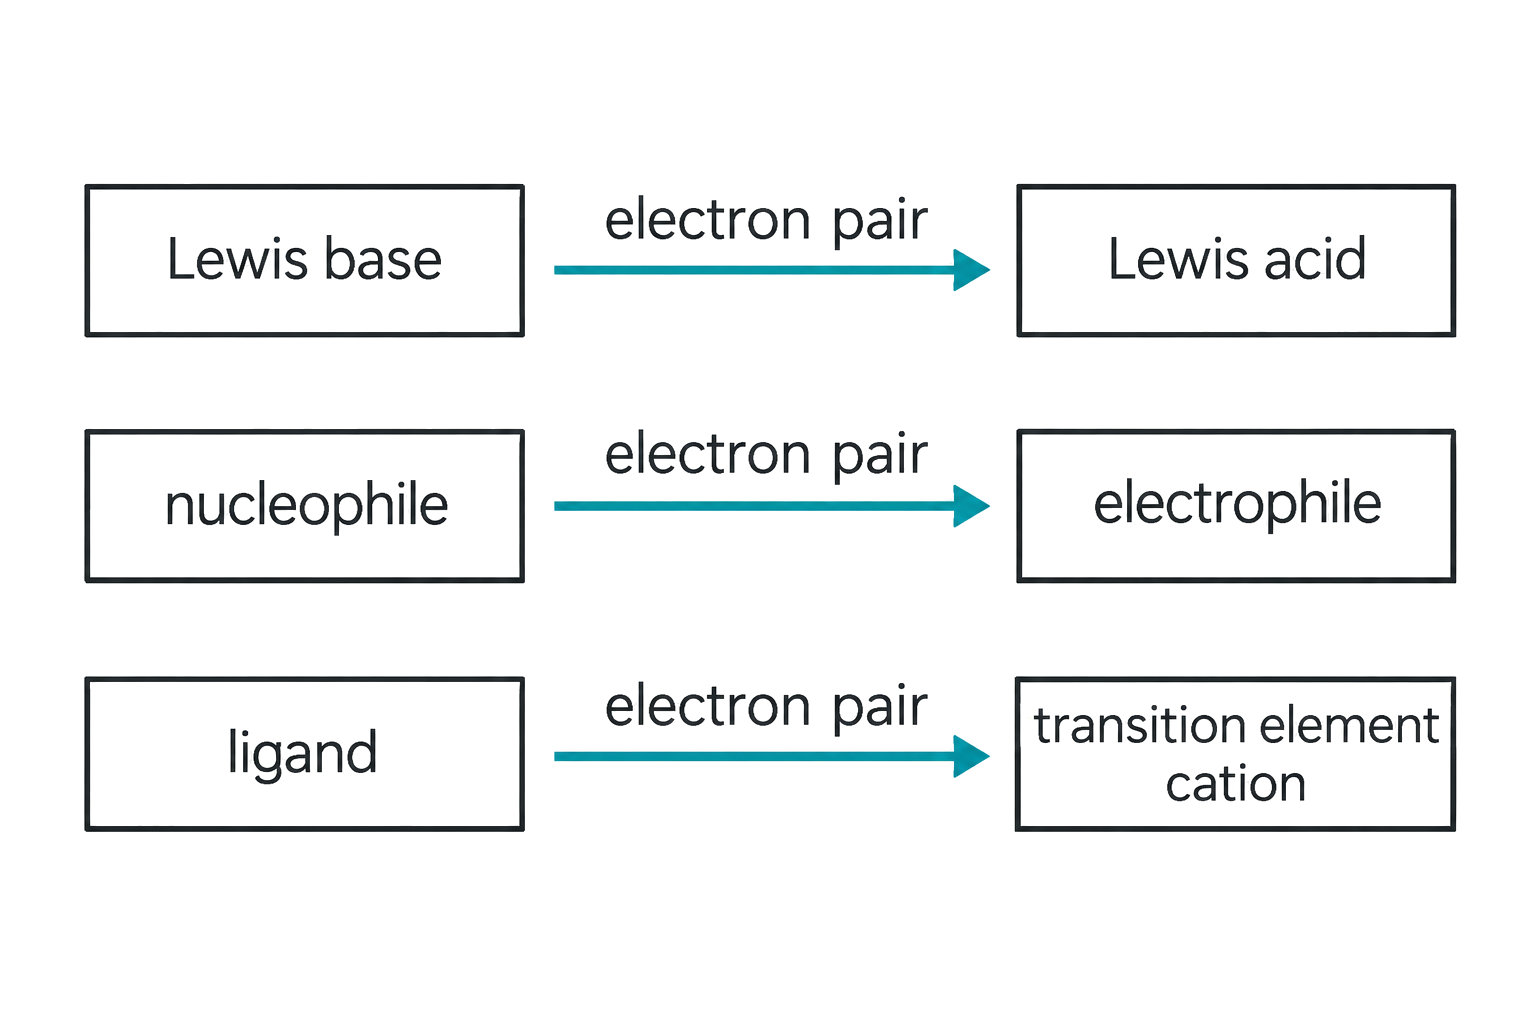
Show a coordination bond with an arrow from a ligand lone pair to the metal ion. The arrow records the origin of the shared pair; after formation the bond is not a different electrostatic species from other covalent bonds.
Identify the central transition-metal cation and the surrounding ligands. Each ligand donates an electron pair to the metal centre.
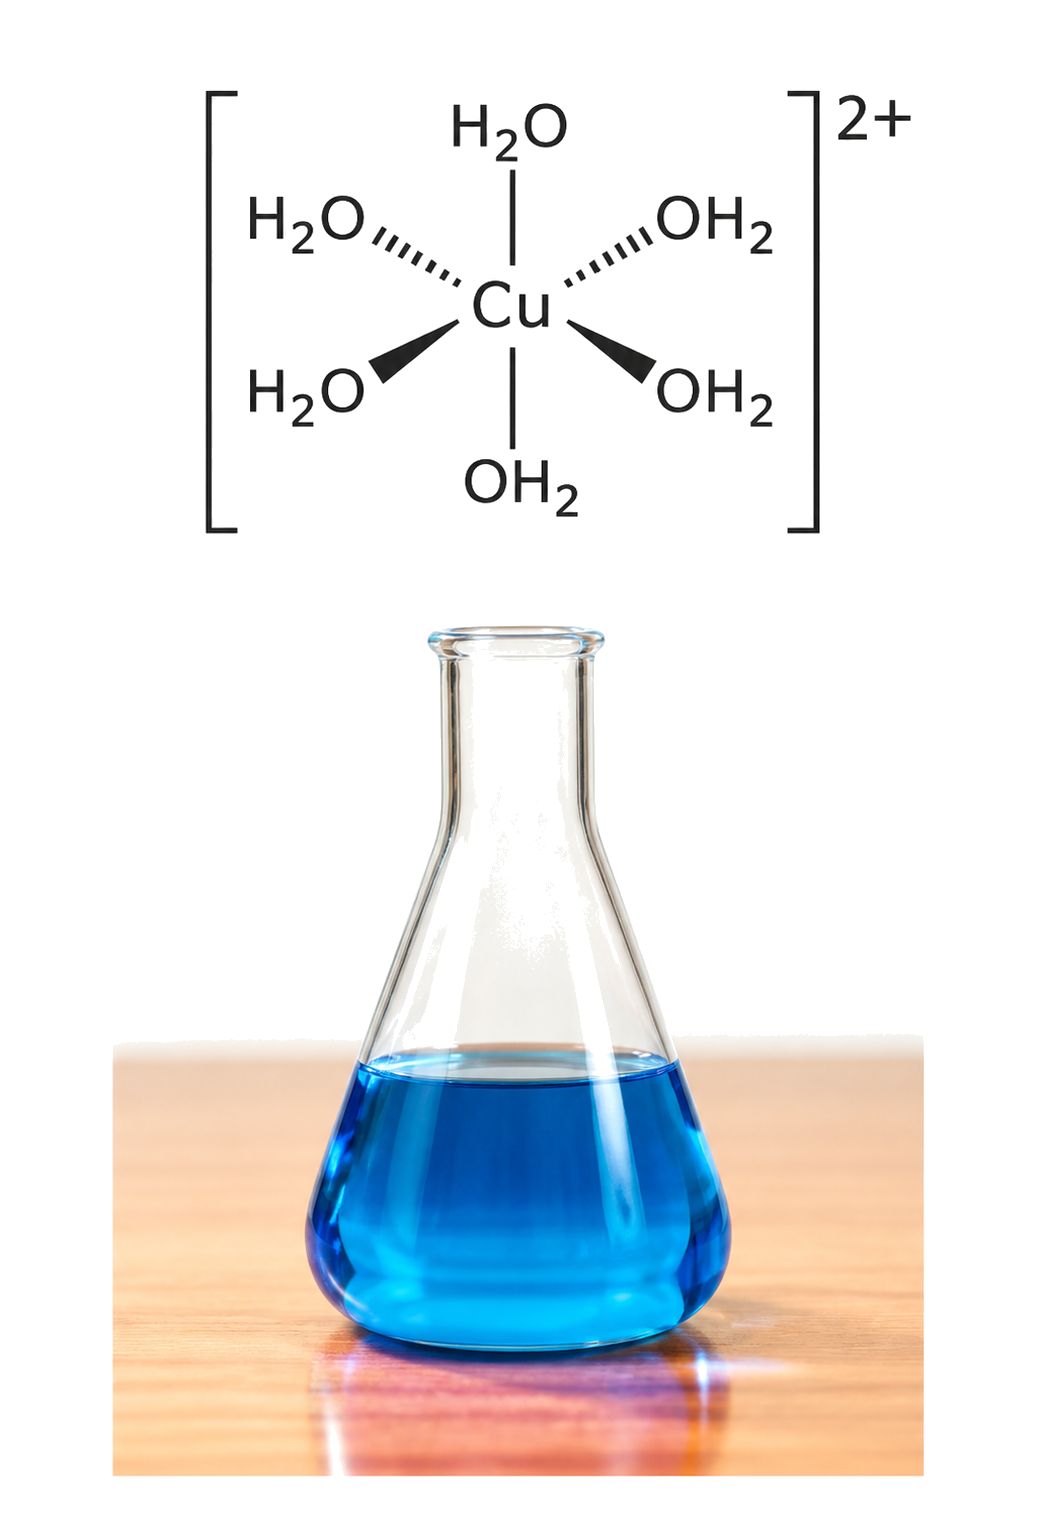
Read [Cu(NH₃)₄]²⁺ as one Cu centre with four NH₃ ligands and coordination number 4. Use ligand charges and the overall bracket charge to deduce the metal oxidation state; do not confuse coordination number with oxidation state.
| Mechanism | Typical substrate/context | Steps and stereochemical result |
|---|---|---|
| SN2 | primary; some secondary | one concerted backside attack; inversion at a stereogenic centre |
| SN1 | tertiary; some secondary | two steps through a planar carbocation; both configurations can form |
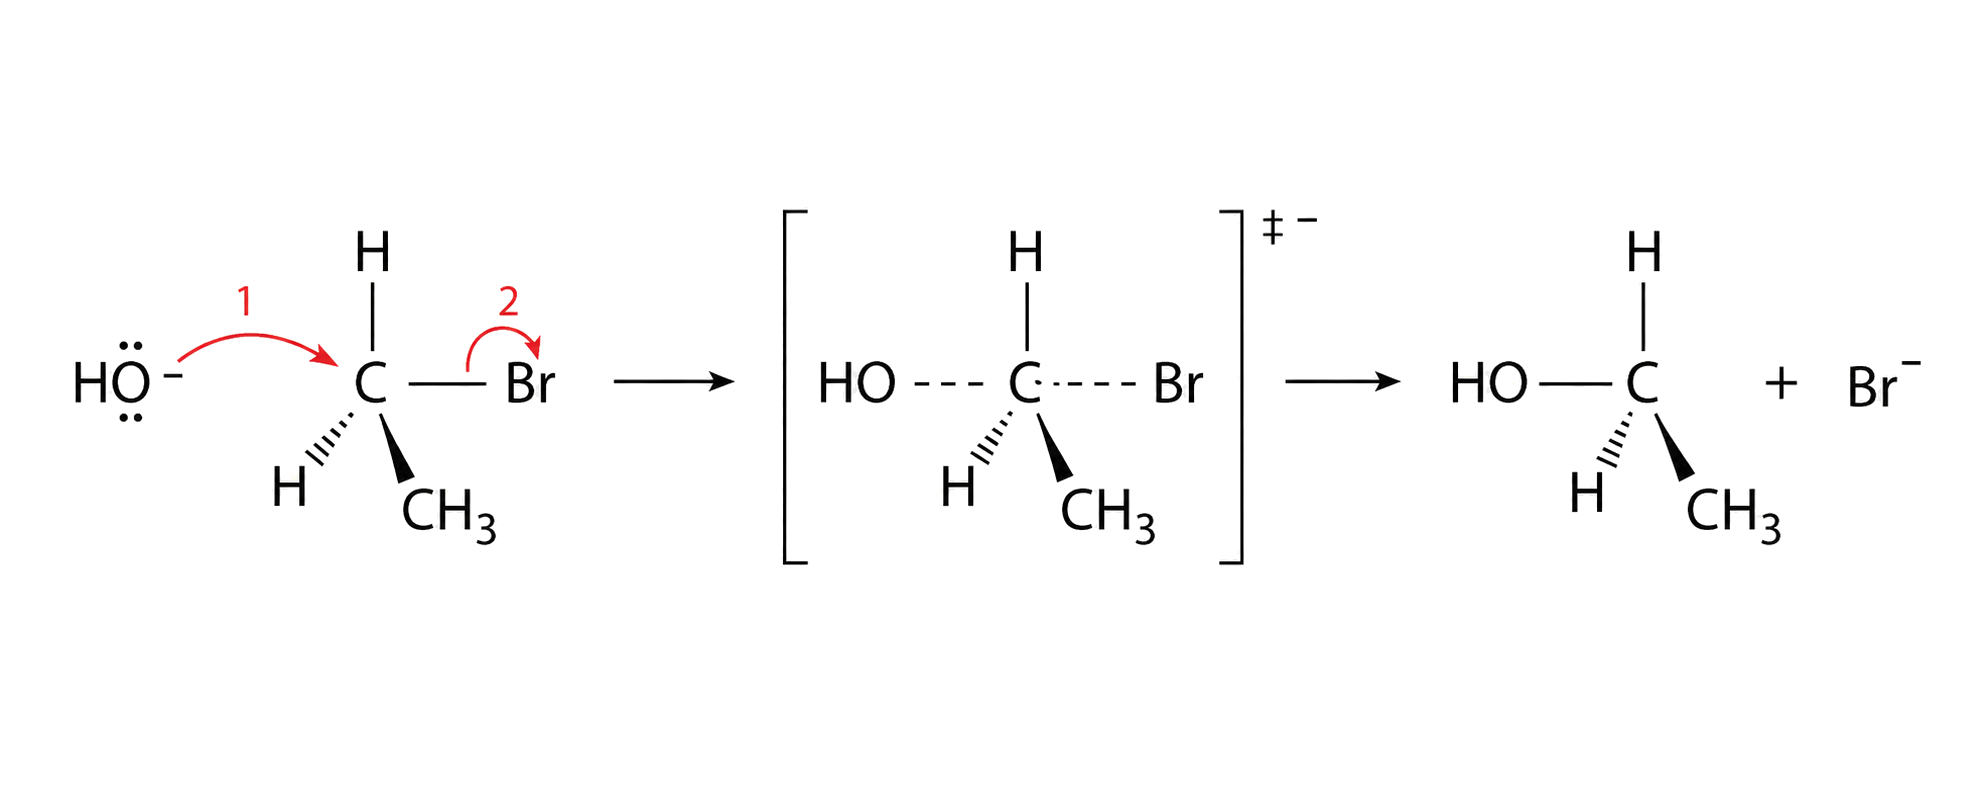
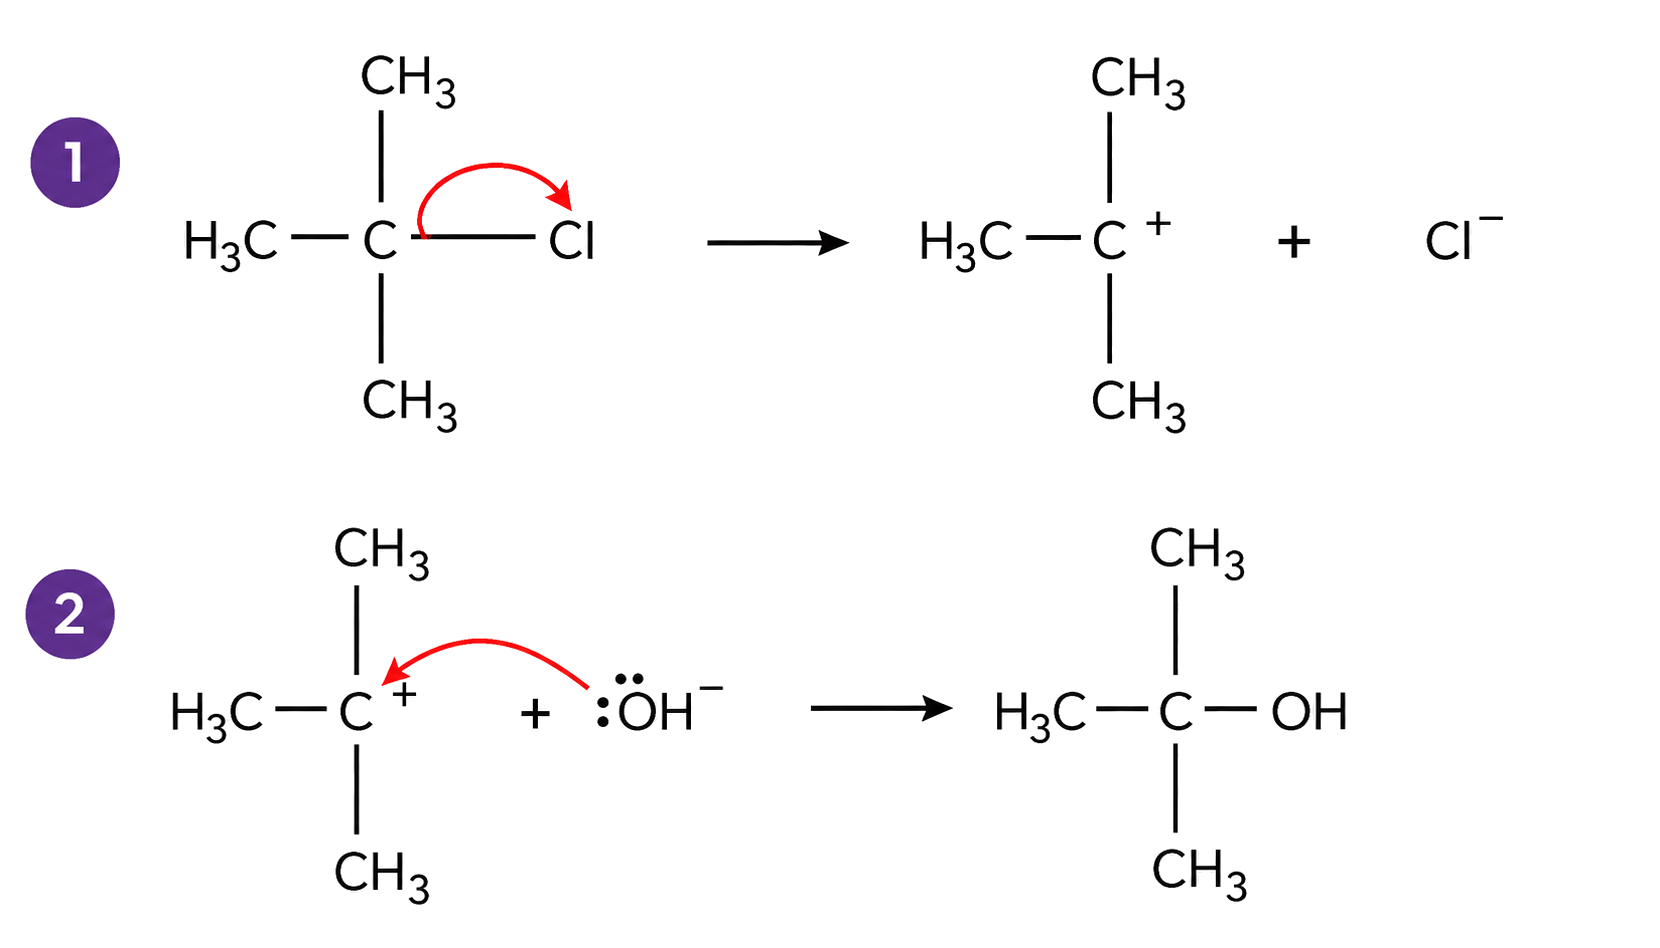
SN2 is a concerted backside attack: the nucleophile bonds as the carbon–halogen bond breaks. SN1 first forms a carbocation; the nucleophile then attacks the planar intermediate. Primary substrates generally favour SN2 and tertiary substrates generally favour SN1 because steric access and carbocation stability differ. Secondary substrates can support either mechanism, so use the conditions as well as the substrate class.
Do not treat SN1 and SN2 as labels that follow substrate class with no exceptions, or confuse inversion in SN2 with the mixture possible after planar SN1 attack.
Use curly arrows from the alkene π bond to the electrophile, then from the intermediate to the nucleophile. Halogens may pass through a halonium intermediate; HX or water may pass through a carbocation.
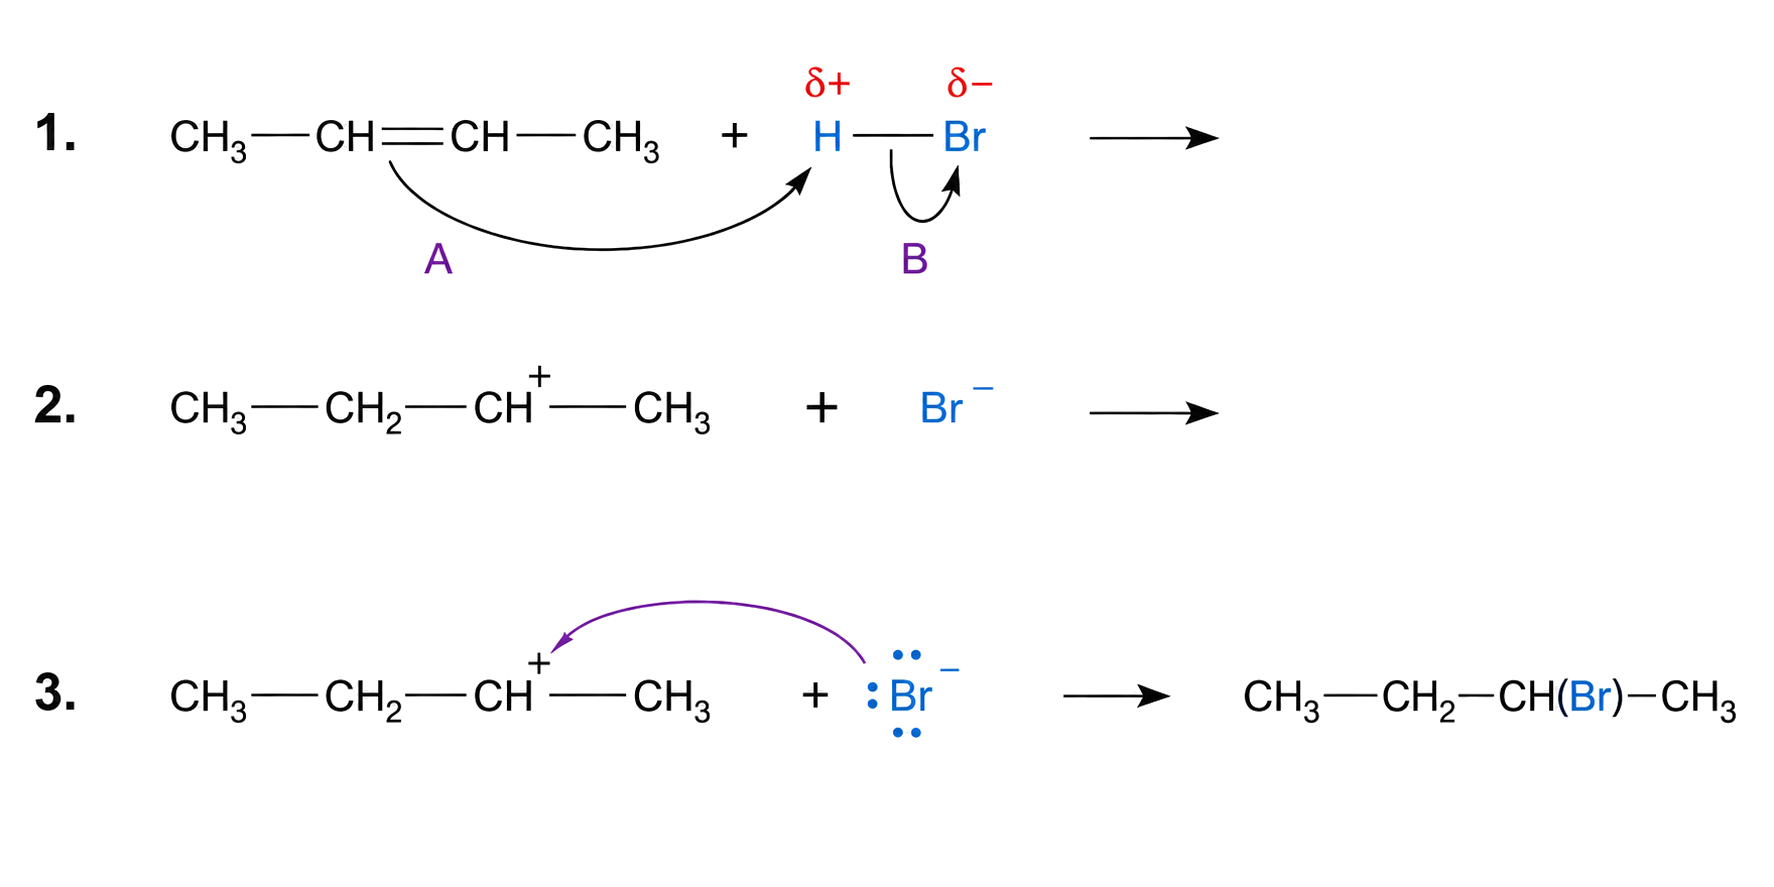
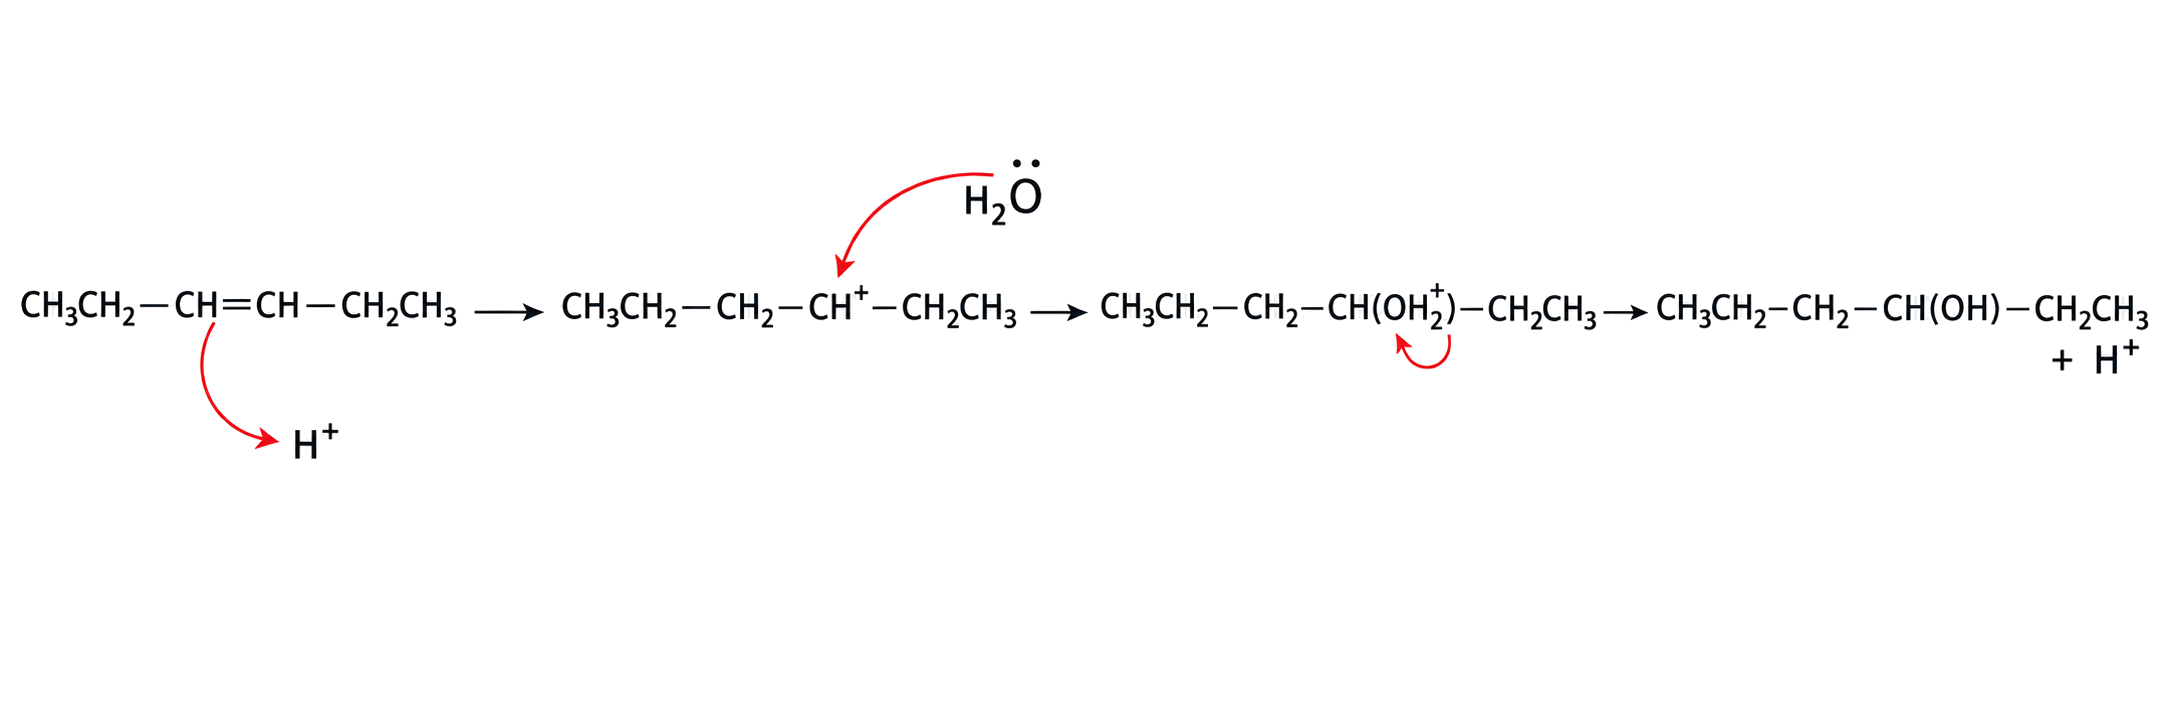
Begin with an arrow from the alkene π bond to the electrophile. HX or acid-catalysed hydration can form a carbocation, whereas halogen addition uses a bridged halonium ion; the next arrow must start from the nucleophile's pair.
For HX or water addition to an unsymmetrical alkene, compare the possible carbocations and select the pathway through the more stable carbocation as the major product.
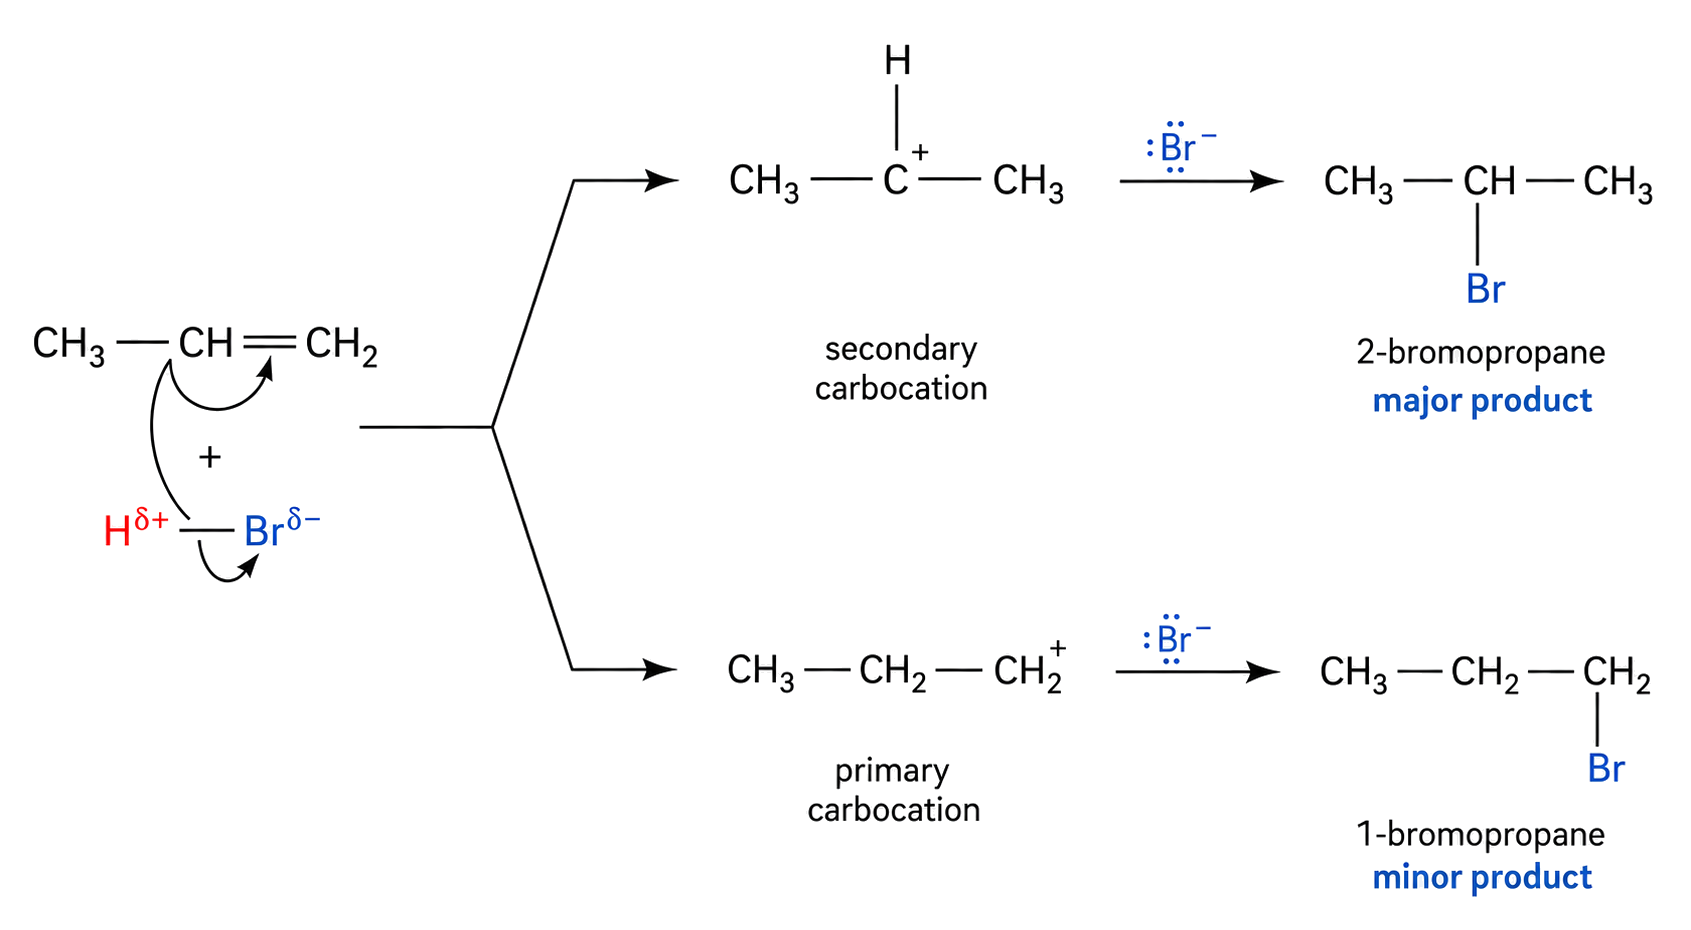
For an unsymmetrical alkene, draw both protonation routes and compare the carbocations: tertiary is generally more stable than secondary, then primary. Choose the product from the more stable intermediate; do not apply this shortcut to a halonium pathway.
Benzene attacks the charged electrophile E+, forms a charged intermediate, then loses H+ to restore aromaticity. The formation of E+ is outside this assessed mechanism boundary.
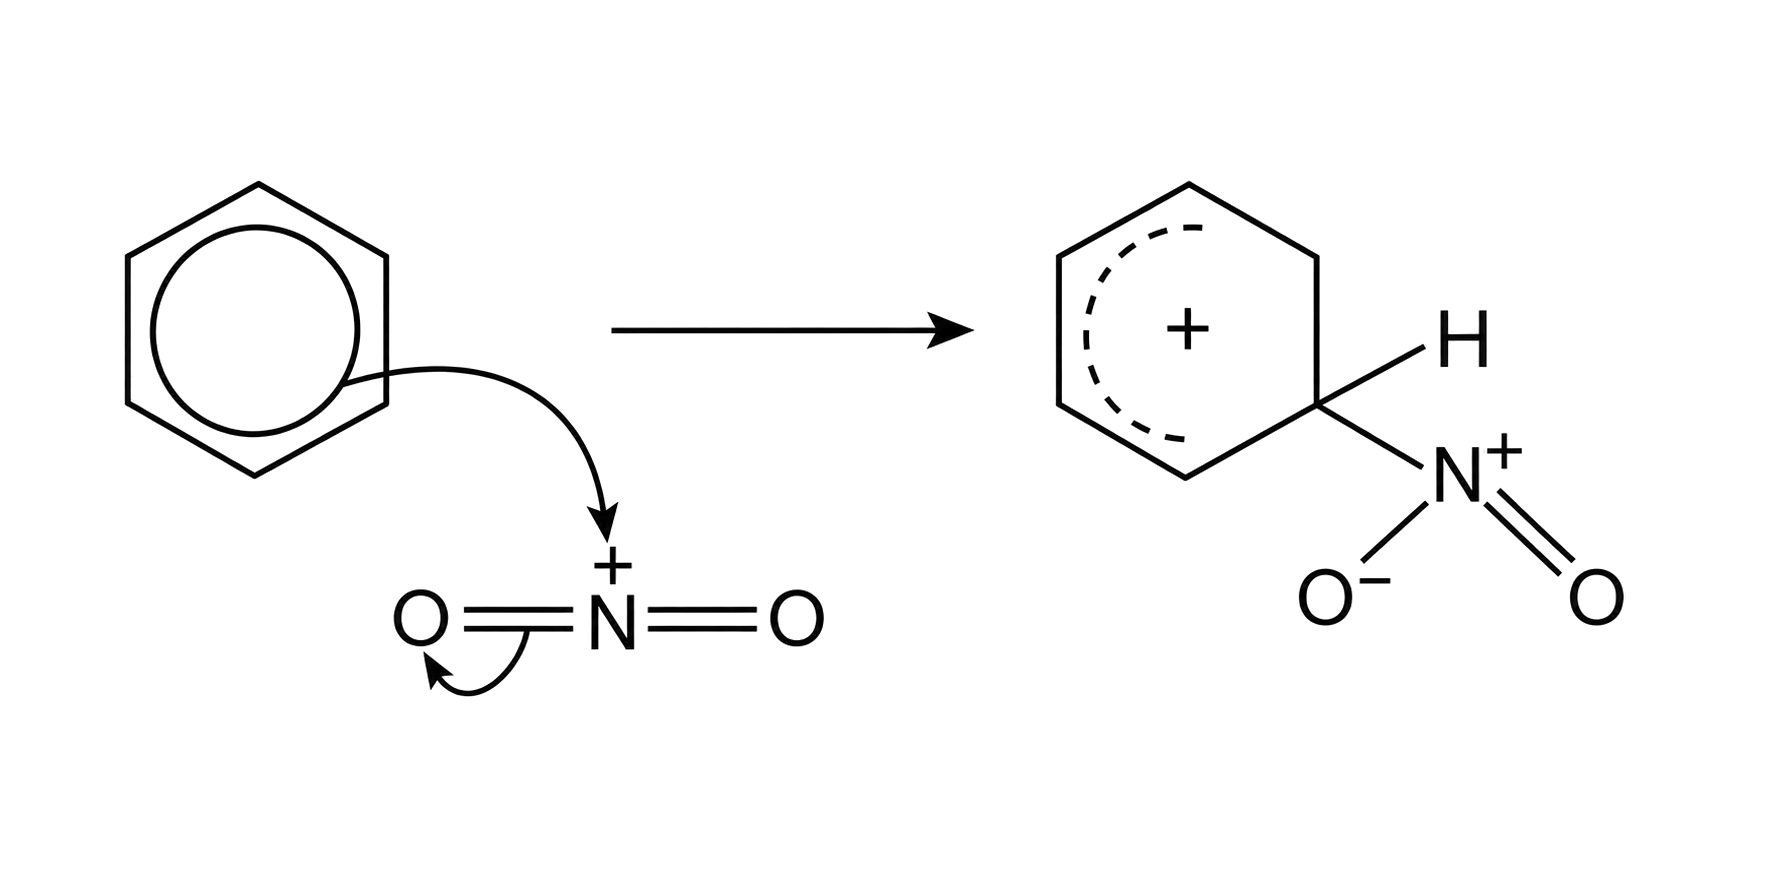
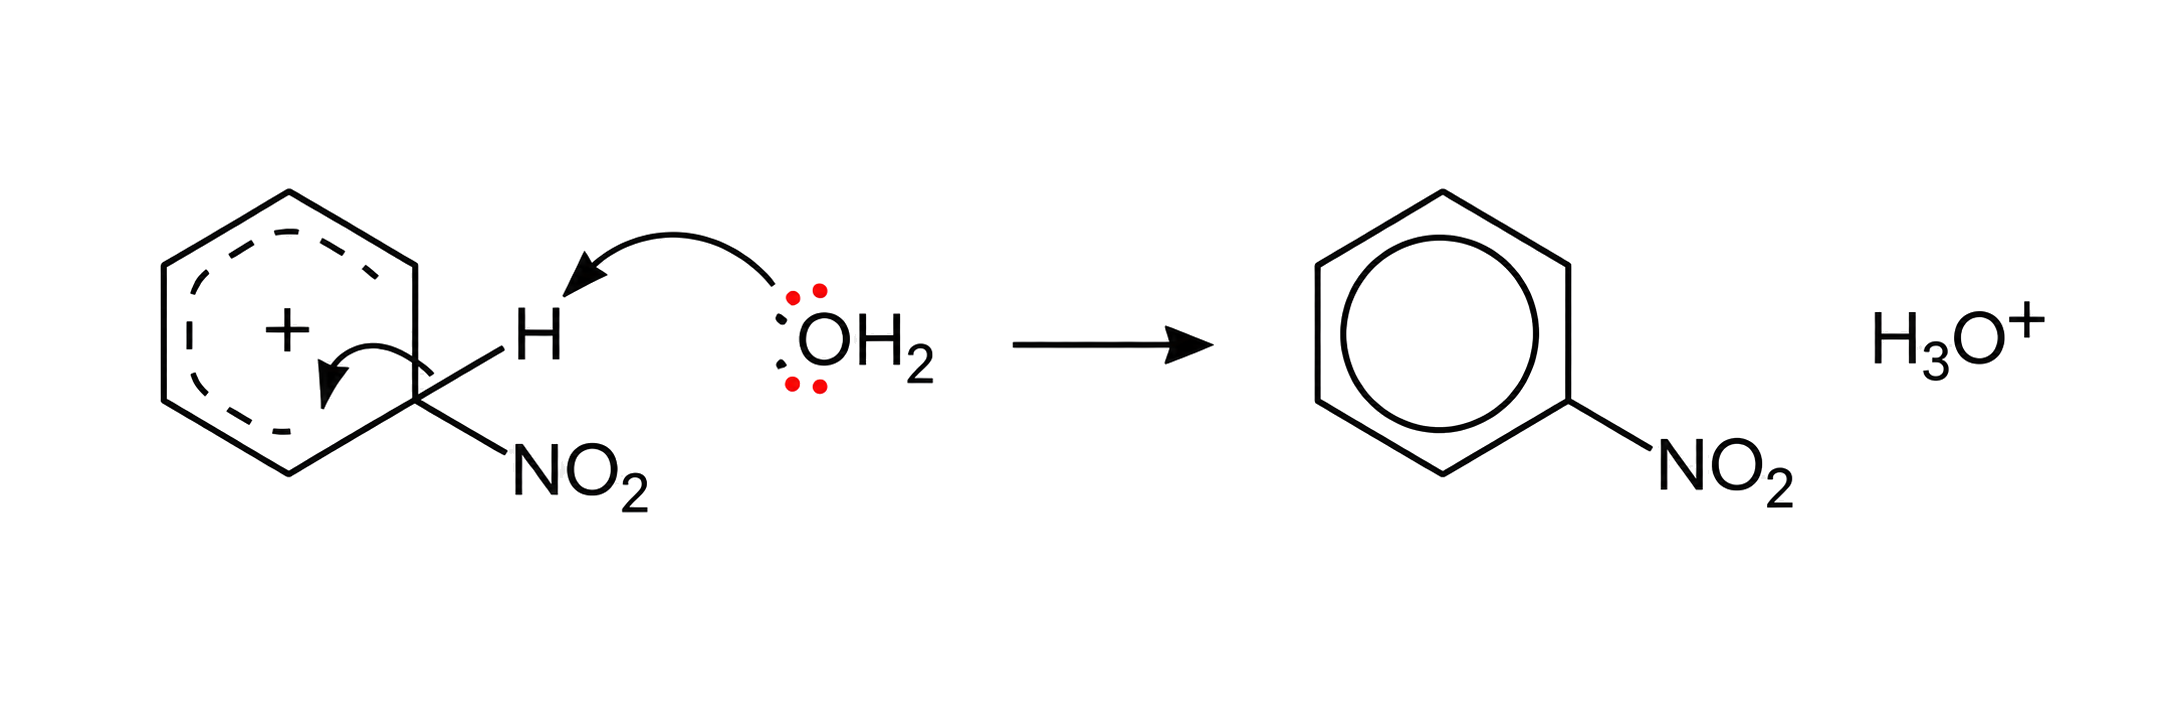
The first step temporarily disrupts aromatic delocalization; loss of H⁺ then restores the ring and replaces H by E. An addition product would leave aromaticity broken, which explains why the assessed outcome is substitution.
