1.3 Electron configurations

Syllabus
First assessment 2025
Topic
1.3
Level
HL

Learning objectives

Emission Spectra

An emission photon is released when an electron falls from a higher energy state to a lower energy state. Absorption moves an electron upward and requires photon energy.

Electron drops between discrete energy levels emit specific photons, producing separate lines rather than a continuous spectrum.
Spectrum What it contains Why
Line spectrum Specific wavelengths, frequencies, energies, or colours Electrons occupy discrete energy levels, so only particular transitions occur
Continuous spectrum A continuous range across the relevant values The radiation spans the range rather than appearing as separated lines

Across electromagnetic radiation, shorter wavelength means higher frequency, and higher frequency means higher photon energy. Explain the electron direction and photon exchange when distinguishing absorption from emission.

Read every spectral transition in two directions: absorption raises an electron by ΔE, while a downward transition emits a photon with ΔE = hf = hc/λ. A shorter-wavelength line therefore represents a larger energy gap, not a higher line intensity.

Orient the spectrum before comparing lines: radio → microwave → infrared → visible → ultraviolet → X-ray → gamma is increasing frequency and photon energy, and decreasing wavelength. Within visible light, red has longer wavelength and lower photon energy than violet.

Explaining Absorption and Emission

2 marks

Distinguish between the processes within the atom that give rise to absorption and emission spectra.

Absorption spectra:

Emission spectra:

Hydrogen's Line Spectrum

Hydrogen's emission spectrum contains discrete lines because electrons occupy discrete energy levels. Each line corresponds to a downward transition and the emitted photon's energy equals the energy difference between the levels.

Hydrogen transitions end at n equals 1, 2, or 3, and the resulting spectral lines crowd together toward the high-energy convergence limit.
Transition ending at Region identified in the study guide
n = 1 ultraviolet
n = 2 visible
n = 3 infrared

At higher energy, the levels become closer together, so the lines converge. The names of the series are not required.

Use the presence of separate lines as evidence for discrete levels, and use convergence at higher energy or frequency as evidence that the level spacing becomes smaller.

Compare lines by their energy gaps. Transitions ending at n = 2 form the visible series, and lines crowd together as the starting level rises because adjacent high-n levels are closer in energy. The convergence limit represents removal of the electron, not one more bound-state transition.

Interpreting Hydrogen Emission Lines

3 marks

Explain how this spectrum is related to the electron energy levels in a hydrogen atom.

Main Energy-Level Capacity

A main energy level, or shell, is identified by the principal quantum number n = 1, 2, 3, and so on.

maximumelectrons=2n2maximum electrons = 2n²

n Maximum electrons
1 2
2 8
3 18
4 32

Substitute the stated n value into 2n²; do not confuse the shell number with the capacity.

For n = 3, the theoretical capacity is 2(3²) = 18 electrons. This is a capacity, not a claim that every third shell is full: the actual occupancy depends on the atom and the relative energies of available sublevels.

Calculating Shell Capacity

1 mark

What is the maximum number of electrons that can occupy the n=3 main energy level?

Sublevels, Orbitals, and Blocks

A main energy level contains only the sublevels allowed by its principal quantum number: n = 1 has s; n = 2 has s and p; n = 3 has s, p and d; and n = 4 can include s, p, d and f. Within one main level the sublevels rise in energy s < p < d < f, while the filling order across different levels can interleave, as the next card makes explicit. Each sublevel contains a fixed number of orbitals.

A spherical s orbital and three perpendicular dumbbell-shaped p orbitals are linked to the orbital hierarchy and periodic-table blocks.
Sublevel Number of orbitals Maximum electrons Assessed shape evidence Periodic-table block
s 1 2 spherical s block
p 3 6 three dumbbell orbitals with different orientations p block
d 5 10 shape detail not required here d block
f 7 14 shape detail not required here f block

The block is identified by the subshell being filled; sublevel capacity is not the same as actual occupancy.

For recognition questions, keep the hierarchy clear: main energy level → sublevel → orbital. The s and p shapes are the explicitly required shape evidence here.

Use the hierarchy as a classification test: a p sublevel contains three orbitals, and each orbital can hold two electrons. An orbital describes a probability region with a characteristic shape; it is not a circular route travelled by an electron.

Recognising Orbital Shapes

2 marks

Sketch the shapes of two different orbital types in the second energy level and label each orbital.

Electron Configurations and Spin

Aufbau fills lower-energy orbitals first. Pauli limits an orbital to two electrons with opposite spins. Hund's rule places electrons singly in degenerate orbitals before pairing.

A spherical s orbital and three perpendicular dumbbell-shaped p orbitals are linked to the orbital hierarchy and periodic-table blocks.
Orbital boxes fill from lower to higher energy, singly before pairing and with opposite paired spins, with separate corrected rows for chromium and copper.
Representation Use
Full configuration Show the complete filling sequence
Condensed configuration Replace the inner electrons with a noble-gas core
Orbital-box diagram Show orbital occupancy and opposite-spin pairing

For ions, remove 4s electrons before 3d electrons. The exceptions in scope are Cr: [Ar] 4s1 3d5 and Cu: [Ar] 4s1 3d10.

Check total electrons, obey the filling order, apply Hund and Pauli in each sublevel, and treat the Cr/Cu exceptions explicitly rather than forcing the naive pattern.

Build an orbital diagram by checking electron total, energy order, single occupation of equal-energy orbitals, then opposite-spin pairing. For transition-metal ions remove 4s electrons before 3d, and verify Cr and Cu against the stated exceptions rather than forcing the simple filling pattern.

Worked ion check: Fe has 26 electrons and condensed configuration [Ar] 4s² 3d⁶. To form Fe³⁺, remove the two electrons from the highest principal level, 4s, before removing one 3d electron, giving [Ar] 3d⁵. The final superscripts total 23 electrons, matching 26 − 3.

Constructing Electron Configurations

2 marks

Draw the orbital diagram of the phosphorus atom in the ground state by adding, filling and labelling the orbitals. Use section 7 of the data booklet.

2s

1s

First Ionization Energy

HL only

First ionization energy is the energy required to remove one mole of electrons from one mole of gaseous atoms. The convergence limit in an emission spectrum corresponds to ionization.
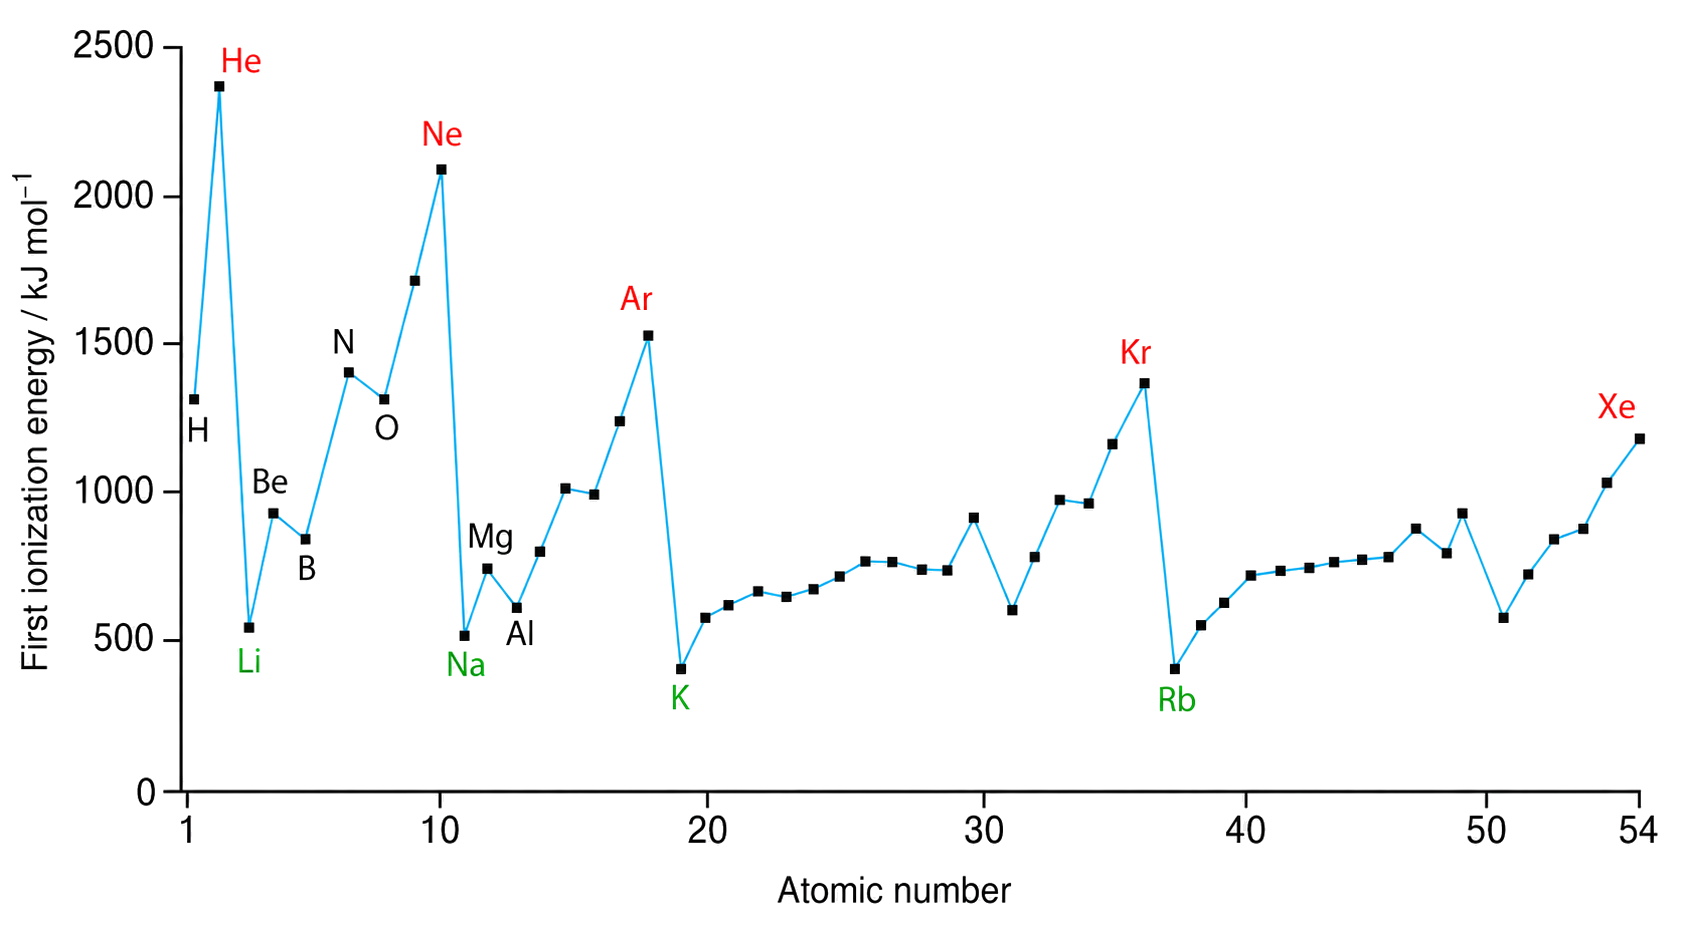
noble-gas maxima occur at He, Ne, Ar, Kr, and Xe; post-noble-gas minima occur at Li, Na, K, and Rb; highlighted element labels and atomic-number positions match the source; major within-period discontinuities are preserved.
Trend Explanation
Across a period Generally increases as effective nuclear charge increases
Down a group Generally decreases because the outer electron occupies a higher shell
Be → B dip The electron removed from B is in a higher-energy p subshell
N → O dip Pairing in a p orbital makes one electron easier to remove

E=hfandc=λfE = hf and c = λf

Worked example — hydrogen convergence limit

The local course book gives λ=9.12×10⁻⁸ m\lambda=9.12\times10^{-8}\,\mathrm{m}. First, f=c/λ=(3.00×108 m s−1)/(9.12×10−8 m)=3.29×10¹⁵ s−1f=c/\lambda=(3.00\times10^8\,\mathrm{m\,s^{-1}})/(9.12\times10^{-8}\,\mathrm{m})=3.29\times10^{15}\,\mathrm{s^{-1}}. Then Ephoton=hf=(6.63×10⁻³⁴ J s)(3.29×10¹⁵ s−1)=2.18×10⁻¹⁸ JE_{\text{photon}}=hf=(6.63\times10^{-34}\,\mathrm{J\,s})(3.29\times10^{15}\,\mathrm{s^{-1}})=2.18\times10^{-18}\,\mathrm{J}. Convert one-photon energy to one mole and joules to kilojoules: IE=(2.18×10⁻¹⁸)(6.02×10²³)/1000=1.31×103 kJ mol−1IE=(2.18\times10^{-18})(6.02\times10^{23})/1000=1.31\times10^3\,\mathrm{kJ\,mol^{-1}}. This is the molar energy for the first ionization process H(g)→H+(g)+e−\mathrm{H(g)\rightarrow H^+(g)+e^-}.

At the convergence limit, convert wavelength or frequency to energy per photon with E = hf, then multiply by the Avogadro constant and convert J mol⁻¹ to kJ mol⁻¹. Across-period trends are general patterns; subshell energy and electron pairing explain the named dips.

X(g)→X+(g)+e−firstionizationenergyinkJmol−1X(g) → X⁺(g) + e⁻ first ionization energy in kJ mol⁻¹

Explaining and Calculating Ionization Energy

HL only

2 marks

Determine the frequency of electromagnetic radiation, in s−1\mathrm{s}^{-1}, equivalent to the first ionization energy of phosphorus. Use sections 1, 2 and 9 of the data booklet.

Successive Ionization Energies

HL only

Successive ionization energies rise as electrons are removed. A very large increase occurs when removal crosses from the outer shell into a lower, more tightly held shell.

Successive ionization energies rise modestly until a large jump marks removal of the first core electron, revealing the number of valence electrons.
Observation Deduction
Small increases before the large jump Electrons are being removed from the same outer shell
Large jump The next electron is from an inner shell
Number removed before the jump Outer-electron count and group pattern

Use the position of the first large jump, not its numerical size alone, to infer the group.

A jump after three outer-electron removals is the pattern used in the study guide for a group 13 element. The same count-before-the-jump method applies to new data.

Locate the first order-of-magnitude jump before naming the group. A large jump after the second electron is removed shows two outer-shell electrons; the third electron would come from a lower shell, supporting a group 2 assignment.

Electron Configurations Summary

Retrieve the chain: emission lines reveal discrete levels; capacities, sublevels, orbitals, and spin rules build configurations; first and successive ionization energies then reveal how electrons are held and arranged.

When checking an answer, ask: Did I link a line to a transition? Did I use 2n² and the filling rules? Did I explain an ionization trend or count electrons before a successive-IE jump?