Unity and Diversity connects water, molecules, cells, classification, evolution and biodiversity into evidence-based explanations of shared life patterns and biological variation.
Syllabus
First assessment 2025
Section
—
Level
HL
Exam analysis
Published Concept evidence in Unity and Diversity repeatedly links cell structures, nucleic acids, organism diversity and evolution. The strongest pattern is not isolated recall, but explaining how molecular and cellular evidence supports biological unity, variation and classification.
Water’s polarity and hydrogen bonding create solvent, thermal, cohesive and adhesive properties that support metabolism, transport, cooling and aquatic life.
Syllabus
First assessment 2025
Topic
A1.1
Level
HL
Life runs in a shared liquid environment
The earliest cells arose in water, where the surrounding ocean reduced exposure to ultraviolet radiation. Modern cells still contain a high proportion of water, and most cellular chemistry occurs in an aqueous phase.
As a biological medium, water allows:
dissolved reactants to diffuse and encounter one another
enzymes and substrates to interact in the same liquid phase
solutes to move through cytoplasm, blood, tissue fluid and plant transport systems
A medium provides the environment for a process. Water is a reactant only in reactions that chemically consume it. Its value as a medium depends on the molecular interactions developed next.
Molecular shape turns bond polarity into a polar molecule
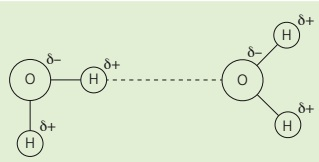
Oxygen attracts the shared electrons in each O–H covalent bond more strongly than hydrogen. Oxygen therefore carries a partial negative charge, δ−, while each hydrogen carries δ+. Because the molecule is bent, the two bond polarities do not cancel.
A hydrogen bond is the attraction between a δ+ hydrogen on one water molecule and a δ− oxygen on another. It is an intermolecular attraction, not the covalent bond holding O and H together inside one molecule.
One hydrogen bond is weak compared with an O–H covalent bond. Water's unusual properties arise because enormous numbers of hydrogen bonds act together while continually breaking and reforming.
Cohesion has a bulk effect and a surface effect
Cohesion is attraction between water molecules. Many hydrogen bonds together allow a body of water to transmit force without the molecules separating easily.
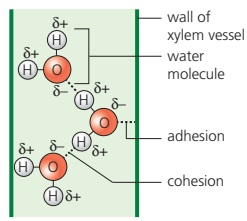
In xylem, evaporation from leaves creates tension. Cohesion keeps water molecules connected, so the pull is transmitted down a continuous column and the column resists breaking.
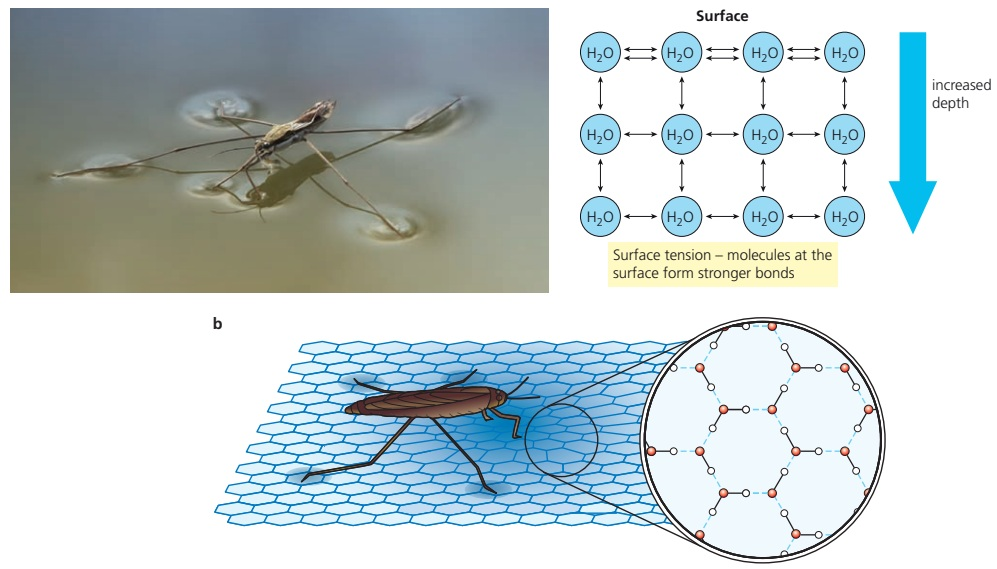
At the surface, water molecules have no neighbours above them, so cohesive attractions have a net inward effect. The surface resists stretching or breaking; a small pond skater with water-repellent legs can spread its weight without rupturing it.
Cohesion maintains the xylem column but does not create the transpiration pull. Surface tension supports an organism at a boundary; buoyancy supports an immersed body through displaced fluid.
Adhesion depends on what water is touching
Force
Attractive contact
Main biological consequence
Cohesion
water ↔ water
maintains a connected xylem column that can resist tension
Adhesion
water ↔ polar or charged surface
wets cellulose and pulls water along narrow spaces
In narrow soil pores and spaces between cellulose fibres, adhesion pulls water along the hydrophilic wall. Cohesion draws neighbouring water molecules with it, producing capillary movement and keeping leaf cell walls moist.
Adhesion helps water enter and wet narrow spaces, but cohesion is the dominant force preventing a transpiring xylem column from breaking under tension.
Partial charges predict what water can carry
Around Na+, the δ− oxygen ends of water face inward; around Cl−, the δ+ hydrogen ends face inward. Water–ion attractions separate the ions and stabilize a mobile hydration shell around each one.
Substance
Interaction with water
Biological result
ions and polar molecules
charges or polar groups attract water; polar groups may hydrogen-bond
dissolution enables diffusion, reactions and transport
non-polar molecules or regions
no equivalent favourable attraction
poor solubility helps form water-excluding boundaries such as membrane interiors
O₂ and N₂ are non-polar and only slightly soluble. Respiratory pigments such as haemoglobin therefore raise the oxygen-carrying capacity of blood far above that of water alone.
Water changes the costs of temperature control and movement
Property of water compared with air
Opportunity
Constraint
higher specific heat capacity
habitat and water-rich body temperatures change slowly
much energy is exchanged before water temperature changes
higher thermal conductivity
heat moves readily through the surrounding water
a warm animal loses heat faster than in air
much greater density and buoyancy
displaced water supports body mass
upthrust must be overcome during a dive
greater viscosity
feet and flippers can push against the fluid
drag raises the cost of movement
Specific heat capacity describes the energy needed to change temperature; thermal conductivity describes how readily heat passes through a material. Water can therefore provide a stable habitat while still removing heat quickly from a warm animal.
Predict the adaptation from the constraint: insulation limits heat transfer, streamlining reduces drag, broad propulsive surfaces push water backward, and increased mass or reduced trapped air helps an animal dive.
A loon and a seal meet the same habitat in different ways
Aquatic challenge
Black-throated loon
Ringed seal
reduce heat loss
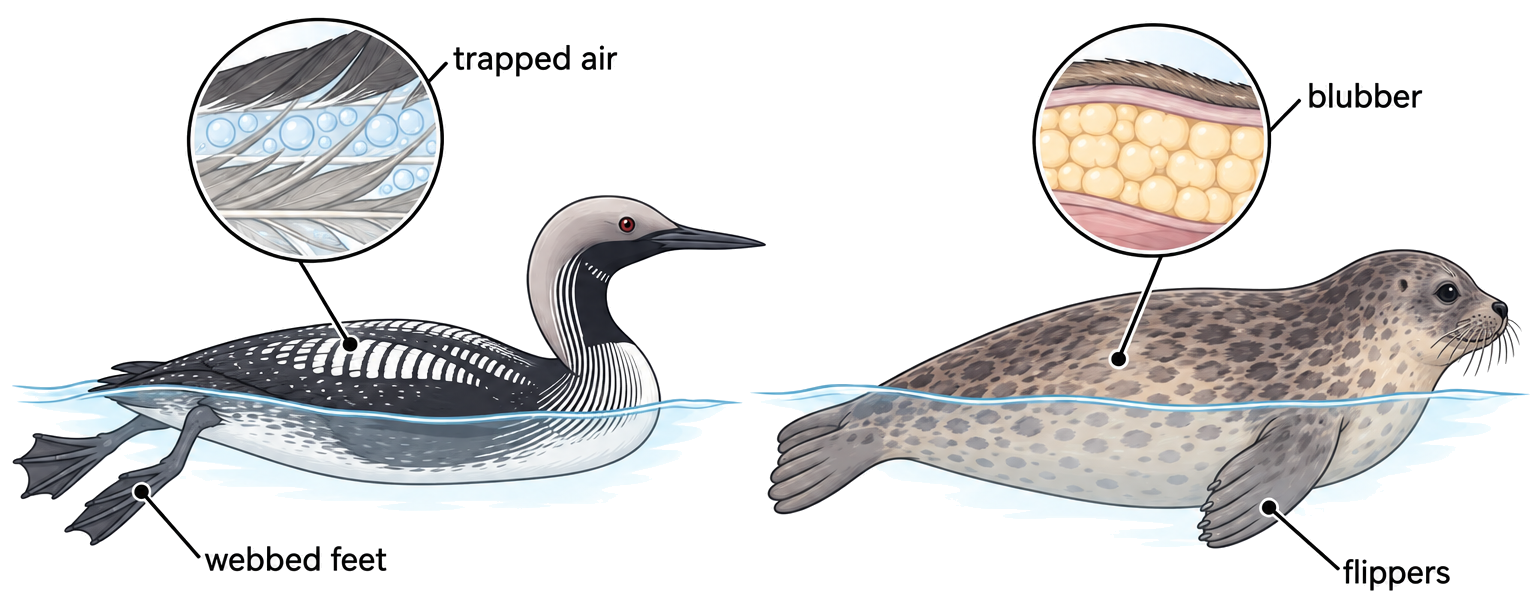
trapped air in feathers limits conduction and convection
thick blubber insulates beneath the skin
produce thrust with low drag
streamlined body; rear webbed feet push water backward
streamlined body; flippers provide propulsion
manage buoyancy while diving
solid bones and compressed air reduce upthrust
blubber adds buoyancy, so swimming force is needed to descend
An adaptation is explained by linking a structural feature to the relevant property of water and then to its consequence for heat balance, propulsion or diving—not by listing the feature alone.
Recover the chain from molecule to biological consequence
Unequal electron sharing + bent geometry → a polar molecule → hydrogen bonding and attraction to charged or polar matter. Begin every explanation from the interaction that produces the property.
Interaction or physical property
Biological opportunity
Constraint or boundary
water–water attraction
xylem continuity; surface tension
cohesion does not create transpiration pull
water–surface attraction
capillary movement and wet cell walls
adhesion is not the main force resisting xylem tension
attraction to ions and polar solutes
reactions, diffusion and transport
non-polar O₂ and N₂ remain poorly soluble
heat capacity, conductivity, buoyancy and viscosity
stable habitat, support and propulsion
heat loss, diving cost and drag require adaptations
Water had to arrive—and then remain on Earth
HL only
Early Earth was initially too hot for water vapour to condense. One supported hypothesis is that water-bearing asteroids formed in cooler regions and delivered water during impacts.
Evidence supporting an asteroid contribution includes:
water held in minerals of carbonaceous chondrites
hydrogen-isotope ratios in some meteorites, including Vesta-derived samples, that resemble Earth's water
Delivery alone would not create oceans. As Earth cooled, water vapour could condense; Earth's gravity then limited escape to space, allowing persistent surface water.
The isotope similarity supports an asteroid contribution but does not prove that every water molecule came from one source. Arrival and retention are separate causal requirements.
A habitable-zone orbit is a filter, not a discovery of life
HL only
A Goldilocks or habitable zone is the range of distances from a star where temperature could permit liquid water at a planet's surface. Planet size, gravity and atmosphere also matter, so zone membership establishes possibility only.
During a transit, some starlight passes through an exoplanet's atmosphere. Molecules absorb characteristic wavelengths, so the spectrum can reveal a water-vapour signature.
Observation
Supported claim
Not established
orbit lies in the habitable zone
surface liquid water could be physically possible
water is present
atmospheric water signature
water vapour is present in the atmosphere
surface liquid water or life exists
Separate evidence for origin, retention, water and life
HL only
Question
Relevant evidence or condition
Defensible conclusion
How could water arrive?
water-bearing meteorites and similar isotope ratios
Each step narrows a different uncertainty. None of these observations alone proves that surface liquid water—or life—exists on the planet being studied.
Connect cohesion to a biological consequence
[ 1 ]
Water shows strong cohesive properties. Which of the following can occur because of the cohesive properties of water?
Recognise adhesion from the contact pair
[ 1 ]
Which of the following is a consequence of the adhesive properties of water?
Explain a hydrogen bond precisely
[ 3 ]
Outline how hydrogen bonds form in water.
Use solvent behaviour to explain transport
[ 1 ]
Which can be explained by the solvent properties of water?
Make a comparison, not two isolated descriptions
[ 2 ]
Distinguish between the physical properties of water and air.
Distinguish water delivery from retention
HL only
[ 1 ]
It has been hypothesized that asteroids were the primary source of Earth's water. What has caused the retention of water on Earth?
A1.2 Nucleic acids
Explore how nucleotide components, bonding, base pairing and sequence give DNA and RNA their structures, information capacity, shared code and experimental significance.
Syllabus
First assessment 2025
Topic
A1.2
Level
HL
DNA stores the inherited information of living organisms
In every living organism, DNA is the genetic material. Its base sequence stores information that can be copied before cell division and passed between generations.
In eukaryotic cells, most DNA is organized into chromosomes in the nucleus. Mitochondria and chloroplasts also contain smaller DNA genomes.
Some viruses use RNA as their genetic material. This does not contradict the rule for living organisms because viruses depend on host cells and are not classified as living.
A nucleotide has three covalently connected parts
Every nucleotide contains:
a phosphate group
a five-carbon pentose sugar
a nitrogenous base
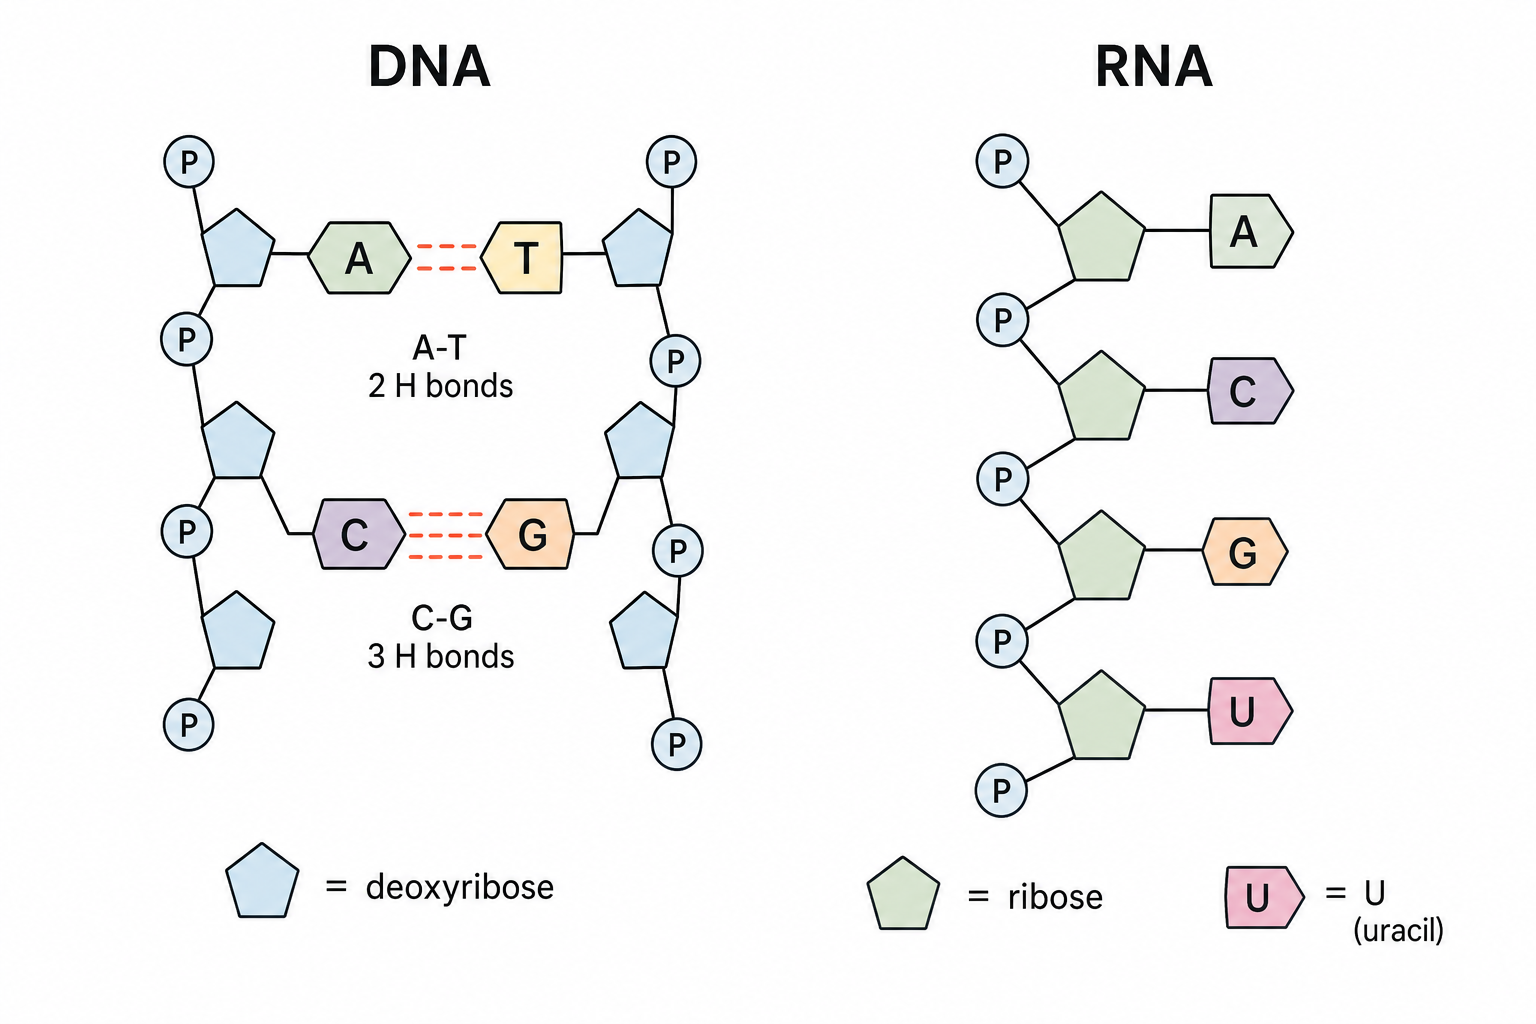
The sugar is the central connector: the base and phosphate are both bonded to it. DNA nucleotides contain deoxyribose; RNA nucleotides contain ribose. A base alone is not a nucleotide.
Family
Bases
Ring structure
Purines
adenine (A), guanine (G)
two rings
Pyrimidines
cytosine (C), thymine (T), uracil (U)
one ring
Condensation links nucleotides into a strong backbone
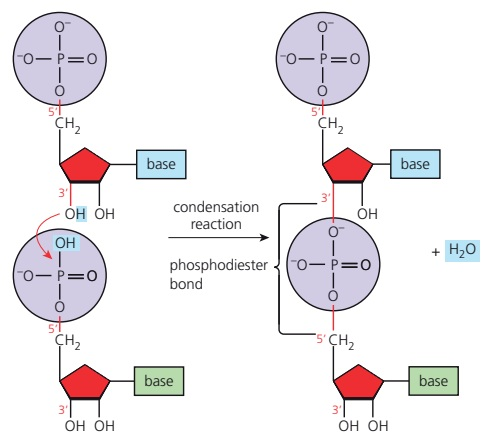
A condensation reaction joins the phosphate of one nucleotide to the sugar of the next, releases water and forms a covalent phosphodiester bond. Repetition produces a long polynucleotide.
Alternating sugar and phosphate form a continuous, unvarying backbone. The bases project from the sugars, so the molecule can keep the same structural support while its base sequence changes.
The changing base sequence carries the message
DNA uses: A, T, C and G
RNA uses: A, U, C and G
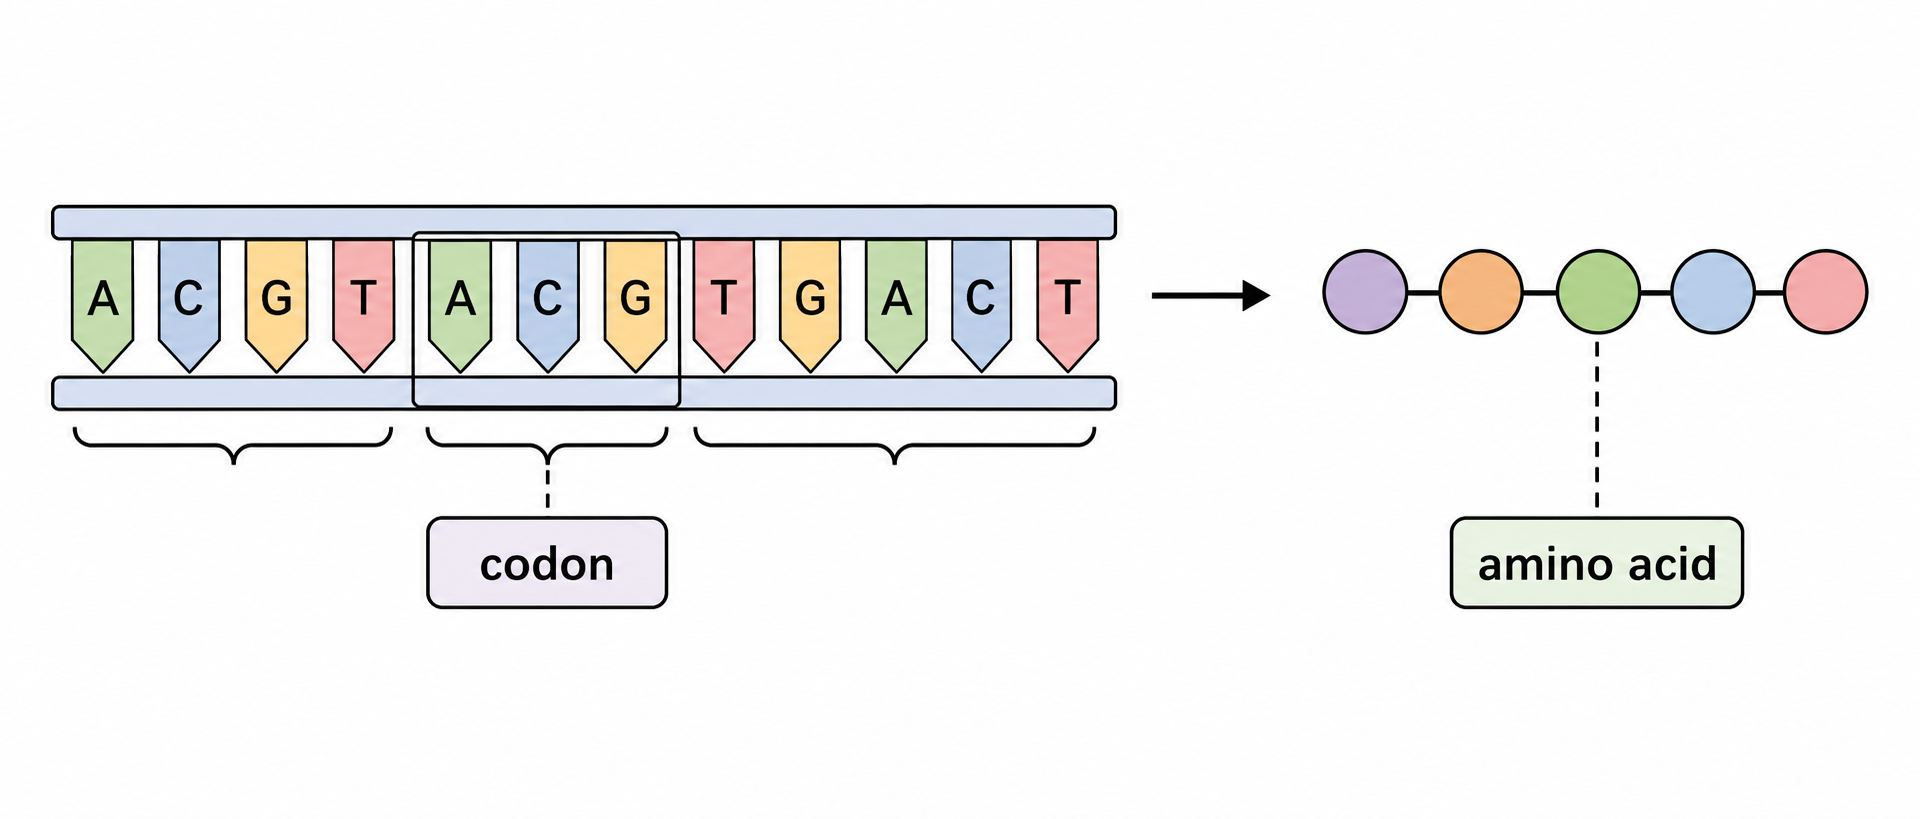
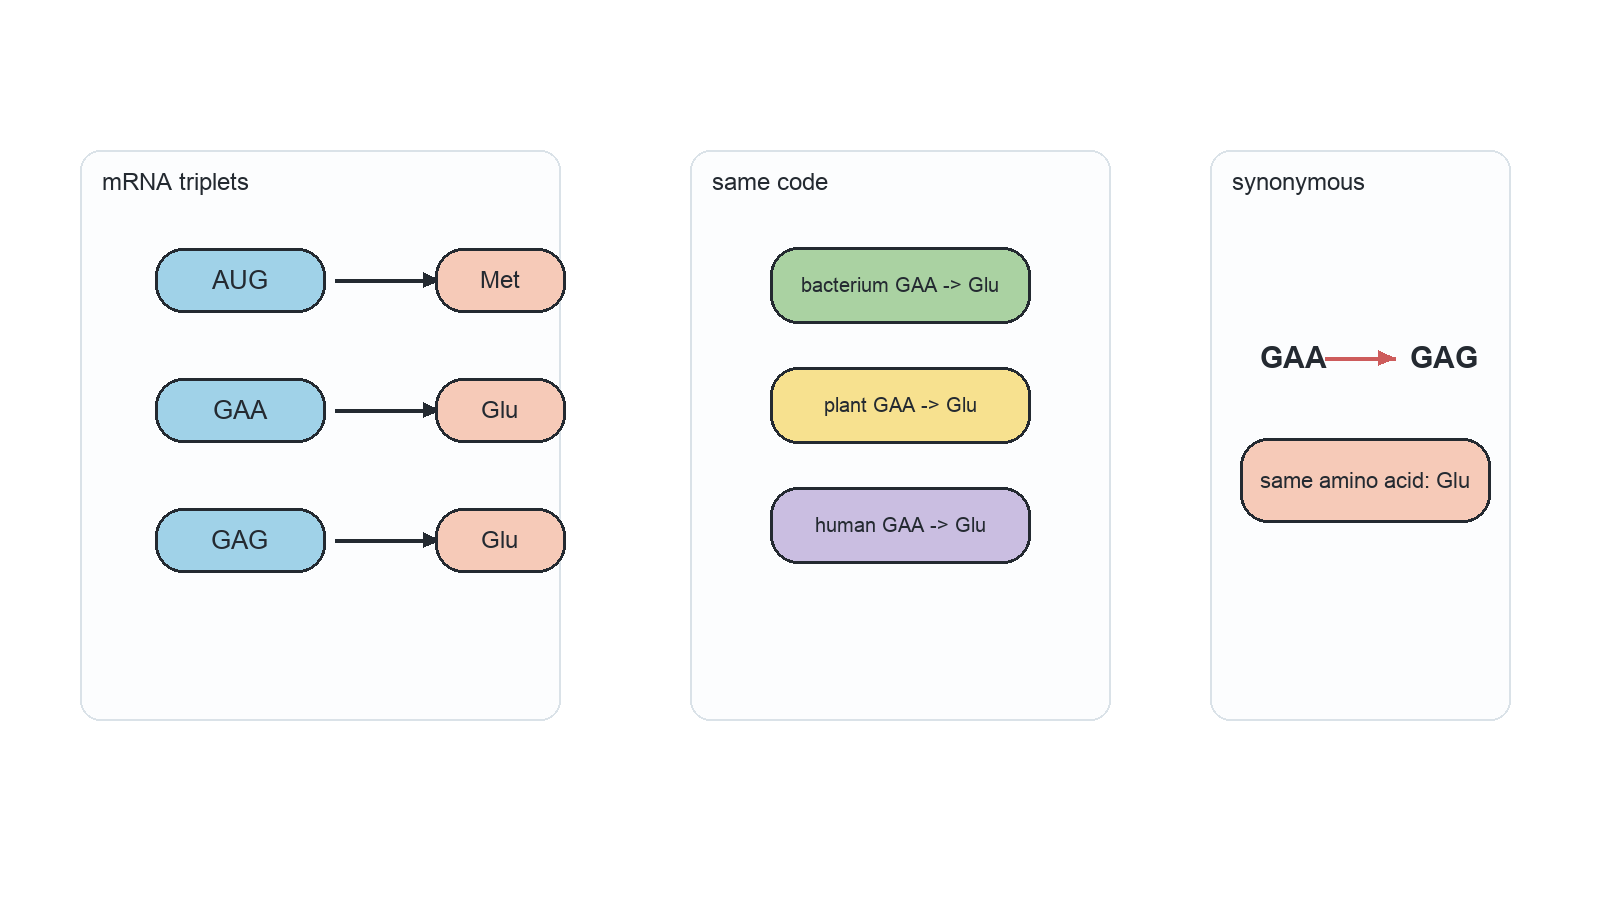
The sugar–phosphate backbone repeats, so it cannot encode a changing message. The order of bases can vary. When an RNA sequence is read in groups of three, each codon specifies an amino acid or a control signal, connecting nucleotide order to polypeptide sequence.
Four bases produce 64 possible triplets: 4 × 4 × 4. Different codons can specify the same amino acid, so the code is redundant.
One RNA polymer supports three different roles
RNA is usually a relatively short, single-stranded polynucleotide made by condensation of ribonucleotides. It contains ribose and the bases A, U, C and G.
RNA
Distinct contribution to protein synthesis
mRNA
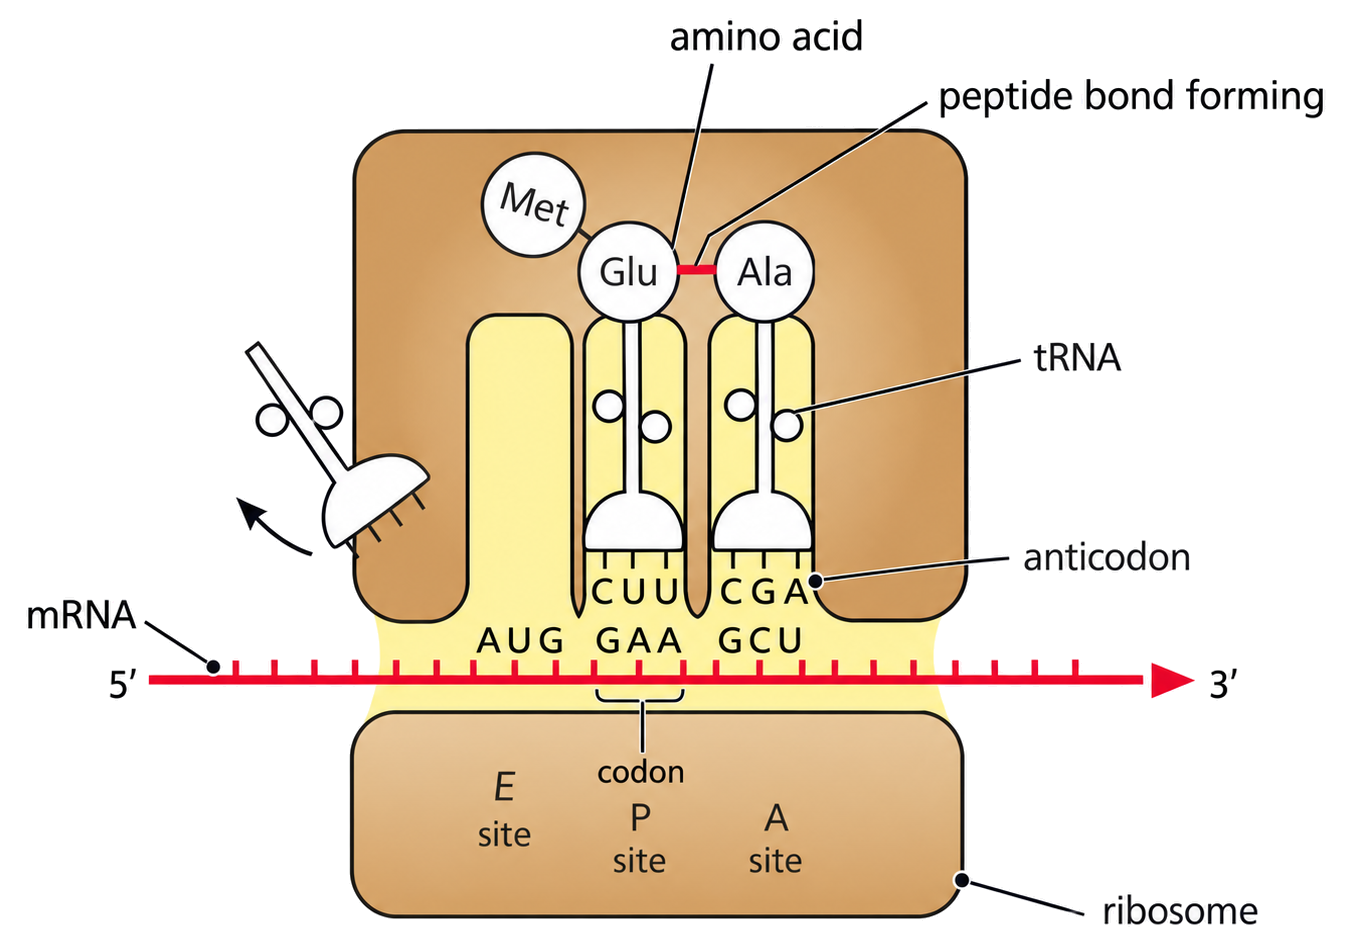
carries the codon sequence copied from DNA to a ribosome
tRNA
pairs its anticodon with an mRNA codon and delivers the corresponding amino acid
rRNA
forms the structural and catalytic core of the ribosome
These molecules share the same type of backbone and bases, but differences in sequence, length and folding give them different functions.
Complementary pairs connect the two DNA strands
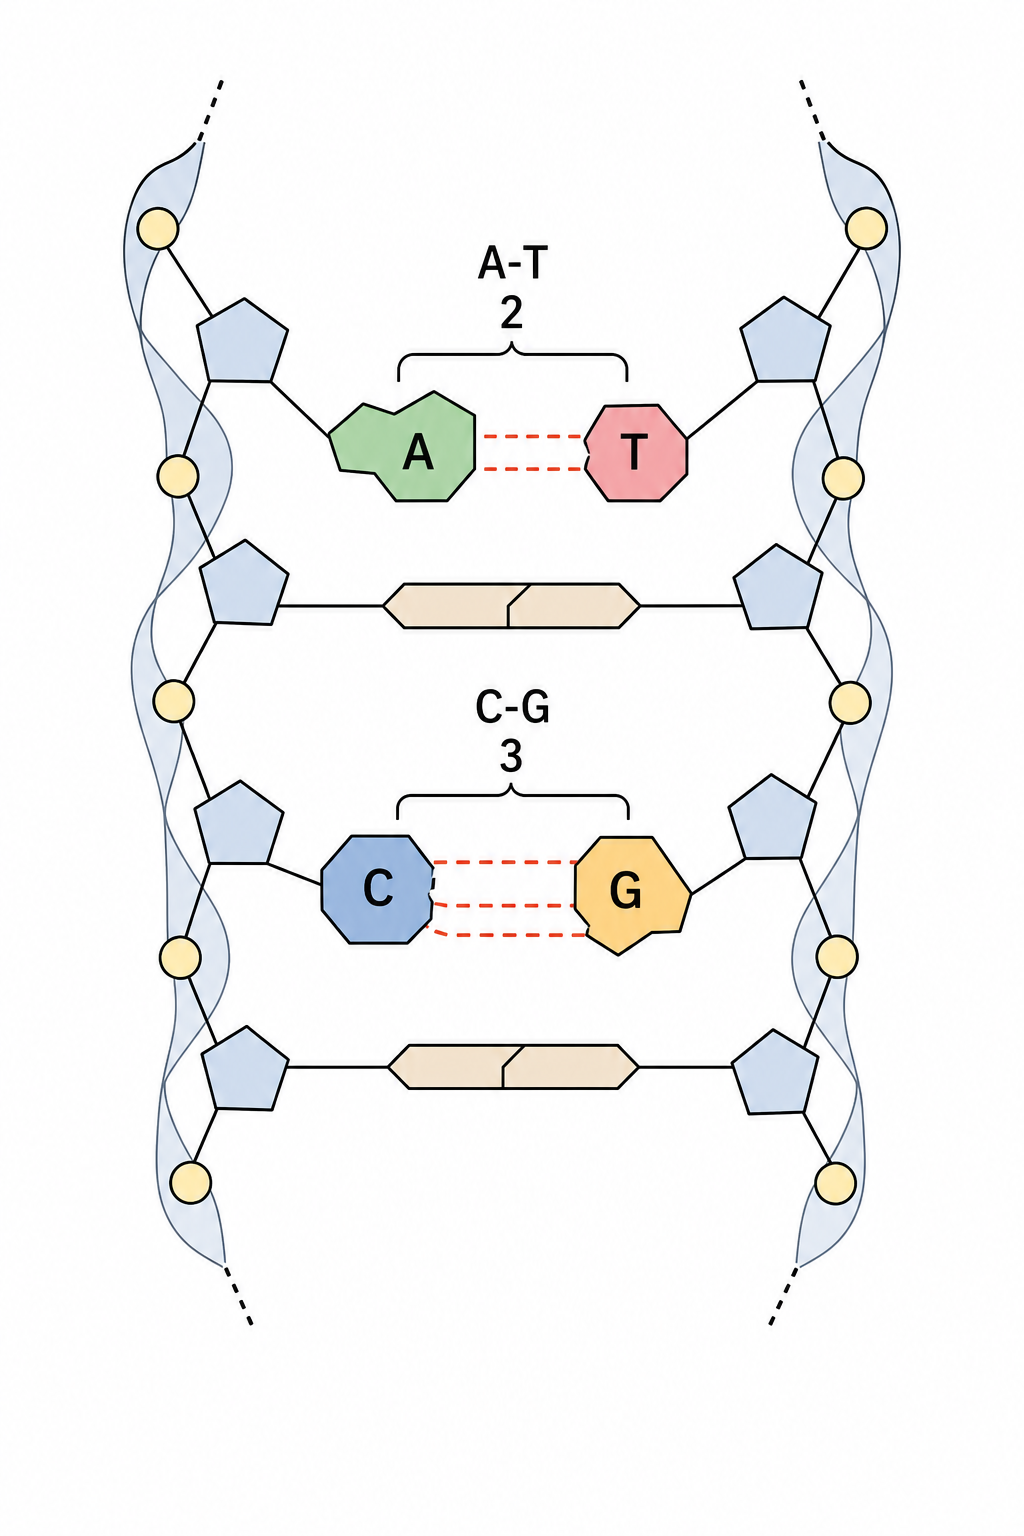
DNA contains two polynucleotide strands arranged antiparallel and wound into a double helix. The sugar–phosphate backbones face outward; bases project inward and pair through hydrogen bonds.
Adenine pairs with thymine: A–T
Cytosine pairs with guanine: C–G
In a structural diagram, attach every base to a sugar, alternate sugar and phosphate along each backbone, and show the two strands running in opposite directions. The helical twist is not required.
DNA and RNA differ in sugar, base and strand arrangement
Feature
DNA
RNA
Pentose sugar
deoxyribose
ribose
Distinctive base
thymine (T)
uracil (U)
Usual strand arrangement
two antiparallel strands
one strand
Typical relative length
very long
shorter
Both are polynucleotides with a sugar–phosphate backbone and bases A, C and G. Identify the differences using matched features rather than treating them as unrelated molecules.
Complementarity lets one strand specify another
Because each base has one complementary partner, the sequence of a template strand determines the sequence that is assembled against it. This is the common molecular logic behind copying and expression.
Process
Pairing used
Product specified by the template
DNA replication
A–T and C–G
a new DNA strand
Transcription
A–U and C–G
an RNA strand
Translation
mRNA codon–tRNA anticodon
the order of amino acids
Example: a DNA template written 3′-A C G T-5′ produces RNA 5′-U G C A-3′. The strands are complementary and antiparallel, not identical.
Four bases generate an immense sequence space
4n
For a sequence of n positions, each position can contain one of four bases, giving 4ⁿ possible sequences. Changing the length or the order changes the information, so long DNA molecules have enormous storage capacity.
Genome size is the total amount of DNA, whereas gene number counts genes. Neither value alone is a simple measure of organism complexity.
A nearly universal genetic code points to common ancestry
Across almost all living organisms, the same codons specify the same amino acids. Genes involved in transcription, translation and ribosome function are also highly conserved.
A complex decoding system shared so widely is best explained by inheritance from a common ancestor. Later evolution changed DNA sequences, but retained the core code and molecular machinery.
The code is nearly, not absolutely, universal. Minor exceptions do not erase the much larger conserved pattern. Redundancy also means that some base substitutions are synonymous and do not change the amino acid.
From nucleotide structure to inherited information
Build and store
Phosphate + pentose sugar + base form a nucleotide.
Condensation creates a covalent sugar–phosphate backbone.
The backbone repeats while base order varies, so the polymer stores information.
Copy and express
Complementary pairing lets one strand specify another. DNA replication preserves information; transcription produces RNA; codon–anticodon pairing helps translate the message into an amino-acid sequence.
Identify from
DNA
RNA
Sugar
deoxyribose
ribose
Distinctive base
T
U
Usual structure
double-stranded
single-stranded
The same structure-to-expression system operates across life, and the nearly universal code is evidence that living organisms inherited it from a common ancestor.
Direction controls how nucleic-acid strands are copied and read
HL only
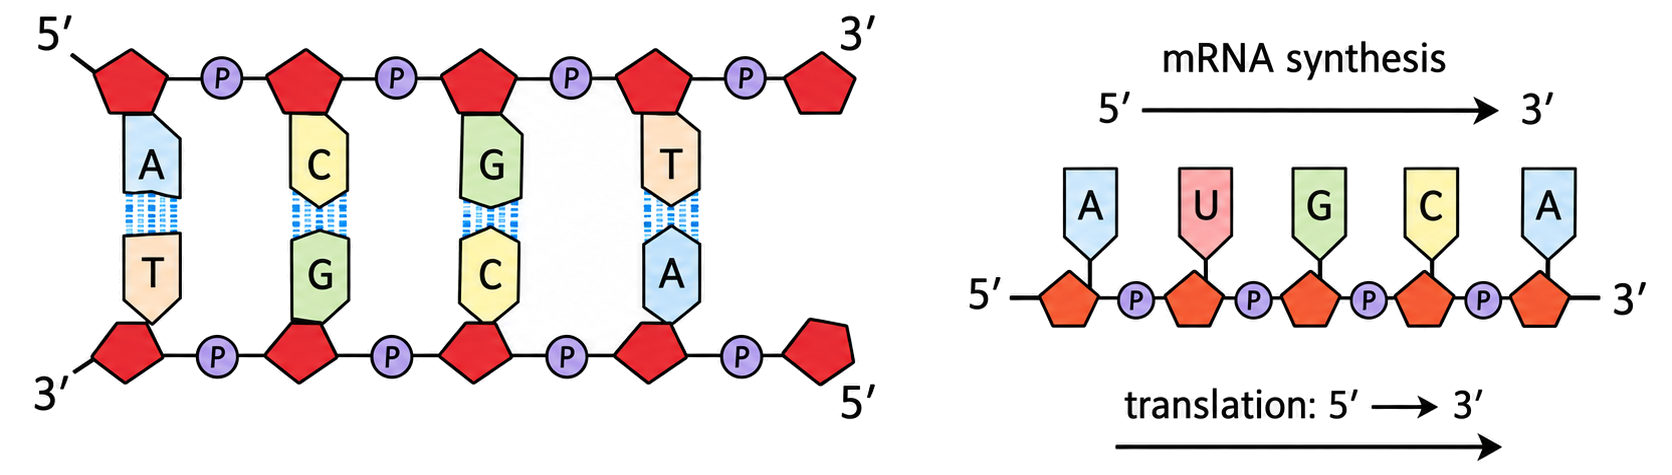
A phosphodiester bond joins the 3′ carbon of one sugar to the 5′ carbon of the next. The unequal ends give every strand a 5′ end and a 3′ end.
The two DNA strands are antiparallel.
New RNA is synthesized 5′→3′ while its DNA template is read 3′→5′.
Ribosomes translate mRNA 5′→3′.
Direction labels are part of the molecular structure. Reversing them changes the sequence being described and therefore changes how a template is interpreted.
Only A–T and C–G place hydrogen-bonding groups in compatible positions. Pairing therefore gives DNA both a nearly constant width and enough reversible attraction to stabilize the double helix.
Nucleosomes compact DNA while preserving controlled access
HL only
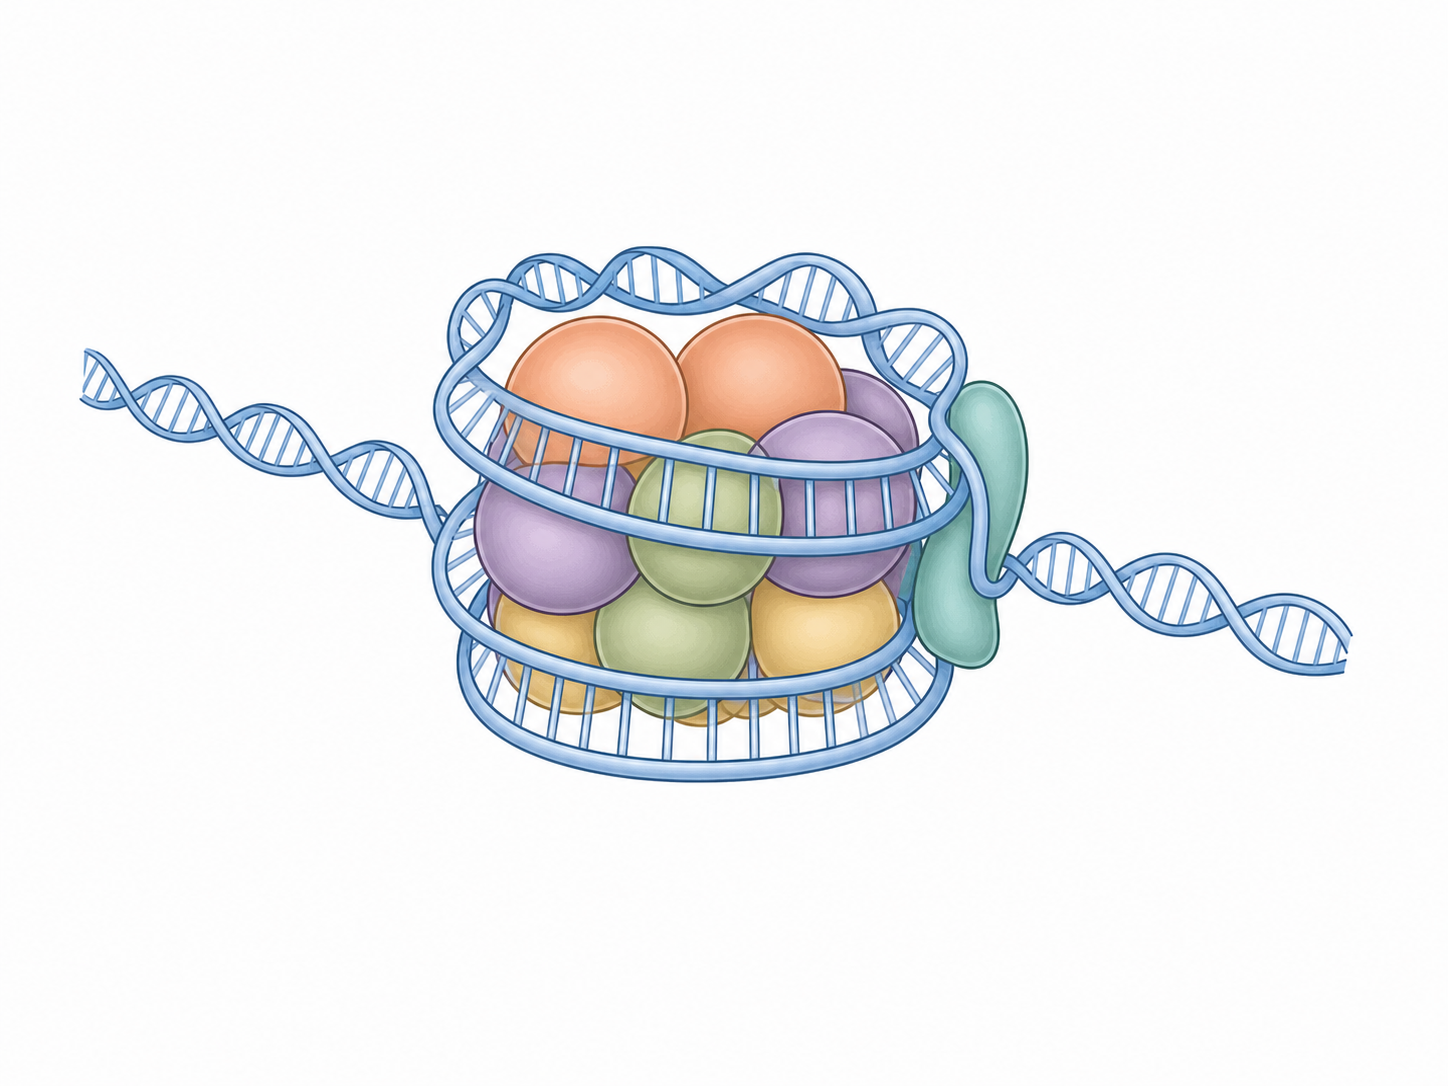
A nucleosome contains DNA wrapped nearly twice around a histone octamer—eight core histone proteins. Linker DNA joins neighbouring nucleosomes, and histone H1 binds near the linker and core.
DNA is negatively charged, while histones are rich in positively charged amino acids. Electrostatic attraction helps hold DNA around the histone core.
Repeating nucleosomes compact very long DNA molecules into chromosomes. Changes in how tightly DNA is packed also alter how easily transcription machinery can reach particular genes.
Hershey and Chase traced which phage molecule was inherited
HL only
1
Label: ³²P marked DNA because DNA contains phosphorus but no sulfur; ³⁵S marked protein because protein can contain sulfur but DNA does not.
2
Separate: labelled phages infected E. coli. Blending removed attached coats; centrifugation placed bacteria in the pellet and empty coats in the supernatant.
3
Infer: ³²P entered the bacteria and appeared in progeny phages, whereas most ³⁵S remained outside. DNA, rather than the protein coat, carried the information needed to make new phages.
Chargaff’s ratios ruled out a simple repeating DNA sequence
HL only
Observation across double-stranded DNA samples
What it constrained
A ≈ T
consistent with A–T pairing
G ≈ C
consistent with G–C pairing
A + G ≈ T + C
each pair contains one purine and one pyrimidine
base composition differs among species
DNA is not a fixed repeating A–T–G–C unit
The ratios supported complementary pairing and falsified Levene’s tetranucleotide hypothesis. They constrained a successful structural model, but the ratios alone did not reveal the complete double helix.
HL synthesis: molecular constraints and evidence converge
HL only
Constraint
Structural consequence
Biological significance
3′–5′ phosphodiester bonds
strands have direction and pair antiparallel
controls synthesis and reading direction
purine–pyrimidine pairing
helix width remains nearly constant
supports a stable, repeatable structure
DNA–histone association
nucleosomes compact DNA
packages DNA while regulating access
Evidence
Result
Conclusion supported
Hershey–Chase isotope labels
³²P-DNA entered cells and progeny; ³⁵S-protein mainly did not
The DNA model succeeds because molecular geometry explains its stable structure, complementarity explains copying, packaging explains chromosome organization, and independent experiments support DNA as the information-bearing molecule.
DNA as genetic material
[ 1 ]
The Human Genome Project completed the sequencing of the human genome by the year 2003. Which could have been a source of the entire genome in humans?
Components of a nucleotide
[ 3 ]
Draw a labelled diagram to show the structure of a DNA nucleotide.
Drawing canvas
Sugar-phosphate bonding
[ 2 ]
Outline the bonding between DNA nucleotides.
RNA as a polymer
[ 4 ]
Draw labelled diagrams to show the structure of RNA nucleotides and how they are linked together to form a molecule of RNA.
Drawing canvas
DNA as a double helix
[ 6 ]
Draw a simple labeled diagram to show the structure of a double stranded DNA molecule, comprising four nucleotides.
Drawing canvas
Differences between DNA and RNA
[ 3 ]
Distinguish between the structures of DNA and RNA.
Complementary base pairing
[ 1 ]
Deduce the base indicated by X on the diagram.
Diversity of DNA base sequences
[ 4 ]
Explain the diversity of possible base sequences in nucleic acids.
Conservation of genetic code
[ 1 ]
Some yeast genes can be replaced by human genes that then continue to produce the same human proteins in the yeast cells. Which statement helps to explain this evidence?
Directionality of RNA and DNA
HL only
[ 1 ]
Identify the terminal indicated by Y on the diagram.
Structure of a nucleosome
HL only
[ 4 ]
Outline the structure and functions of nucleosomes.
Hershey-Chase experiment
HL only
[ 3 ]
Explain how this data provides evidence that DNA is the genetic material of cells.
Chargaff's data
HL only
[ 2 ]
Explain the reasons for expecting a thymine percentage of 32.4 %.
A2.1 Origins of cells
The origin of cells links prebiotic environments, abiotic organic synthesis, membrane compartments, self-replicating RNA, radiometric evidence, and the shared ancestry of modern cellular life.
Syllabus
First assessment 2025
Topic
A2.1
Level
HL
Early Earth made different chemistry possible
HL only
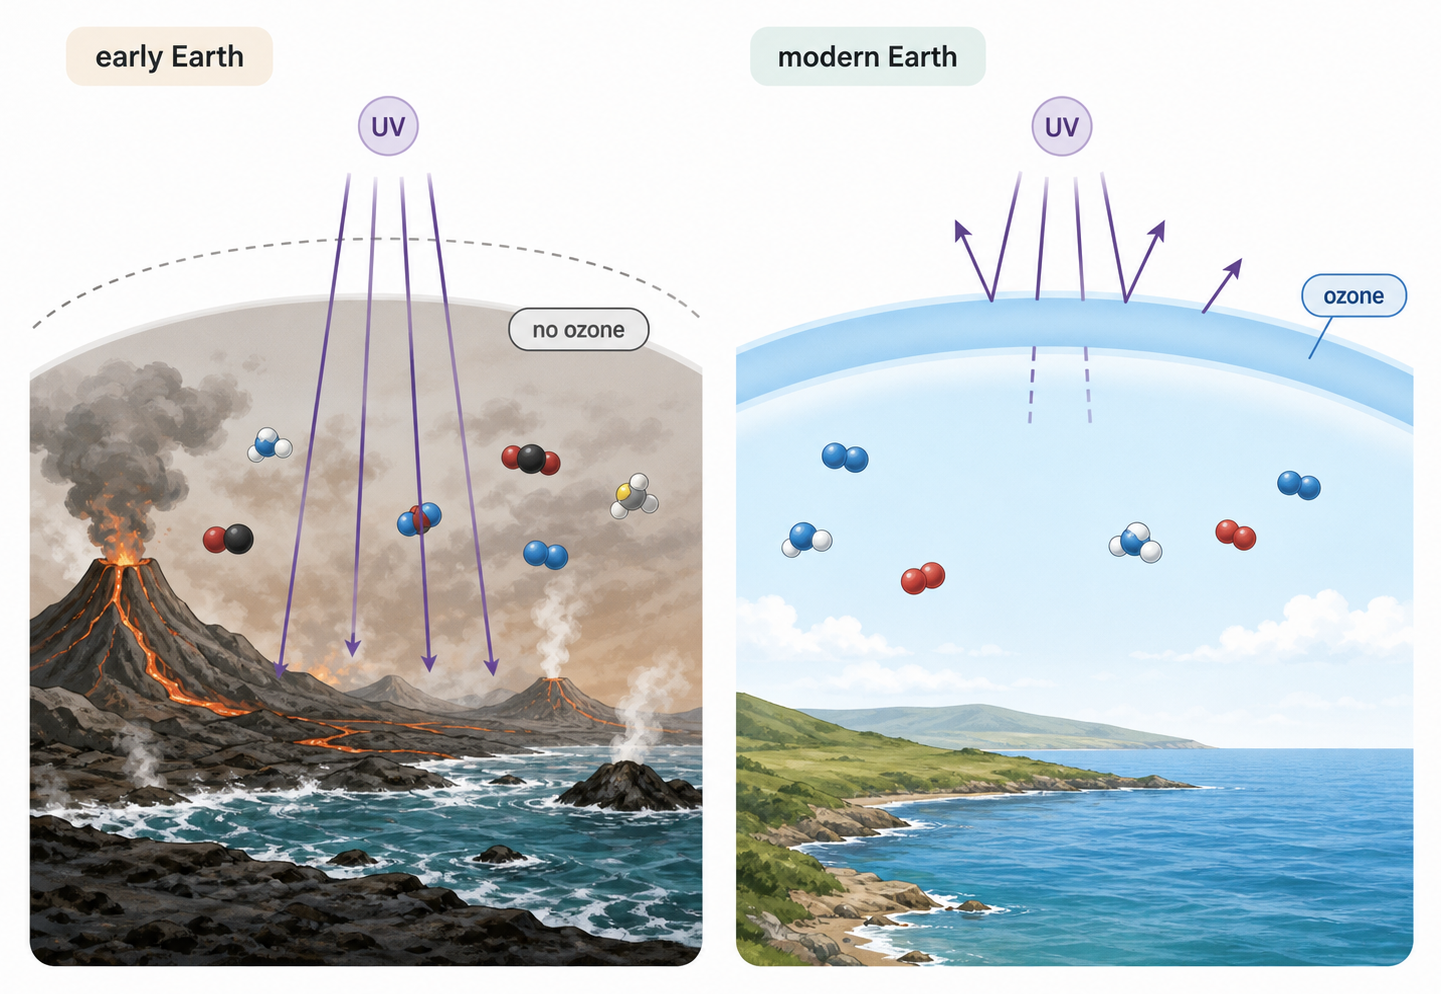
Volcanic activity supplied water vapour, CO₂, nitrogen and smaller amounts of gases such as methane and ammonia.
Free O₂ was scarce, so little ozone formed and intense ultraviolet radiation reached the surface.
CO₂ and methane strengthened greenhouse warming while water provided a reaction medium.
Water, simple reactants and energy from UV, heat or electrical discharges could produce carbon compounds abiotically. The exact atmosphere is uncertain, and high-energy radiation could both build and destroy molecules.
A cell integrates the systems needed for life
HL only
System
Contribution to a self-sustaining cell
Boundary case
Membrane compartment
Retains components and controls exchange
A vesicle has a boundary but is not automatically alive
Metabolism
Supplies matter and energy for maintenance and growth
A virus lacks independent cellular metabolism
Heredity with variation
Stores information and permits Darwinian evolution
Genetic material alone is insufficient
A cell is the smallest self-sustaining unit of life because these systems operate together. Viruses contain genetic material and evolve, but they depend on host-cell machinery for metabolism and replication.
Abiogenesis requires several linked transitions
HL only
1
Simple inorganic substances give rise to organic monomers such as amino acids, sugars, bases and fatty acids.
2
Monomers become concentrated and join into polymers; mineral surfaces such as clay may assist concentration and bond formation.
3
Some molecules store information, copy with heritable variation or catalyse reactions, allowing selection to begin.
4
A membrane encloses cooperating molecules so that internal metabolism can differ from the surroundings and be inherited together.
Competing hypotheses change the order of events
HL only
Hypothesis
Proposed first system
A testable expectation
Protocell-first
A growing, dividing compartment with simple metabolism
Cell-like units can arise and divide without a complete genetic system
Gene-first
Self-replicating RNA or related molecules
RNA systems can sustain replication, variation and evolution
Metabolism-first
Self-maintaining reaction networks on mineral surfaces
Fed chemical networks can become autocatalytic and produce cell components
All three models address real transitions, but no experiment can recreate the exact history. Evidence can support a mechanism without proving that it occurred first on Earth.
Miller–Urey tested chemical feasibility—not the creation of life
HL only
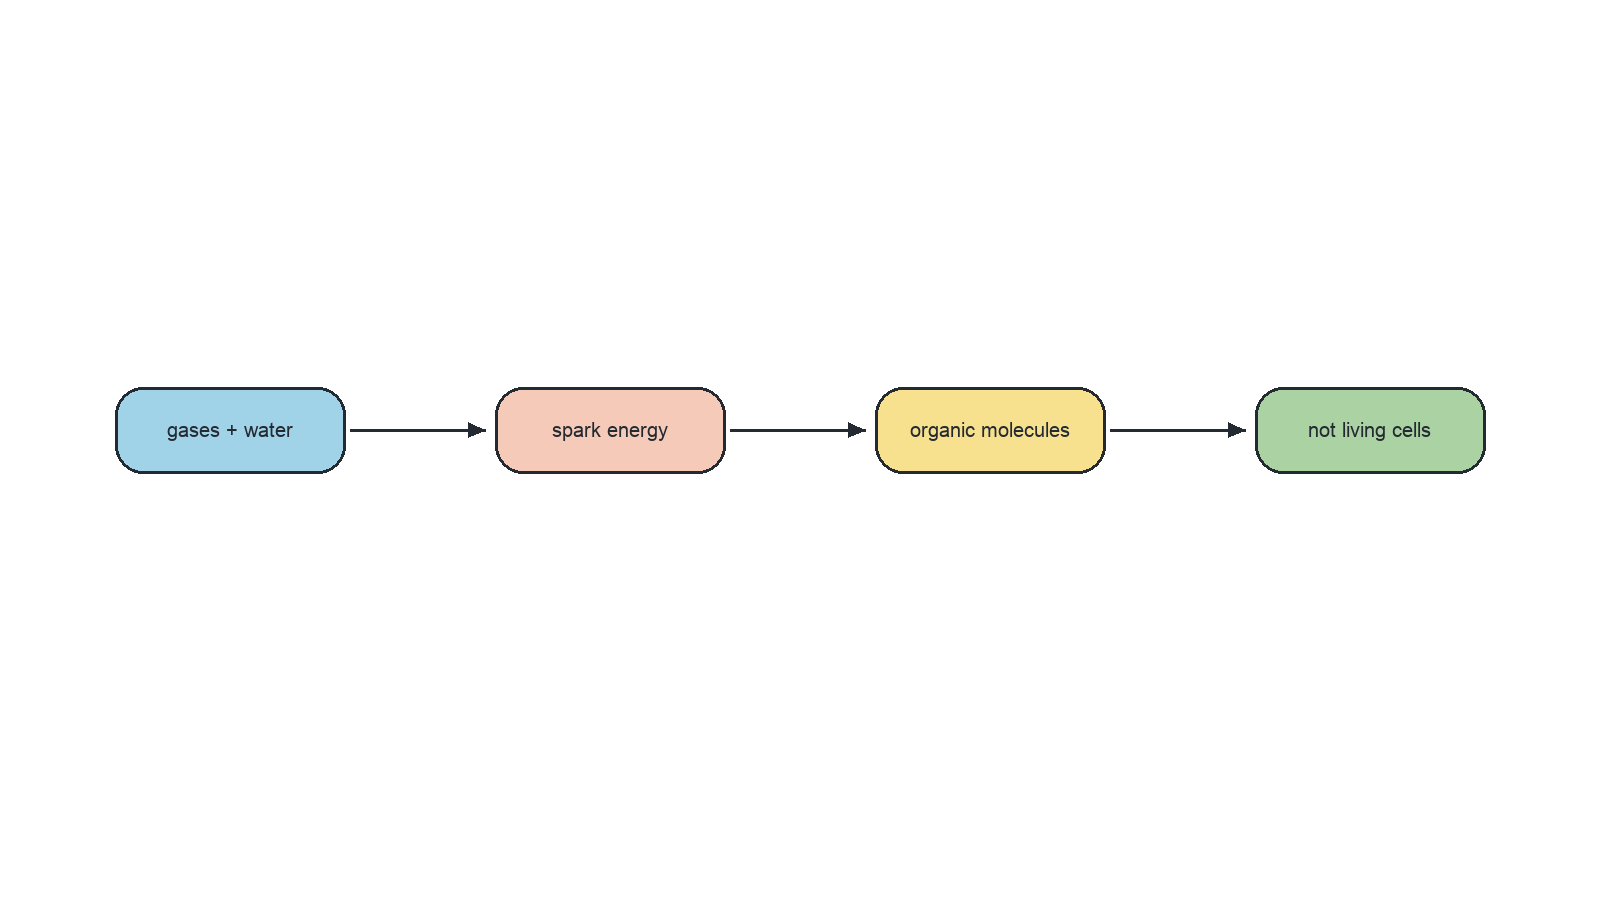
Water was heated; vapour circulated with CH₄, NH₃ and H₂; electrical sparks supplied energy; a condenser cooled the mixture; organic products including amino acids accumulated in the trap.
Later experiments using different gases and energy sources have produced:
amino acids and fatty acids
sugars and nucleotide bases
in some conditions, simple polymers
Together, the results support abiotic synthesis under some conditions. They do not show that a cell formed or that any experimental gas mixture exactly matched early Earth.
Amphipathic fatty acids can create compartments
HL only
In water, polar regions face the water while non-polar regions turn away. As concentration rises, amphipathic molecules can form layers that curve and close into vesicles without cellular machinery.
A closed vesicle retains monomers, polymers and catalysts, allowing a distinct internal chemistry. Simple fatty acids are plausible early membrane components because they are chemically simpler than modern phospholipids. A compartment alone still lacks dependable heredity and metabolism.
RNA can link heredity with catalysis
HL only
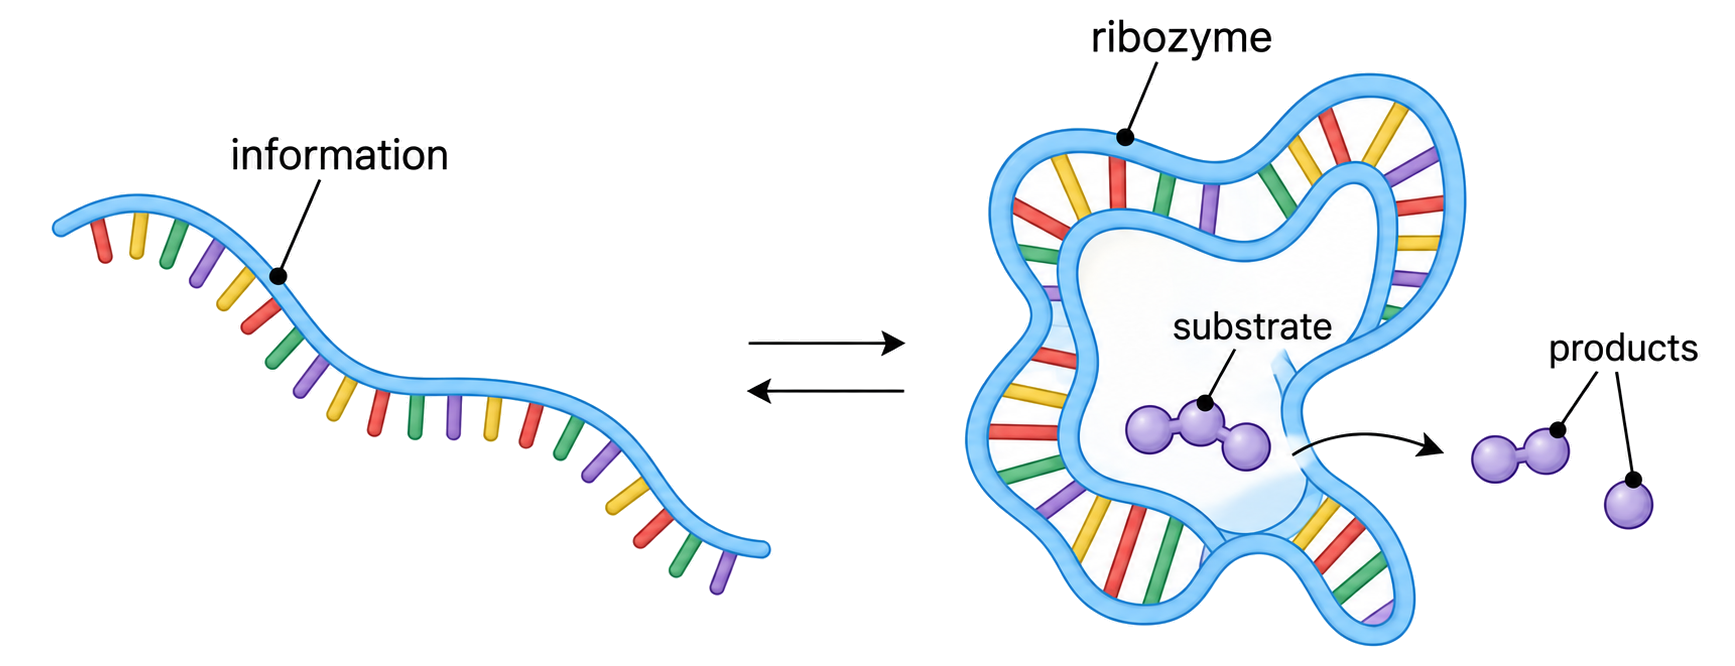
RNA base sequence can store information, while intramolecular base pairing lets the strand fold into a catalytic shape. A replicating RNA system could therefore connect heredity, variation and chemical function before DNA genomes and protein enzymes dominated.
Modern cells retain several possible relics of an RNA world:
catalytic RNA molecules called ribozymes
rRNA catalysis of peptide-bond formation in ribosomes
RNA primers required to begin DNA replication
ribose formation under plausible prebiotic conditions
These observations support an RNA-world hypothesis, but they do not identify the first replicator or reconstruct the complete historical sequence.
Shared molecular machinery points back to LUCA
HL only
LUCA is the inferred last ancestral population shared by all surviving cellular life. It links the earlier abiotic phase to the continuous lineages from which Bacteria, Archaea and Eukarya descended; it was not necessarily the first life or one individual cell.
Nearly universal genetic code and shared biochemistry → conserved ribosome and core gene families across distant lineages → common inheritance is more parsimonious than repeated independent origin.
Researchers compare modern genomes, identify widespread homologous genes and exclude likely horizontal transfers. The surviving genes reveal some LUCA traits, but extinct lineages and lost genes cannot be reconstructed directly.
Dating methods constrain different events
HL only
Method
What is estimated
Essential condition or limit
Fossil plus radiometrically dated rock
Minimum age of the organism or lineage
Fossil must be biological and geological context secure
Isotopic or chemical signature
Minimum age of possible biological activity
Abiotic explanations must be excluded
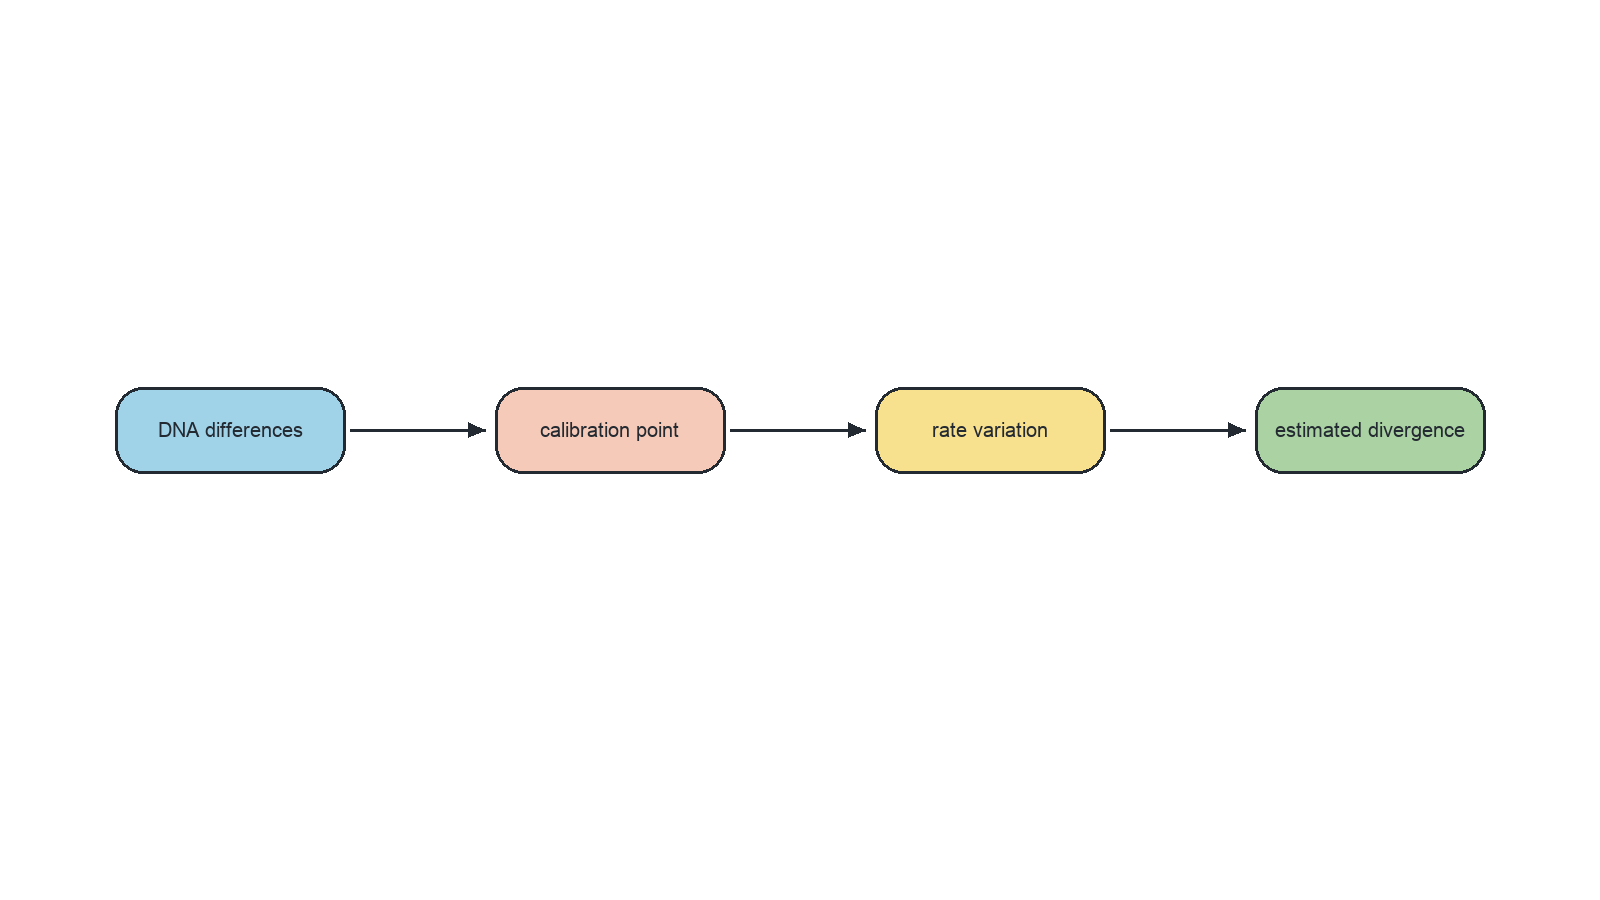
Molecular clock
Time of lineage divergence
Rate must be calibrated and may vary among genes and lineages
A 3.77-billion-year-old fossil means life existed by then; it does not date the first cell. Fossils, rock dates and molecular clocks converge on very ancient life and a LUCA near 4 billion years ago, but they do not provide an exact birthday.
Independent evidence converges on hydrothermal vents
HL only
Two independent evidence lines converge:
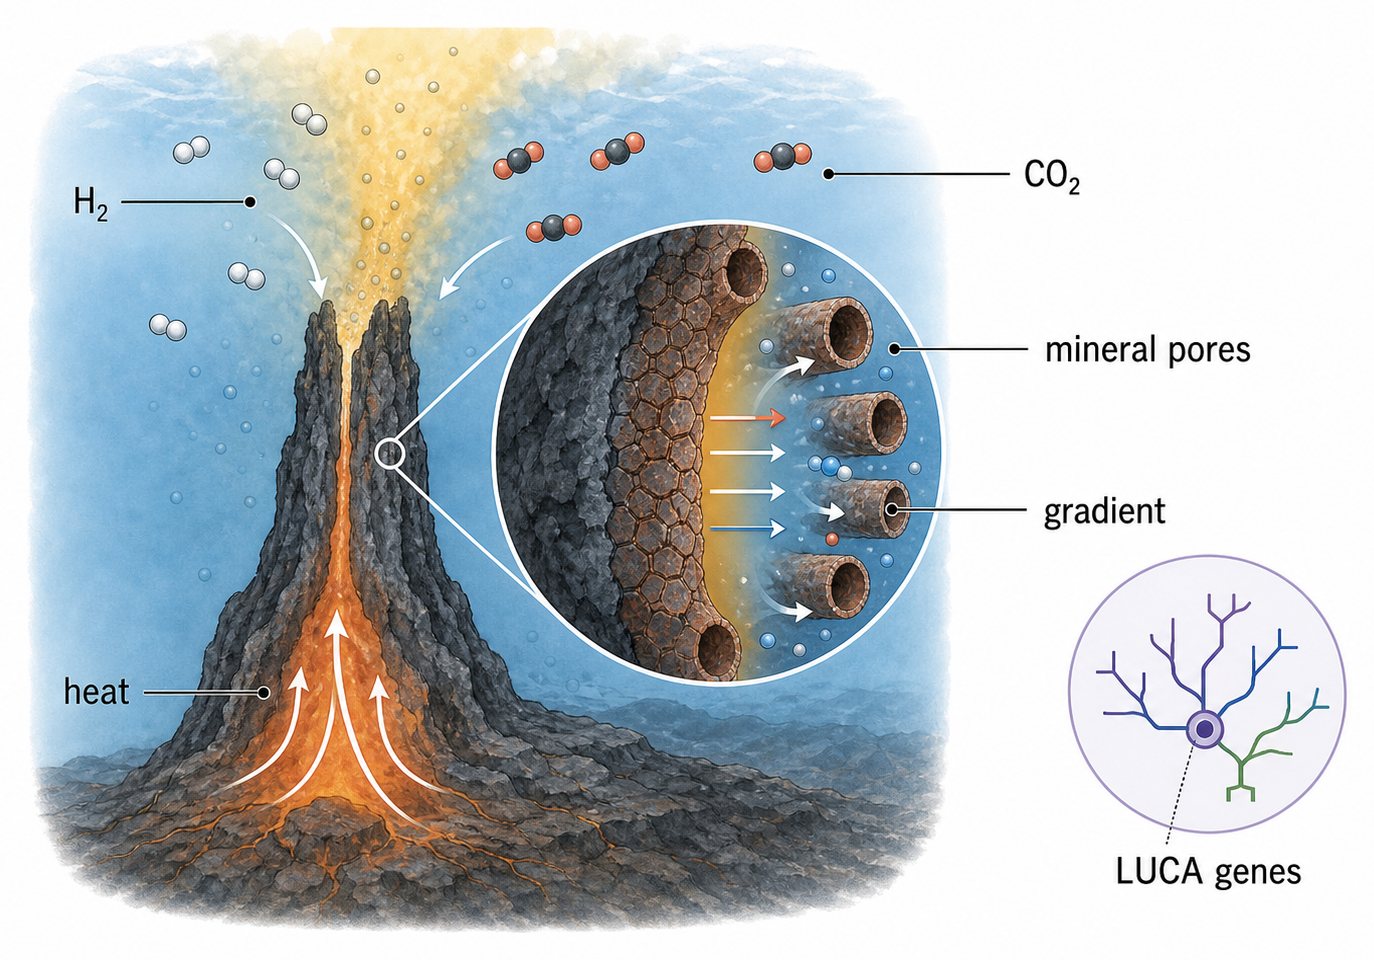
Geology: ≥3.77-billion-year-old Nuvvuagittuq vent rocks contain haematite tubes and carbonaceous material compatible with microbial activity.
Genomics: conserved genes suggest LUCA was anaerobic, H₂-dependent, CO₂-fixing, N₂-fixing and thermophilic.
Vents provide H₂, CO₂, iron-rich minerals, heat, pores and chemical gradients, allowing chemosynthetic energy transfer without sunlight. Tube shape alone is not proof of life, and gene-based physiology is a reconstruction; convergence makes the setting plausible rather than certain.
Summary: follow the evidence from chemistry to common ancestry
HL only
Early reactants + energy → organic monomers → polymers and catalysts → compartments → heredity, metabolism and selection. Miller–Urey, vesicle self-assembly and RNA catalysis show that individual transitions are chemically feasible; they do not reconstruct one proven route.
Shared molecular machinery → LUCA. Fossils, dated rocks and molecular clocks → minimum ages and divergence estimates. Vent fossils + inferred physiology + geochemistry → a plausible environment for early cellular evolution.
Ask for every origin claim
Example
What was observed?
Organic products, conserved genes or haematite tubes
What does it support?
A feasible mechanism, common ancestry or a vent setting
What remains uncertain?
Exact sequence, date, environment or extinct alternatives
Conditions on early Earth
[ 3 ]
This investigation was performed in a chamber at 85∘C leading to total evaporation of the salt water within one day. The atmosphere inside the chamber consisted of nitrogen, carbon dioxide and water vapour. Evaluate the experiment on the basis of similarity with conditions that existed on the prebiotic Earth.
Cells as smallest units of life
[ 1 ]
Which of the following characteristics found in a structure necessarily indicates that it is alive?
Spontaneous origin of cells
[ 3 ]
Describe processes needed for spontaneous origin of life on Earth.
Evidence for origin of carbon compounds
[ 1 ]
The Miller-Urey experiment carried out in 1952 tested the hypothesis of the chemical origin of life. What were the key findings?
Spontaneous formation of vesicles
[ 1 ]
State the name for primitive, phospholipid-enclosed structures that may have preceded cells.
RNA as presumed first genetic material
[ 5 ]
Describe the structure of RNA and the evidence that it was the first genetic material used to store information.
Dating first cells and LUCA
[ 2 ]
Outline the use of two named radioisotopes for dating fossils.
Evolution near hydrothermal vents
[ 2 ]
Outline how organic compounds may have been synthesized deep in the oceans.
A2.2 Cell structure
Cell structure connects microscopy, universal cellular organization, prokaryotic and eukaryotic diversity, specialized exceptions, differentiation, and evolutionary explanations for complex cells and multicellularity.
Syllabus
First assessment 2025
Topic
A2.2
Level
HL
A cell is an integrated living unit
A cell is the smallest membrane-bounded unit that can carry out the processes of life. A tissue is different: it is a group of cells cooperating in a shared function.
Cell theory states that:
living organisms consist of one or more cells
cells are the basic units of structure and function
new cells arise from pre-existing cells
The theory is a powerful biological model, not a claim that every cell has the same appearance. Later examples such as multinucleate fibres and mature cells without nuclei test its boundaries without removing the central idea that living organization is cellular.
Prepare and focus a specimen without losing it
1
Make a thin temporary mount, add a coverslip, and use an appropriate stain when transparent structures need contrast.
2
Start with the low-power objective. Centre the specimen while the field of view is wide.
3
Bring the image into focus with coarse adjustment, then sharpen it with fine adjustment while moving the stage away from the objective.
4
Rotate to a higher-power objective only after centring. Use fine focus only because the working distance is now small.
5
Record the specimen, stain, objective and any measurement. Preparation and staining may alter appearance, so observed features must be interpreted as evidence rather than treated as untouched reality.
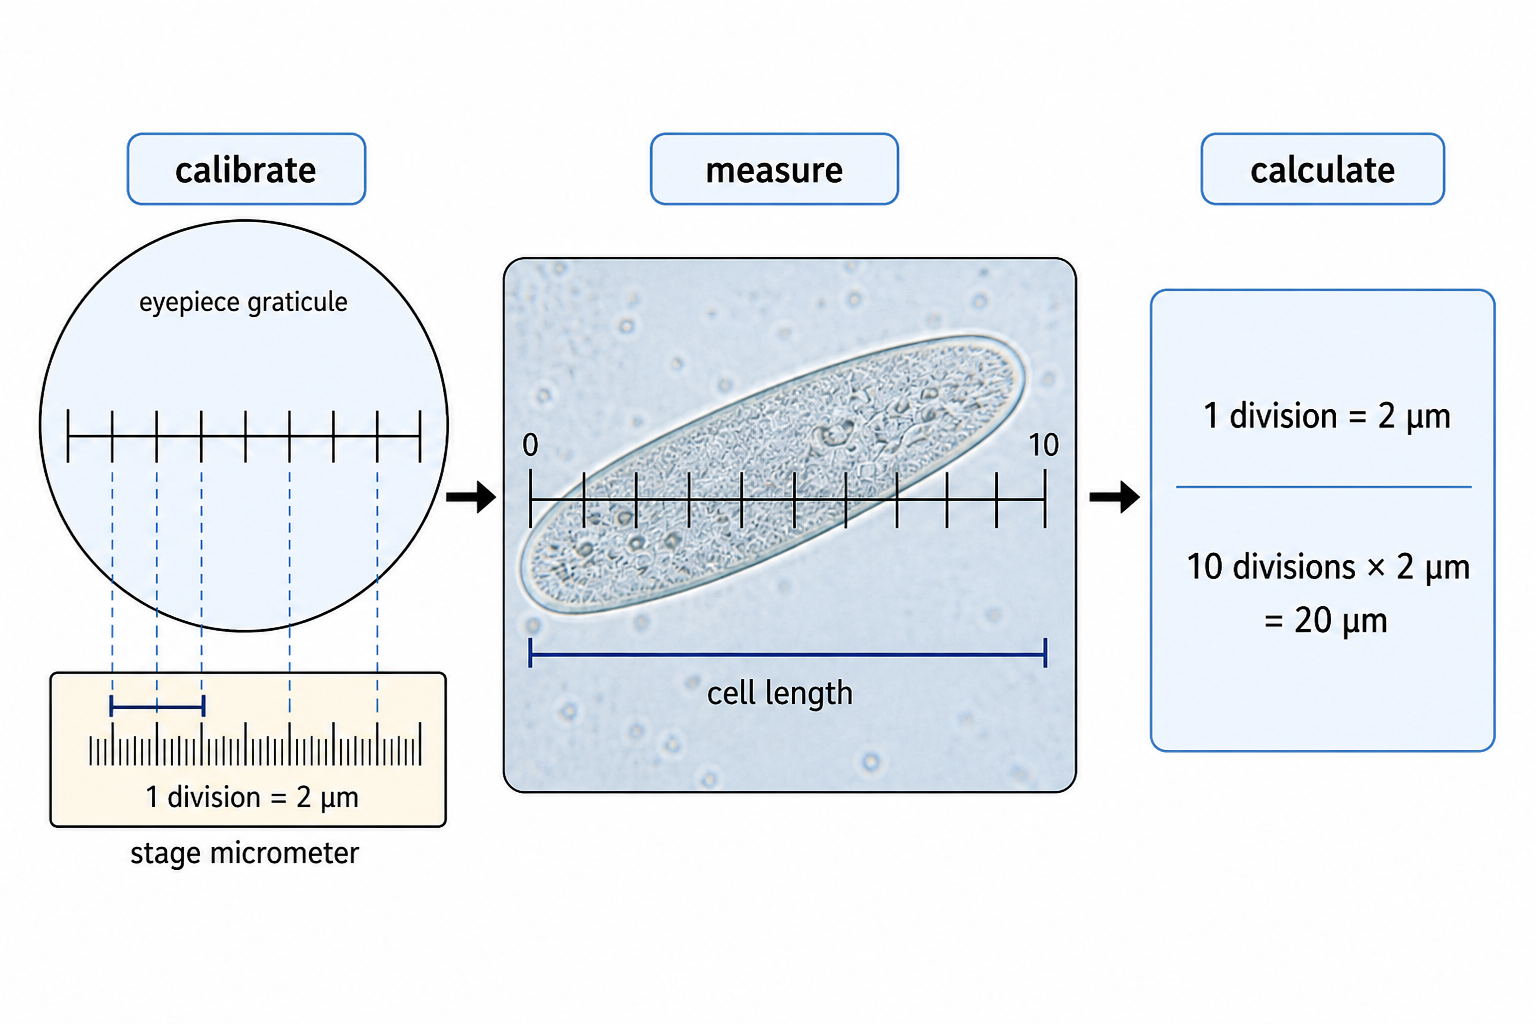
Calibrate before converting divisions into micrometres
M=AIA=MII=A×M
At one objective, 10 graticule divisions correspond to 20 µm, so each division represents 2 µm. A cell spanning 18 divisions is therefore 36 µm long. If its printed image is 54 mm long, convert 54 mm to 54,000 µm before calculating: M=54,000/36=1,500×.
Calibration belongs to a particular objective lens. Changing the objective changes the real distance represented by one graticule division, so the calibration must be repeated.
Choose the microscope for the evidence you need
Magnification makes an image larger; resolution allows two close points to be seen as separate. Enlarging beyond the resolution limit only produces a larger blur.
Evidence needed
Useful method
Important limit
living cells and larger structures
compound light microscopy
about 0.2 µm resolution
location of a named molecule
fluorescence or immunofluorescence
the dye or antibody identifies only its target
internal ultrastructure in a thin section
TEM
specimen is fixed, stained and viewed in vacuum
surface form
SEM
shows surface, not a thin internal section
near-native molecular structure
cryo-EM
frozen samples and computational reconstruction are required
Preparation can introduce artefacts. Confidence increases when different preparation methods reveal a consistent structure, rather than when one impressive image is accepted alone.
Four components make every cell a workable system
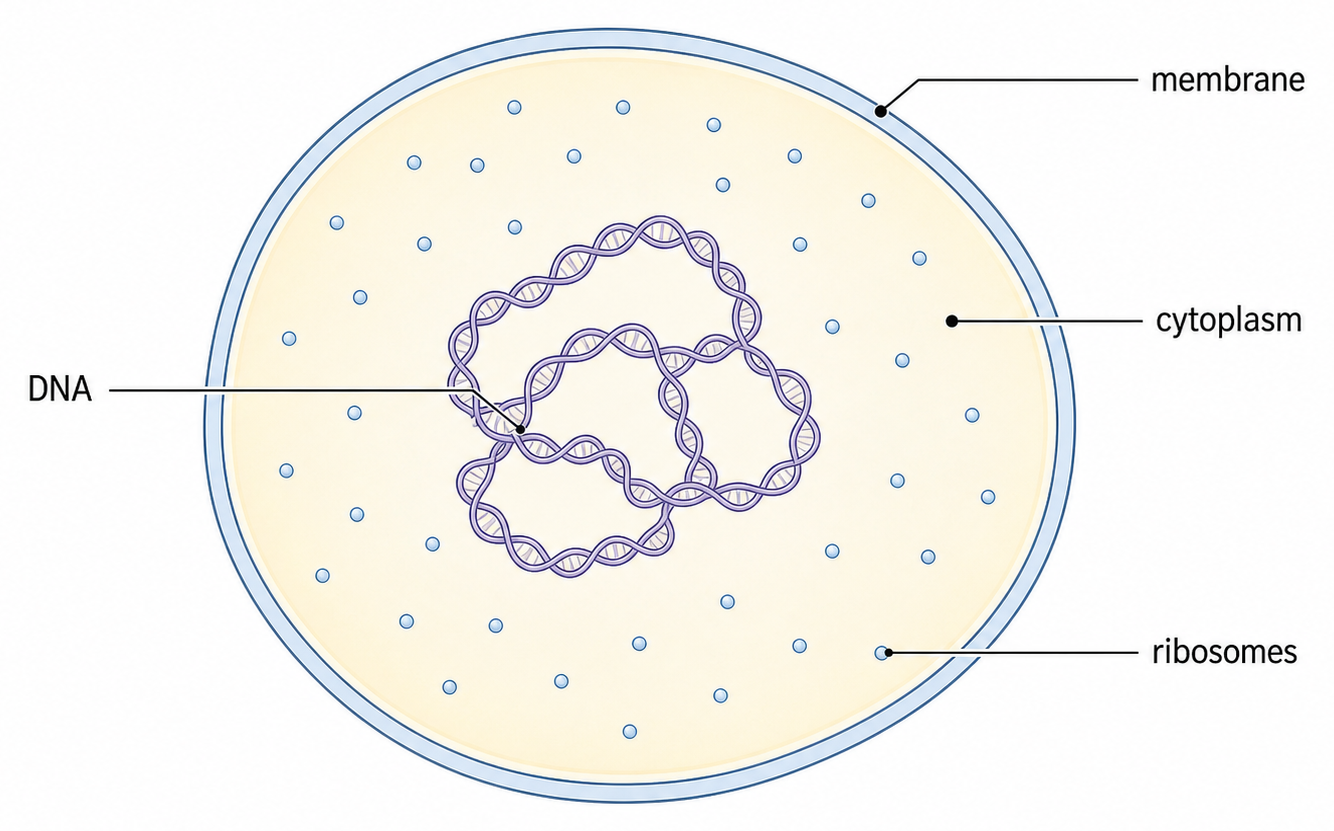
All cells contain:
a plasma membrane that controls exchange with the surroundings
cytoplasm in which metabolic reactions occur
DNA that stores inherited information
ribosomes that translate information into polypeptides
None of these components alone is a cell. Together they create a bounded chemical system that can maintain itself, use information and make the proteins needed for its activities.
A prokaryote concentrates life in one small compartment
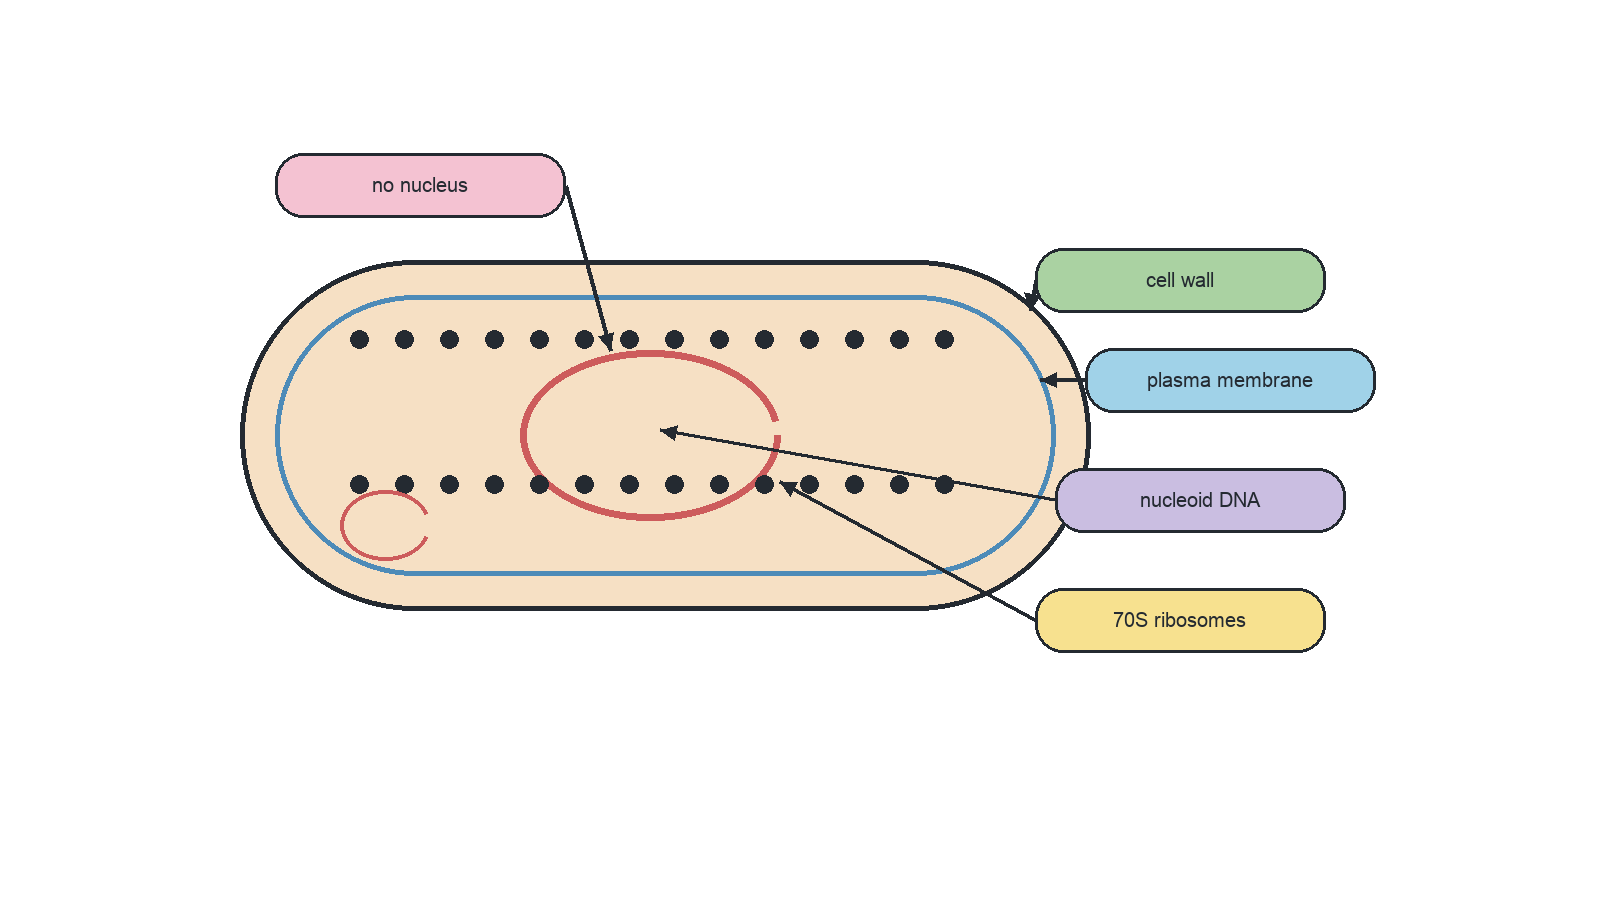
A prokaryotic cell has no nucleus and no membrane-bound organelles. Its single circular, naked chromosome occupies a nucleoid region in the cytoplasm, where 70S ribosomes make proteins. In eubacteria, a peptidoglycan wall lies outside the plasma membrane.
Plasmids, capsules, pili, flagella and specialized membrane regions occur in some bacteria, not all. E. coli, Bacillus and Staphylococcus also differ in shape and wall organization, so no optional feature should be treated as the definition of a prokaryote.
Eukaryotic compartments divide and connect cellular work
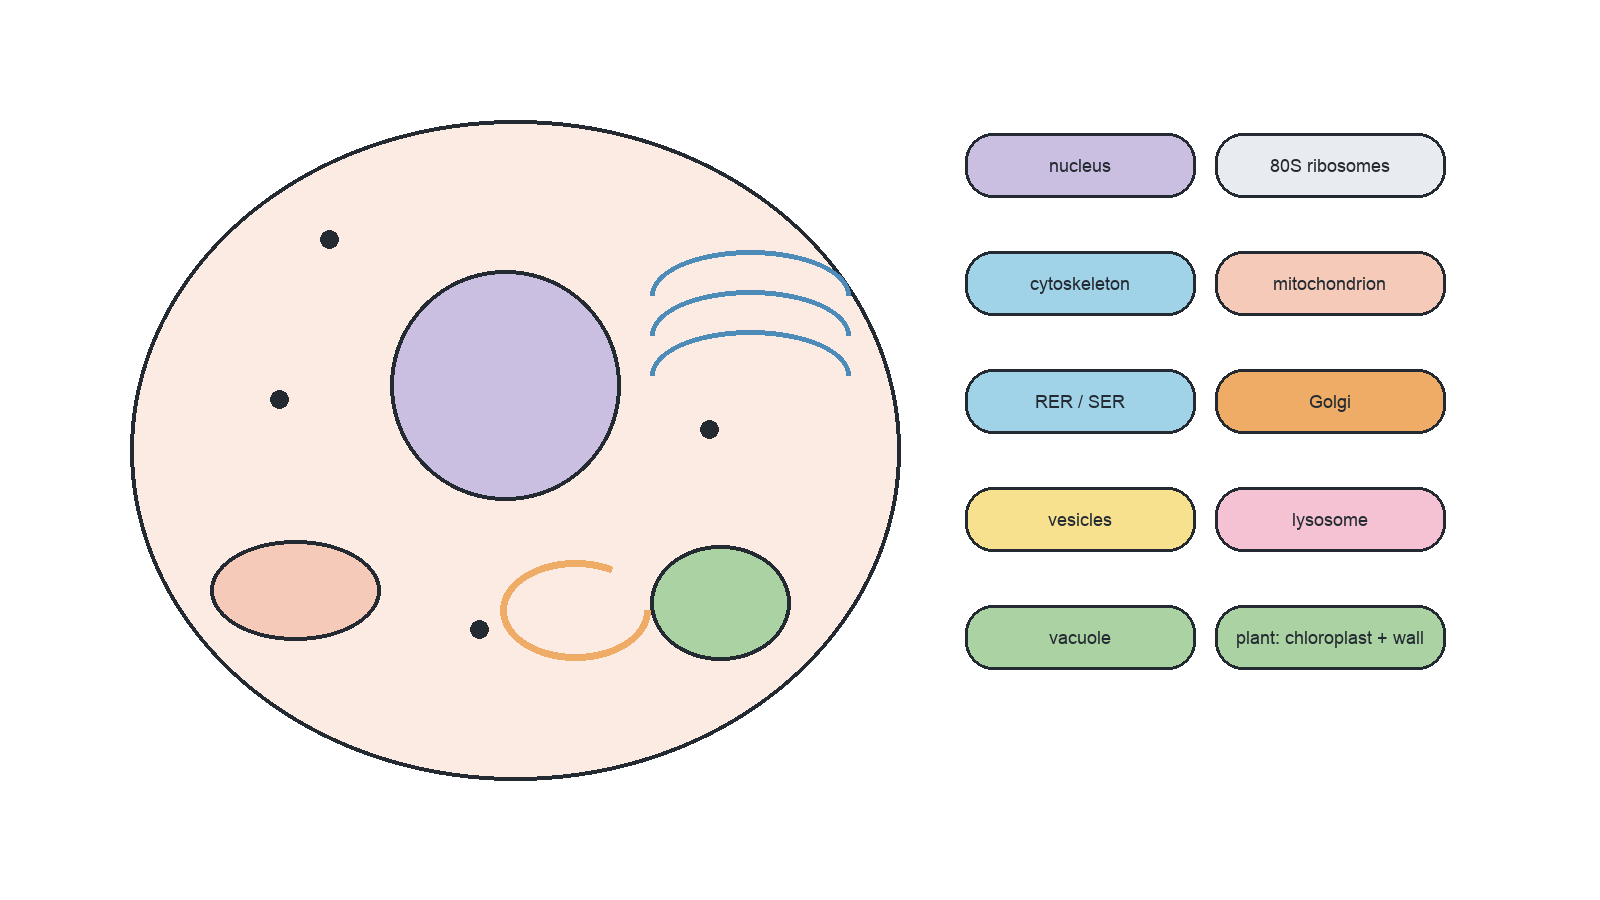
A eukaryotic cell encloses linear chromosomes in a nucleus and uses membrane-bound organelles to maintain different reaction conditions. Mitochondria transfer energy to ATP; the ER, Golgi apparatus, vesicles and lysosomes form a connected system for synthesis, transport, modification and digestion.
For a secreted protein, information and material move through a coordinated route: nuclear gene → transcription → rough-ER ribosome → ER lumen → transport vesicle → Golgi modification and sorting → secretory vesicle → plasma membrane.
The cytoskeleton gives internal organization and shape. Microtubules guide vesicles and move chromosomes; actin microfilaments resist tension and contribute to cell movement and shape change.
One cell must complete every life process
A unicellular organism cannot delegate essential work to tissues. Nutrition, metabolism, homeostasis, excretion, response, movement, growth and reproduction must all be achieved within one cell.
Life process
Amoeba or Paramecium
Chlamydomonas
E. coli
nutrition
engulfs particles into food vacuoles
photosynthesizes and absorbs ions
absorbs small molecules
water balance
contractile vacuoles expel excess water
membrane transport and vacuoles regulate contents
membrane transport maintains cytoplasm
movement or response
pseudopodia or cilia respond to local conditions
flagella and light-sensitive responses
receptors and flagella in motile strains
reproduction
cell division
cell division
binary fission
The structures differ, but the same functional problem remains: matter, information and energy must be coordinated inside one bounded cell.
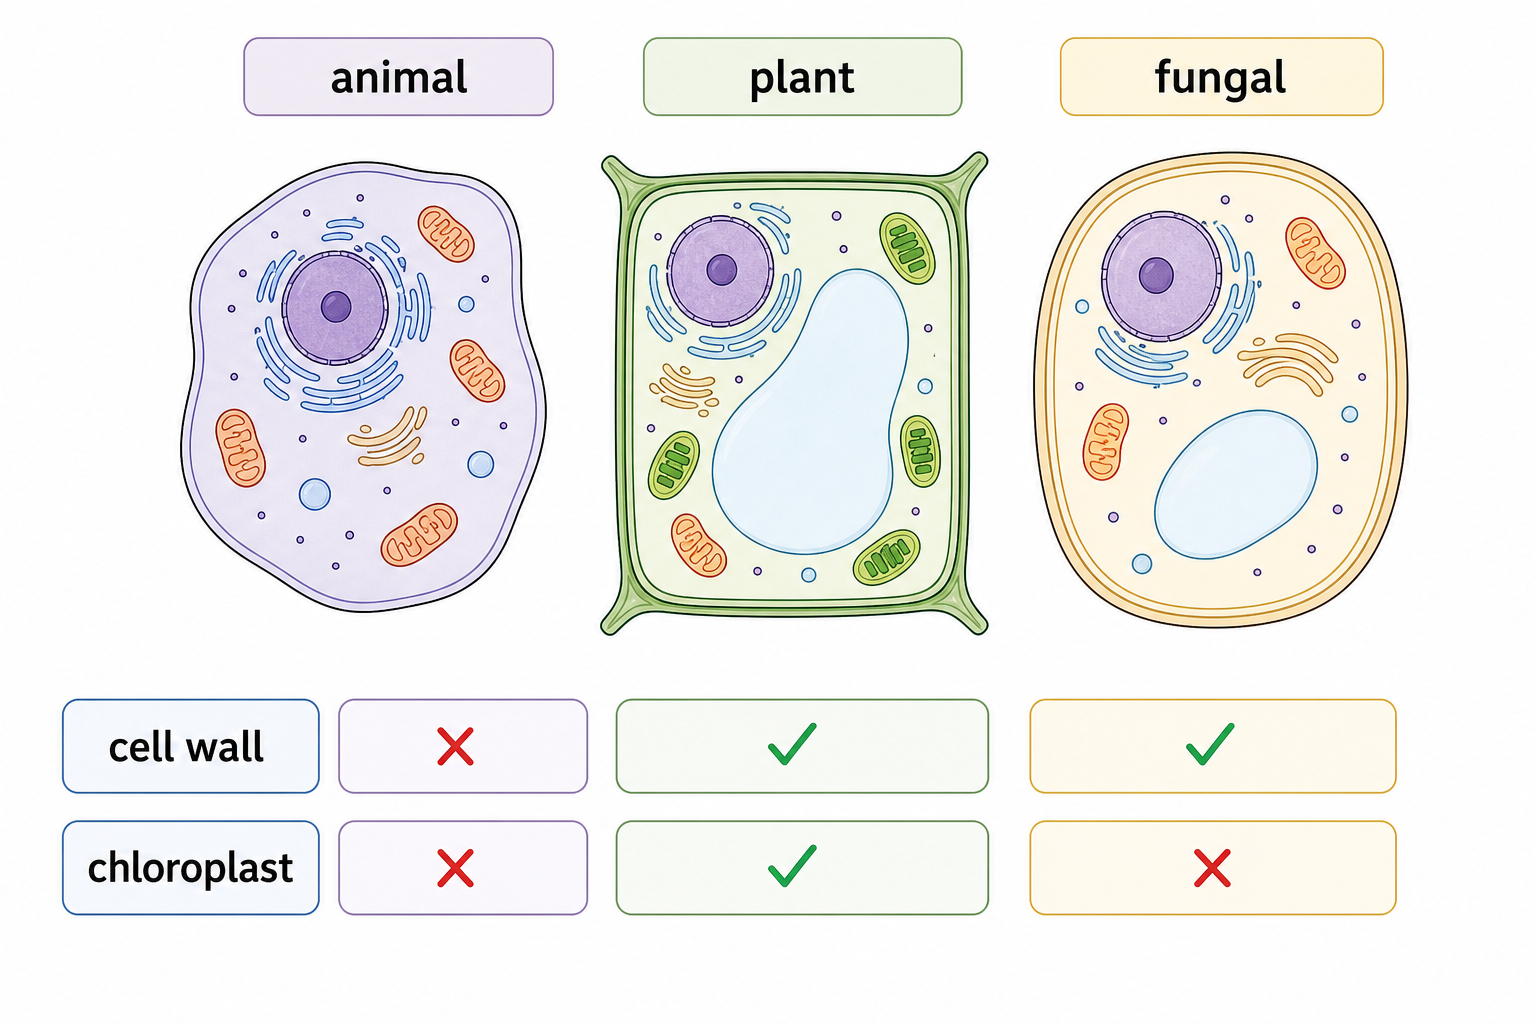
Plant, fungal and animal cells modify a shared eukaryotic plan
Feature
Plant cell
Fungal cell
Animal cell
wall
cellulose
chitin
absent
plastids
chloroplasts in photosynthetic cells
absent
absent
vacuoles
often one large permanent vacuole
vacuoles present
usually small and temporary
carbohydrate store
starch
glycogen
glycogen
frequent additional structures
plasmodesmata
branching hyphae in many species
centrioles; cilia or flagella in some cells
Classification should use a combination of structures. A wall alone does not prove that a cell is plant, and the absence of a chloroplast does not exclude plant tissue because many plant cells are non-photosynthetic.
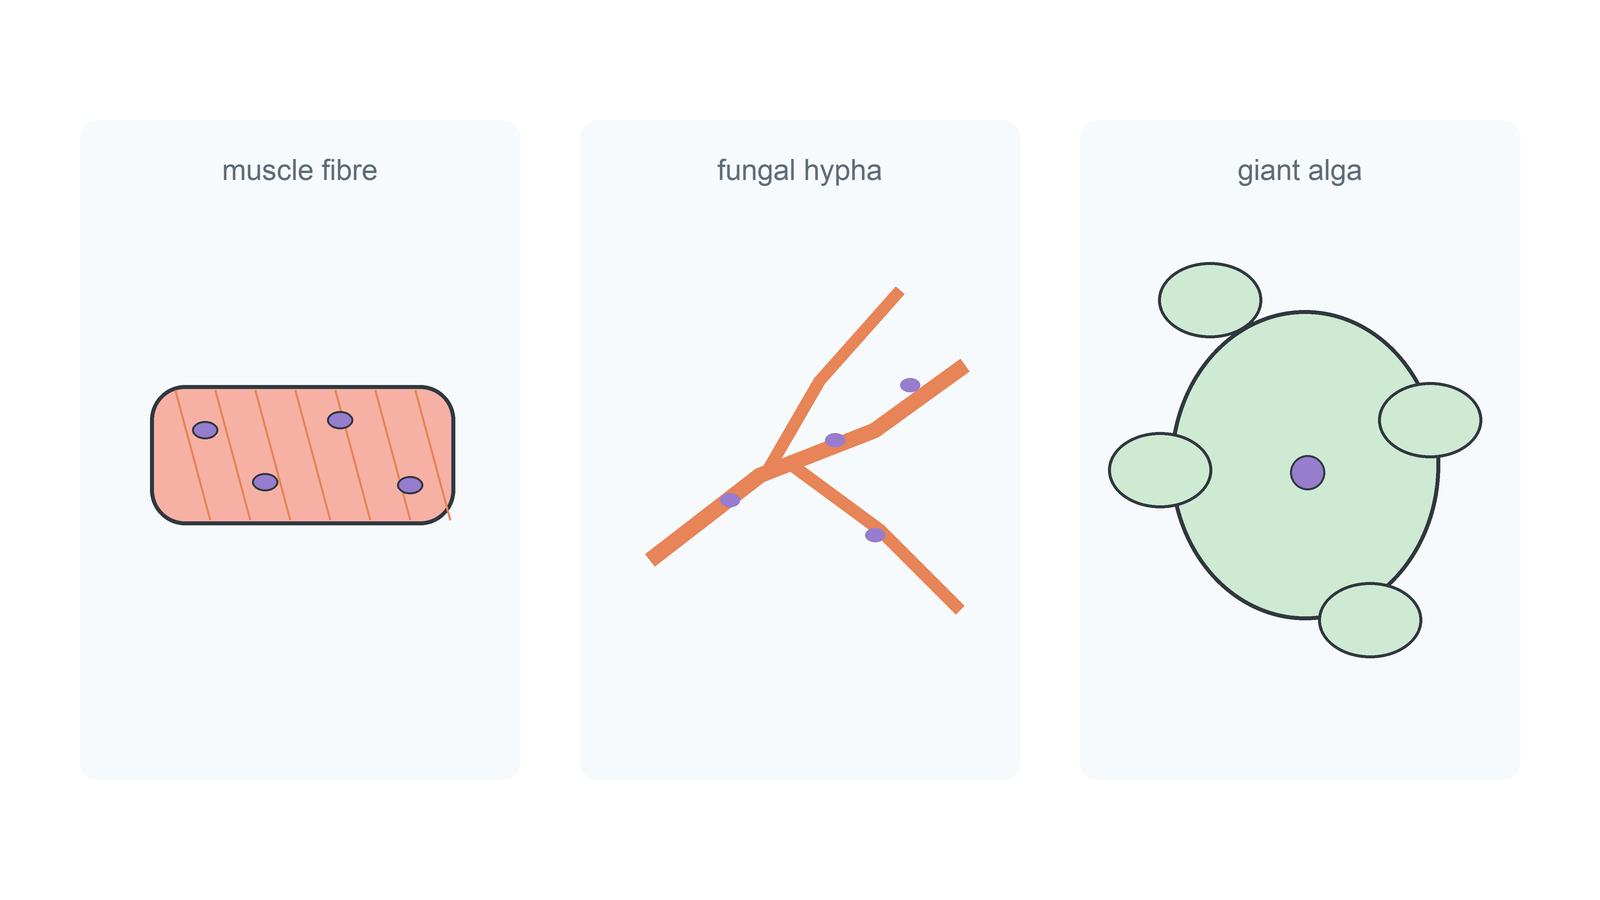
Atypical cells expose where the simple model breaks
Aseptate fungal hyphae have many nuclei in continuous cytoplasm without complete cross-walls.
Striated muscle fibres form by cell fusion and remain long and multinucleate.
Mature red blood cells lose the nucleus and most organelles, gaining space and flexibility for oxygen transport but losing the ability to divide.
Sieve-tube elements lose the nucleus and depend metabolically on adjacent companion cells.
These cases do not show that cell theory is useless. They show that specialization can redistribute cellular functions across shared cytoplasm or cooperating cells, so “one small compartment with one nucleus” is not the theory itself.
Identify a micrograph by converging clues
Build an identification from several clues:
establish the imaging method and scale
locate boundaries and decide whether they are walls or membranes
look for an internal pattern, not just a familiar outline
use tissue context and neighbouring structures
state the observation before naming the structure
Here, several parallel flattened sacs plus small vesicles at their margins support Golgi apparatus. One circular membrane profile would be weak evidence because a section can cut many organelles into circles.
Absence is weaker than presence: a thin section may miss an organelle that exists elsewhere in the cell. Identification should therefore rest on visible positive evidence whenever possible.
Translate a micrograph into an evidence-based drawing
1
Trace the main boundaries and proportions from the micrograph before naming anything.
2
Use a large drawing with single clear continuous lines. Do not shade, colour or invent structures that are not visible.
3
Add ruled, non-crossing label lines that touch the named feature. A label identifies; an annotation adds a justified structure–function statement.
4
Include magnification or a calculated scale bar, with image and actual lengths converted to the same units.
Before adding an annotation, ask whether the feature can be pointed to in the drawing and whether the claimed function follows from that observed structure. Biological knowledge may guide interpretation, but it must not fabricate visual evidence.
SL synthesis: build a cell claim from evidence
Question
Evidence to use
Claim it can support
Is this a cell?
membrane-bounded cytoplasm with genetic material and ribosomes
an integrated cellular unit
How large is it?
calibrated graticule, scale bar or magnification with consistent units
an actual dimension
What kind of cell is it?
scale, nucleus or nucleoid, organelles, wall material and context
prokaryotic or a eukaryotic lineage
What does a structure do?
visible geometry connected to a known mechanism
a defensible structure–function inference
A strong conclusion keeps observation → interpretation → limitation in that order. One clue may suggest an identity; several independent clues make it defensible.
Endosymbiosis turns engulfment into lasting cooperation
HL only
1
An ancestral host with internal membranes enclosed its genetic material, establishing a nucleus-bearing cellular lineage.
2
The host engulfed an aerobic bacterium but did not digest it. The partner supplied efficient aerobic ATP production and became the ancestor of mitochondria.
3
Natural selection favoured tighter integration: many endosymbiont genes moved to the host genome, while the organelle retained only a small genome and could no longer live independently.
4
In the lineage leading to algae and plants, a later engulfed photosynthetic cyanobacterium became the ancestor of chloroplasts.
The engulfing host was not already a modern eukaryotic cell. Endosymbiosis is part of the explanation for how eukaryotic complexity arose.
Independent evidence retains the bacterial history of organelles
HL only
Observation in mitochondria or chloroplasts
Why it supports bacterial ancestry
circular, largely naked DNA
resembles a bacterial chromosome
70S ribosomes
matches bacterial rather than cytosolic eukaryotic ribosomes
division from pre-existing organelles
resembles binary fission
bacterial size and double membranes
fits an engulfed cell retained inside a host-derived membrane
chloroplast genes group with cyanobacteria
predicts a photosynthetic bacterial ancestor
mitochondrial genes group with alphaproteobacteria, including Rickettsiales
predicts an aerobic bacterial ancestor
No single observation proves the full history. The theory is strong because structural, biochemical and sequence evidence converge on the same ancestry and make successful predictions about organelle genomes.
The evidence strongly supports bacterial origins of mitochondria and chloroplasts; it does not imply that every eukaryotic organelle arose by endosymbiosis.
Most cells in a multicellular organism descend from one original cell and therefore contain essentially the same genome. They differ because developmental signals and position cause different genes to be expressed or suppressed.
different gene expression → different RNAs and proteins → different proteomes → different structures and reactions → specialized cell functions
A muscle fibre produces abundant contractile proteins and organizes them into myofibrils. A protein-secreting cell develops extensive rough ER and Golgi apparatus. Their specialization reflects different use of shared genetic information, not a different complete genome.
Division of labour increases efficiency but also dependence: a highly specialized cell often cannot perform every process needed for independent life.
Multicellularity evolves when cooperation becomes heritable
HL only
Multicellularity evolved independently in animals, plants, fungi and several algal lineages. Its repeated origin shows that there is no single compulsory route, but stable multicellular organisms must solve a common set of coordination problems.
Requirement
What it makes possible
cell adhesion
descendants remain together as a persistent group
cell communication
cells coordinate behaviour and respond to group conditions
controlled differentiation
complementary cell types divide labour
conflict control
individual cell proliferation remains aligned with organism survival and reproduction
Larger size can reduce predation and broaden resource use; specialization can make tissues more efficient. These gains are selected only when they outweigh the energy cost of coordination and the loss of cellular independence.
HL synthesis: integration increases capability and dependence
HL only
Level of integration
Earlier independent unit
New capability
New dependence
endosymbiosis
bacterium
efficient respiration or photosynthesis inside a host
organelle relies on host genes and cell environment
differentiation
unspecialized cell
a cell type optimized for one role
specialized cell relies on other cell types
multicellularity
reproducing single cell
tissues, larger bodies and division of labour
cells rely on organism-level coordination
Across all three transitions, natural selection preserves cooperation when the integrated system performs better than its parts could independently. Greater biological complexity is therefore accompanied by greater interdependence.
Cells as basic structural unit
[ 2 ]
Outline the cell theory.
Microscopy skills
[ 3 ]
Outline the procedure for focusing a light microscope.
Developments in microscopy
[ 1 ]
What is a feature of immunofluorescence in light microscopy?
Structures common to all cells
[ 2 ]
List two structures that neurons have in common with prokaryotic cells.
Prokaryote cell structure
[ 9 ]
Escherichia coli is a unicellular organism, so each cell must carry out all of the processes required for life. Outline the functions of each of the structures in the cells of Escherichia coli.
Drawing canvas
Eukaryote cell structure
[ 2 ]
Label structures I, II, III and IV. I. II. III. IV.
Drawing canvas
Processes of life in unicellular organisms
[ 4 ]
Unicellular and multicellular organisms share the same functions of life. Outline four functions of life.
Differences in eukaryotic cells
[ 3 ]
Distinguish between structures in animal and plant cells.
Atypical cell structure
[ 7 ]
Discuss the cell theory and its limitations.
Cell identification in micrographs
[ 3 ]
Identify organelles I to III.
I: II: III:
Drawing and annotation
[ 3 ]
Draw a labelled diagram of a nucleus from a eukaryotic cell, such as an onion epidermis cell, as seen using an electron microscope.
Drawing canvas
Endosymbiosis origin of eukaryotes
HL only
[ 6 ]
Explain the endosymbiotic theory for the origin of eukaryotes and the evidence for it.
Cell differentiation
HL only
[ 4 ]
Outline the reasons for differences between the proteomes of cells within a multicellular organism.
A2.3 Viruses [HL only]
Viruses are structurally diverse, acellular parasites whose host-dependent replication cycles, multiple evolutionary origins, and rapid genetic change shape infection and immune escape.
Syllabus
First assessment 2025
Topic
A2.3
Level
HL
A virus is a particle that borrows a cell's machinery
HL only
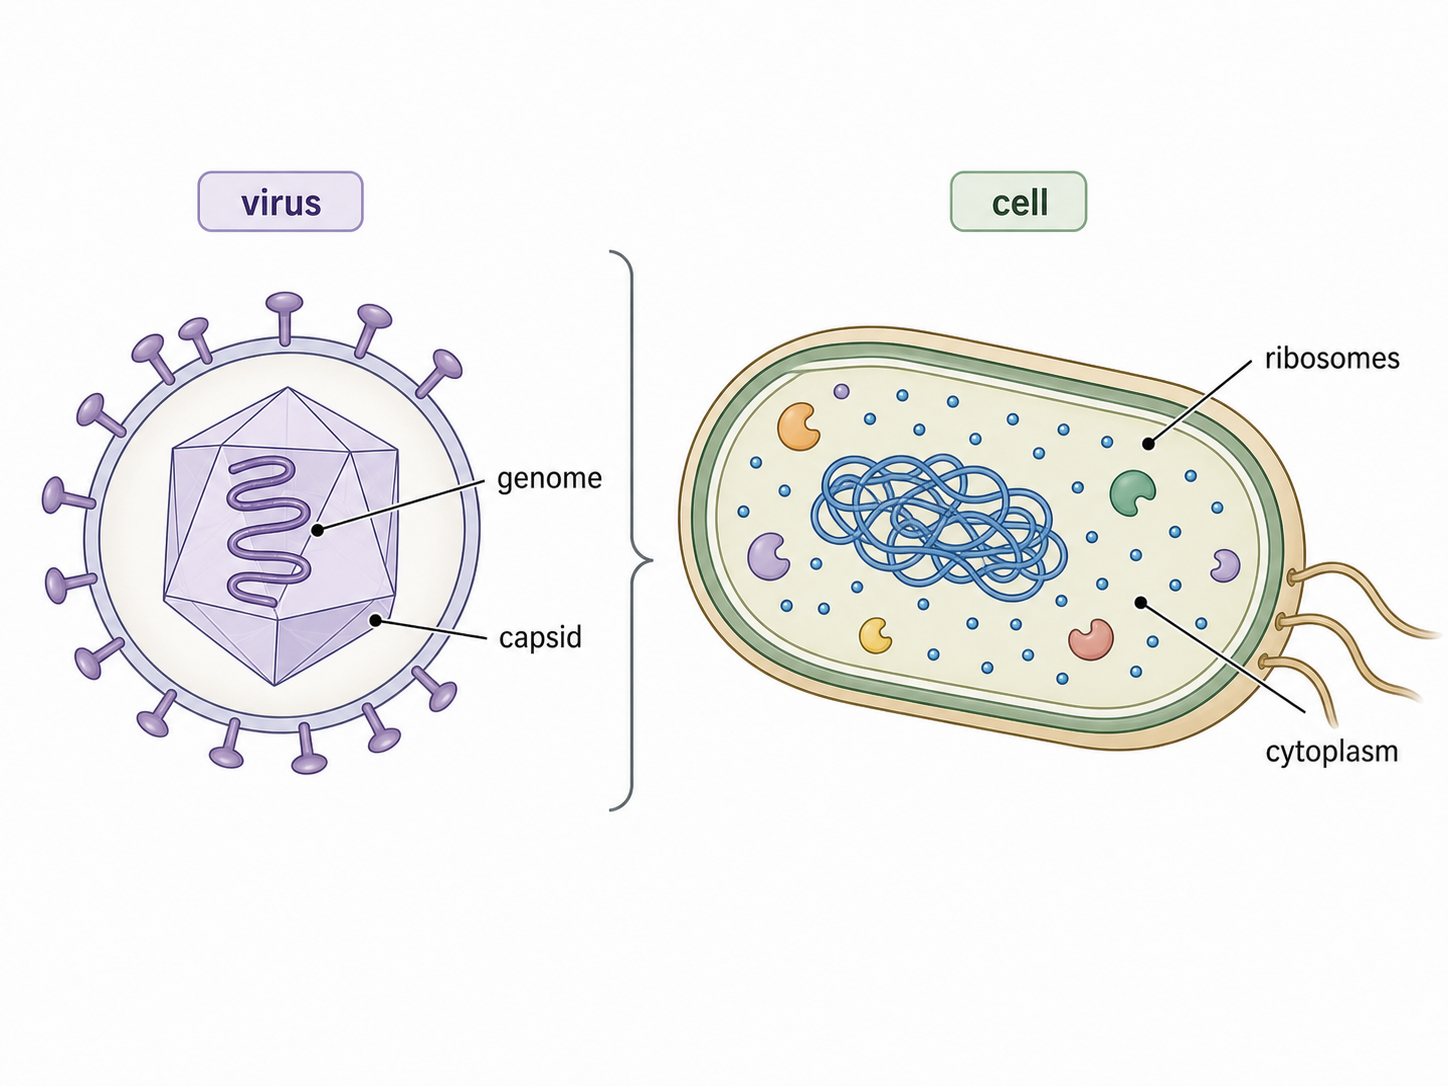
A virion is an infectious, non-cellular particle outside a host cell. Every virus contains a DNA or RNA genome protected by a protein capsid, but it is not a small cell.
Viruses lack the systems needed for independent life:
no cytoplasm in which to maintain metabolism
no ribosomes for protein synthesis
few or no metabolic enzymes
no independent supply of energy or raw materials
A virus is therefore an obligate intracellular parasite: its genome can be copied and expressed only after it enters a compatible host and redirects the host's enzymes, ribosomes, energy and materials. Outside a host, the virion does not grow, metabolize or reproduce.
Virus structure varies along independent axes
HL only
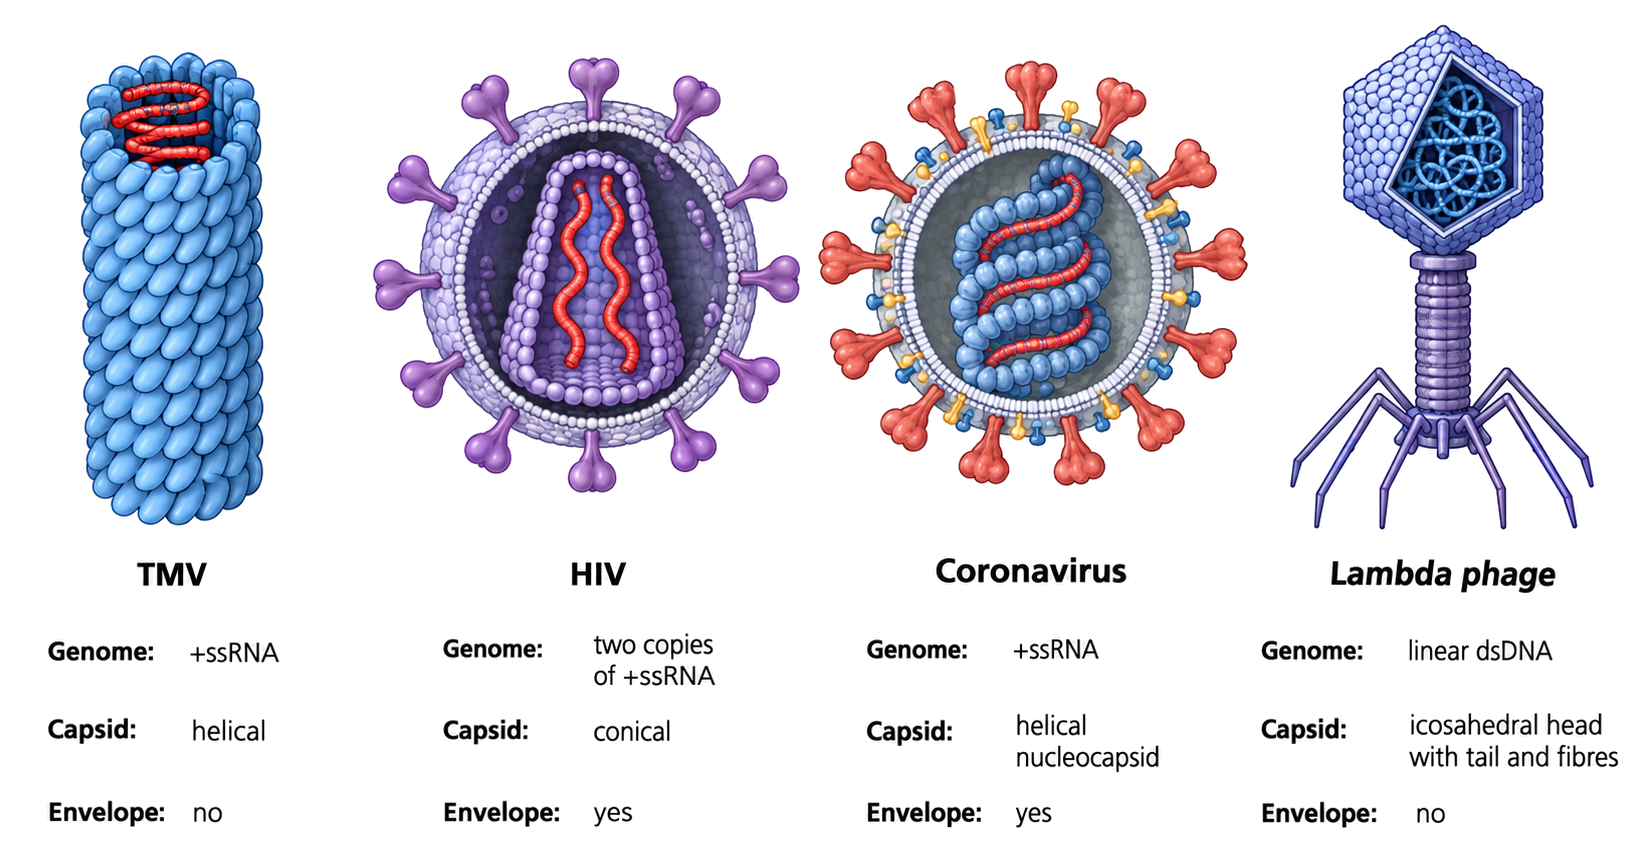
A virus cannot be classified from one feature alone. Its design combines three independent axes: genome form, capsid geometry and envelope status.
Tobacco mosaic virus: single-stranded RNA, helical capsid, no envelope
HIV: two copies of single-stranded RNA, conical capsid, envelope present
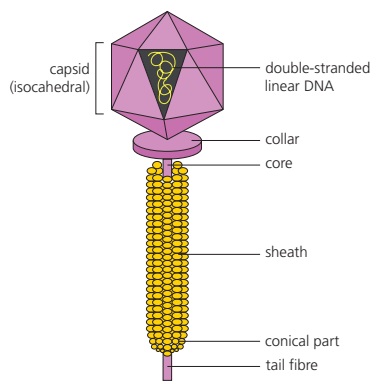
Lambda phage: linear double-stranded DNA, icosahedral head with a complex tail, no envelope
Genome may be DNA or RNA, single- or double-stranded, linear, circular or segmented. Capsids may be helical, polyhedral, conical or complex. An envelope is an additional lipid membrane, not a replacement for the capsid.
Capsid, envelope and glycoproteins solve different problems
HL only
The capsid is assembled from protein subunits and protects the genome. Its geometry also packages the genome efficiently, but a capsid cannot synthesize proteins or supply energy.
In an enveloped virus, host-derived phospholipids surround the capsid. Viral genes encode the surface glycoproteins embedded in that membrane; their shape determines which host-cell receptors the virion can bind.
Receptor binding creates host and tissue specificity and initiates entry. The envelope can aid membrane fusion, but non-enveloped viruses use other entry mechanisms, so an envelope is useful rather than universal.
Lambda phage begins by recognizing and injecting
HL only
Lambda phage infects E. coli because its tail fibres bind specific receptors on the bacterial surface. This molecular match explains why a phage does not infect every bacterial species.
After attachment, the phage injects its linear double-stranded DNA through the cell envelope. The protein capsid remains outside; it is the viral genome inside the bacterium that determines the next route.
If the DNA remains separate and is expressed immediately, infection enters the lytic route. If it integrates into the bacterial chromosome, it begins the lysogenic route.
The lytic route converts one infection into released phages
HL only
1
The tail fibres attach to E. coli, and lambda DNA enters while the capsid remains outside.
2
The viral DNA remains separate from the bacterial chromosome. Host DNA is degraded, freeing nucleotides, while viral genes redirect host enzymes, ribosomes, energy and materials.
3
Lambda DNA is replicated, and viral mRNAs are translated into capsid, tail and lysis proteins.
4
Genome molecules and protein parts self-assemble into complete virions. Assembly must follow synthesis because individual parts are not infectious phages.
5
Viral enzymes weaken the bacterial wall; the cell lyses, dies and releases many phages that can infect neighbouring bacteria.
The lysogenic route copies viral DNA without making virions
HL only
1
After injection, lambda DNA can integrate into the E. coli chromosome. The integrated viral genome is a prophage; the bacterium carrying it is a lysogen.
2
The prophage is copied whenever the host chromosome replicates and is passed to daughter cells during binary fission. No new virions are assembled, so the host is not lysed during this phase.
3
Stress such as DNA damage can trigger induction: the prophage excises from the chromosome, viral genes are expressed, and infection switches into the lytic route.
Genome state separates lytic production from lysogenic inheritance
HL only
Question
Lytic route
Lysogenic route
Where is lambda DNA?
separate from the host chromosome
integrated as a prophage
What is copied?
viral DNA for immediate phage production
host chromosome and prophage together
Are virions made now?
yes
no
What happens to the host?
cell lyses and dies
cell survives and passes the prophage to daughters
What can change the route?
completes with lysis
stress can induce excision and entry into the lytic route
The decisive distinction is not whether viral DNA entered the cell—it does in both routes. The distinction is the state of that DNA after entry, which determines immediate virion production or inherited latency.
Lambda is a temperate phage because the same virus can use either route. Lysogeny postpones virion production; it does not remove the possibility of later lysis.
Viral diversity argues against one universal viral ancestor
HL only
Cellular life shares deeply conserved machinery and genes, supporting common ancestry. Viruses show a different pattern: no gene is shared by every viral group, and their genomes, replication strategies and particle structures are exceptionally diverse.
This pattern supports polyphyly—different viral groups probably arose independently, at different times and by more than one route. It does not identify a separate origin for every virus; it rejects the assumption that one known ancestor explains them all.
All viruses nevertheless share extreme host dependence. That similarity may be convergent evolution: unrelated replicating systems exposed to the same selective problem independently evolved compact transmissible particles that exploit cells.
Three hypotheses describe different routes to viral dependence
HL only
Virus-first: self-replicating molecules existed before or alongside early cells and later became dependent parasites.
Escaped genes (progressive): mobile genetic elements left cells and gained structures for transmission between hosts.
Regressive (reduction): cellular parasites lost genes and cellular structures as host dependence increased.
These are hypotheses, not three stages of one history. Escaped-gene models may fit some small mobile-element-derived viruses, while reduction may fit some large DNA viruses. More than one hypothesis can therefore be correct for different viral lineages.
Rapid viral evolution requires variation and selection
HL only
Mutation creates new alleles during genome replication; recombination or segment reassortment can create new combinations. These processes generate heritable variation before selection acts.
Viruses can evolve rapidly because:
replication enzymes—especially many RNA-dependent polymerases and HIV reverse transcriptase—make frequent uncorrected errors
short generation times expose variants to selection quickly
enormous populations generate many mutations in every infection
repeated transmission exposes variants to changing hosts, immunity and treatments
Selection does not create a needed mutation. A variant already present increases in frequency when it leaves more descendants—for example by replicating faster, transmitting more effectively, evading immunity or surviving an antiviral drug.
High mutation rate alone is not evolution. Population evolution is the change in variant frequencies across generations after mutation, inheritance and differential reproductive success interact.
Antigenic drift and shift change influenza at different scales
HL only
Process
Source of change
Typical result
antigenic drift
accumulated point mutations during replication
gradual alteration of HA or NA antigens within a lineage
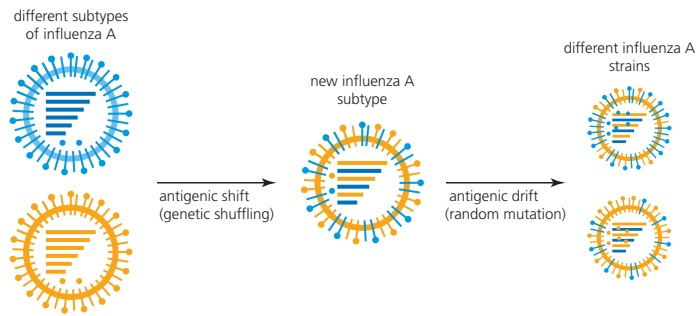
antigenic shift
reassortment when different influenza A viruses infect the same cell
abrupt new combination of genome segments and potentially a new subtype
Antibodies bind particular antigen shapes. Drift can gradually reduce recognition and helps explain repeated vaccine updates. Shift can expose a population to a much less familiar antigen combination, so its epidemiological effect may be larger and more sudden.
Shift depends on a segmented genome and co-infection of one host cell; it is not simply a larger point mutation. Drift and shift both generate variation, after which transmission and immunity determine which variants spread.
HIV evolution undermines single-drug treatment
HL only
HIV carries RNA and reverse transcriptase, which copies viral RNA into DNA before that DNA integrates into the host genome. Reverse transcriptase lacks effective proofreading, so copying creates frequent mutations.
Within one person, rapid replication and a large viral population produce many related HIV variants. Most mutations are neutral or harmful, but some alter a protein targeted by an antiviral drug.
A single drug creates strong selection: susceptible variants are suppressed while a resistant variant continues reproducing and becomes more common. The drug selects resistance from existing variation; it does not direct HIV to make the useful mutation.
Combination therapy attacks different viral targets at once. A virion would need several compatible resistance changes to reproduce successfully, greatly reducing the probability that an already resistant variant survives treatment.
Virus synthesis: dependence connects structure, replication and evolution
HL only
Question
Evidence or state to identify
Defensible conclusion
Why must this virus use a host?
genome and capsid but no cytoplasm, ribosomes or independent metabolism
it must redirect compatible cellular machinery
Which lambda route is operating?
viral DNA separate or integrated; virions present or absent
immediate lytic production or lysogenic inheritance
Did all viruses share one origin?
no gene shared by all groups and extreme structural/genomic diversity
several origins are more likely than one universal viral ancestor
Why is a viral population changing?
heritable variants plus different reproductive success
mutation or reassortment supplied variation; selection changed frequencies
The same dependence runs through the chapter: compact viral genomes succeed by using cells. That dependence shapes particle structure and replication, may have evolved by several routes, and creates intense selection whenever host immunity or treatment changes the cellular environment.
Common structural features
HL only
[ 1 ]
Describe one reason that viruses are not considered to be living.
Diversity of virus structure
HL only
[ 7 ]
Describe, with examples, the diversity of structure in viruses.
Lytic cycle
HL only
[ 1 ]
What is a difference between the lytic and the lysogenic cycle of the bacteriophage lambda?
Lysogenic cycle
HL only
[ 3 ]
Explain how the bacteriophage lambda reproduces in the lysogenic cycle.
Rapid evolution in viruses
HL only
[ 2 ]
Outline two reasons for the very rapid rates of evolution in some viruses.
A3.1 Diversity of organisms
Diversity of organisms links variation, species concepts, classification tools, chromosome evidence, and genome comparisons to explain biological similarity and difference.
Syllabus
First assessment 2025
Topic
A3.1
Level
HL
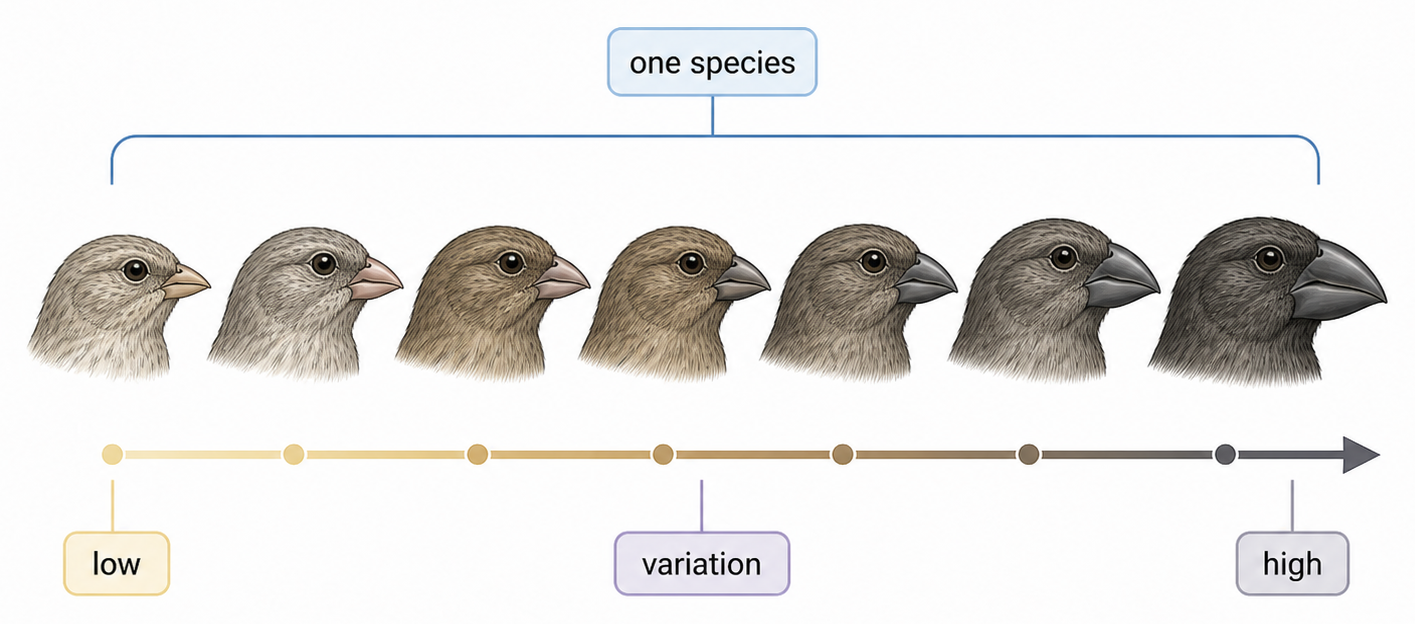
Variation is the pattern that selection can act on
Pattern
What the data look like
Common biological basis
Continuous variation
A measured range with intermediate values
Often many genes plus environmental effects
Discontinuous variation
Distinct categories with no intermediates
Often one or a few genes with large effects
Variation occurs among individuals in every species. Darwin recognized that, when some inherited variants affect survival or reproduction, their frequencies can change across generations by natural selection.
Morphology is useful evidence, not an automatic verdict
The morphological species concept groups organisms by a shared set of diagnostic structures. It is fast in fieldwork and can be applied to fossils, plants and asexual organisms when breeding evidence is unavailable.
Appearance varies within species. Sexual dimorphism can make males and females look unlike, while unrelated species can converge on similar forms. A boundary should therefore use several traits and, where possible, independent evidence.
A binomial gives every species one universal name
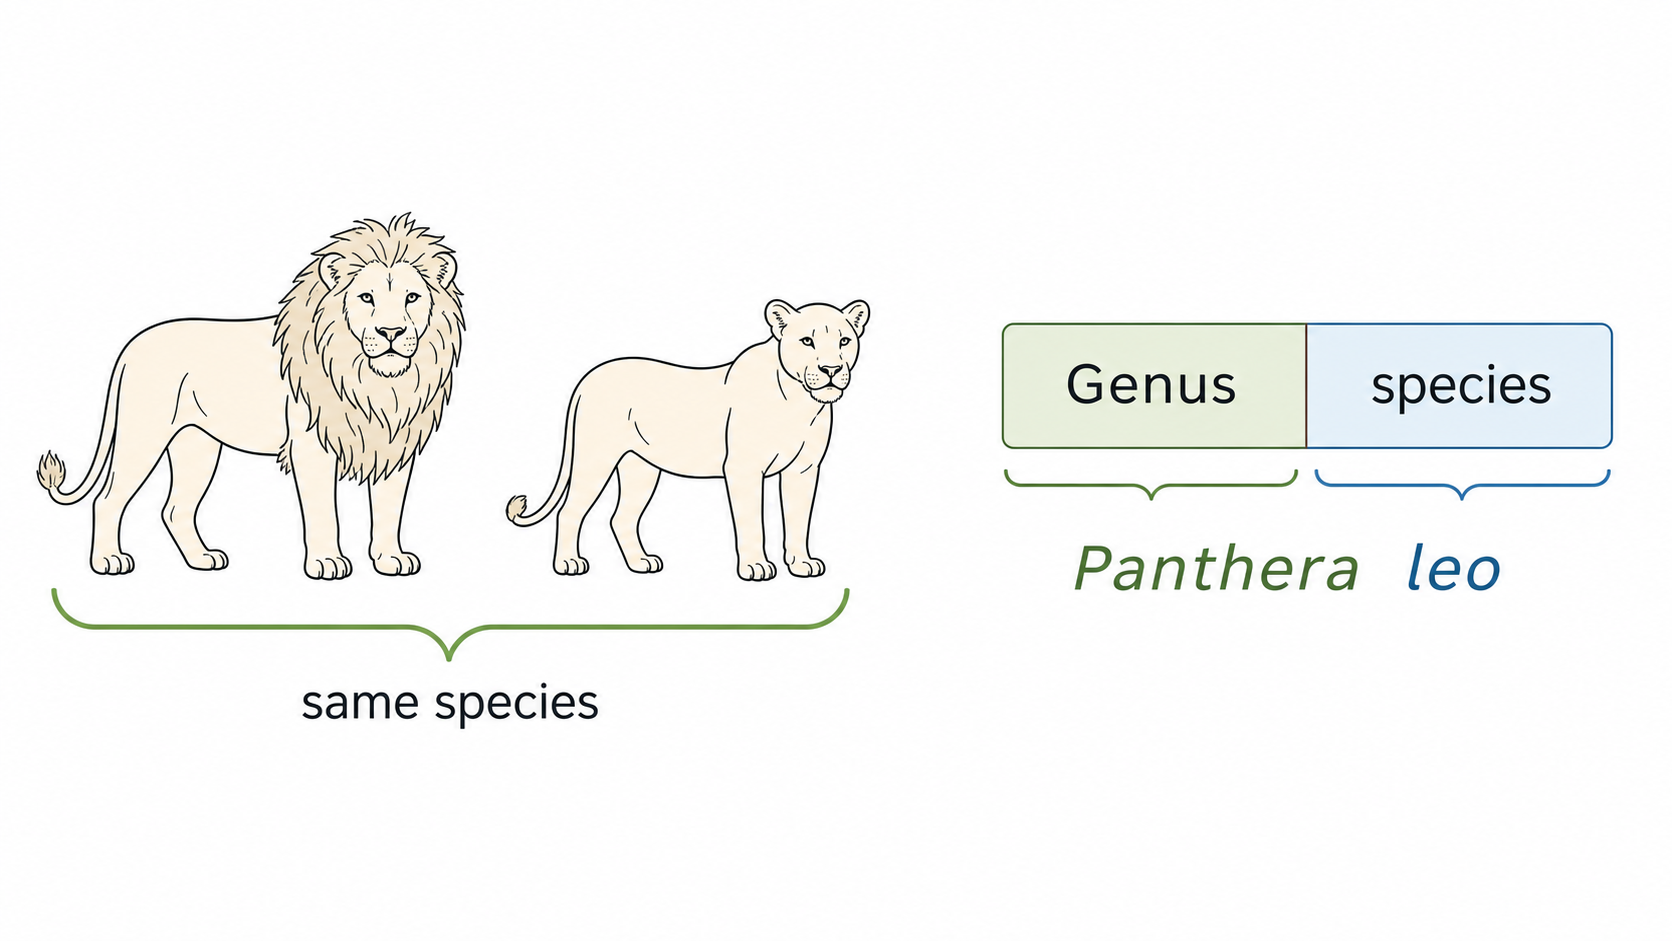
A scientific species name has two parts: the genus followed by the specific epithet. In Panthera leo, Panthera names the genus and leo distinguishes the species within that genus.
Capitalize the genus; write the specific epithet in lowercase.
Italicize both words when typed; underline each word separately when handwritten.
After the first full use, the genus may be abbreviated: P. leo.
The shared genus indicates a group of similar, closely related species. The binomial prevents ambiguity between local common names, but the name records a classification—it is not itself evidence that the species boundary is correct.
Gene flow defines the biological species concept
Under the biological species concept, members of one species can interbreed and produce viable, fertile offspring. Successful reproduction lets alleles move through a shared gene pool.
Question
What failure would show
Can mating and fertilization occur?
A pre-zygotic reproductive barrier
Does the hybrid survive?
Reduced hybrid viability
Can the hybrid produce functional gametes?
Hybrid sterility
This concept cannot be tested directly for fossils, and it does not fit organisms that reproduce only asexually. Distinct forms may also retain limited gene flow, so interbreeding evidence must be interpreted with ecology and evolutionary history.
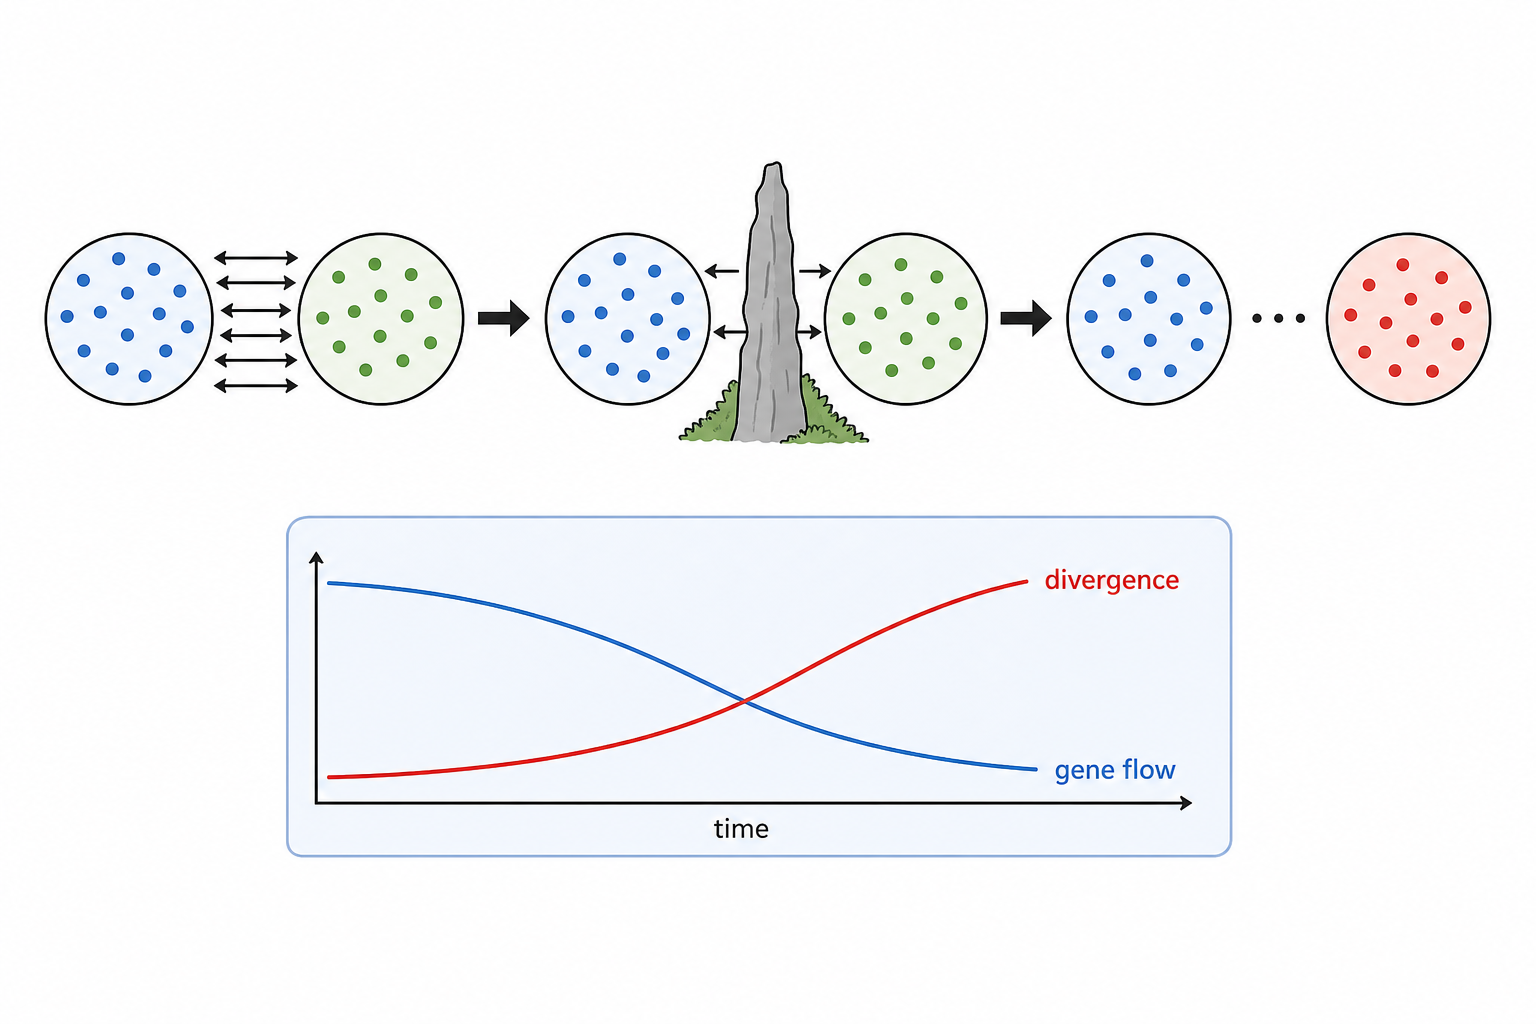
A gradual process creates a fuzzy species boundary
1
Populations begin within one species and exchange genes, so their members remain genetically connected.
2
A geographic or ecological barrier reduces gene flow. Mutation, selection and genetic drift can then change the populations independently.
3
Differences accumulate gradually; there is no single moment at which every trait changes from ‘same species’ to ‘different species’.
4
Separated populations may still be theoretically capable of interbreeding even though they never meet. Scientists therefore infer a boundary from converging reproductive, morphological, ecological and genetic evidence.
Chromosome number is characteristic, not a complexity scale
Species
Diploid chromosome number
Fruit fly
8
Rice
24
Human
46
Chimpanzee
48
Dog
78
In a typical diploid cell, chromosomes occur as homologous pairs—one member of each pair inherited from each parent—so the diploid number is usually even and normally constant within a species.
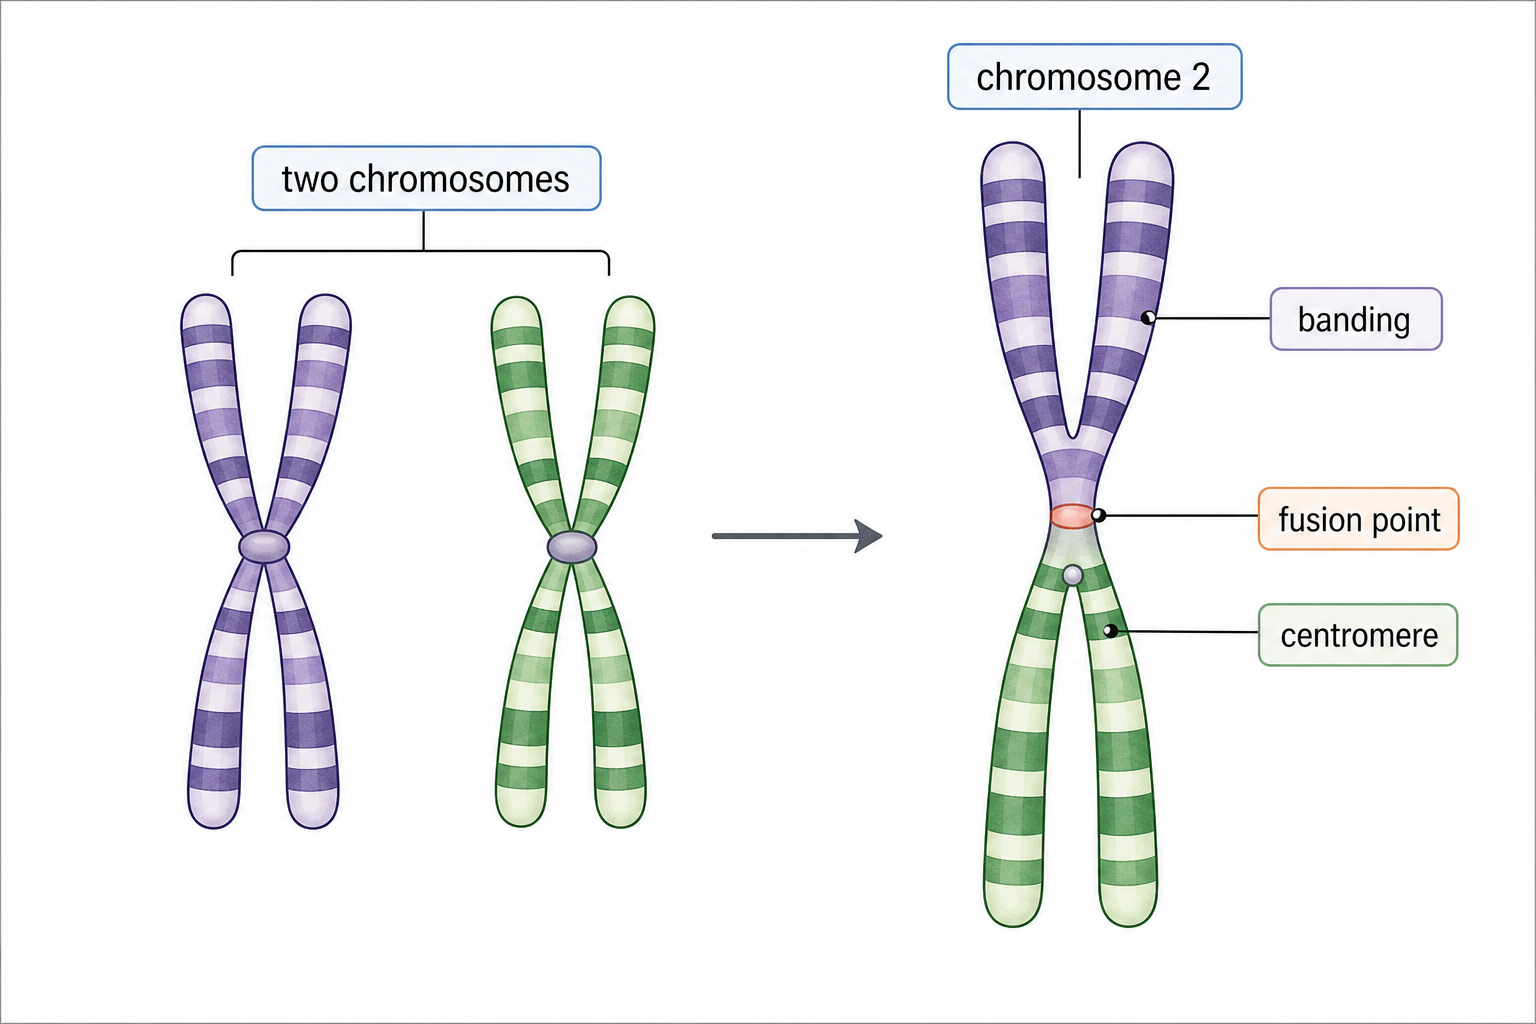
Chromosome number varies widely between species but does not rank organism size or complexity. Closely related species can differ by a chromosome fusion or split while retaining many homologous genes.
A karyogram turns chromosome structure into evidence
A karyotype is the chromosome number and structural features of a cell. A karyogram is an arranged image in which homologous chromosomes are paired using length, banding pattern and centromere position.
Three independent matches support ancestral fusion: human chromosome 2 follows the combined band order of chimpanzee 2A and 2B, contains telomere-like sequence internally, and retains a vestigial second centromere. Together these are stronger than chromosome count alone.
One species combines genomic unity with variant sites
A genome is all genetic information in an organism: nuclear DNA plus mitochondrial DNA and, in plants, chloroplast DNA. Messenger RNA and transfer RNA are products of genes, not additional parts of the genome.
Scale
Pattern
Meaning
Most sites within one species
The same base sequence is shared
Common ancestry and shared biological organization
Variant sites
Alleles differ among individuals
Heritable diversity within the species
Single-nucleotide polymorphism (SNP)
One base differs at a particular position
A marker that can be tracked through populations or families
Most SNPs are in non-coding DNA and have no known phenotypic effect. Some lie in genes or regulatory regions and can affect function, drug response or disease risk; association alone does not prove causation.
Genome size and genome sequence answer different questions
Measure
What it records
What it does not tell you alone
Base sequence
The order of nucleotides
Whether every difference changes phenotype
Genome size
DNA in one haploid chromosome set
Gene number or organism complexity
Eukaryote genomes vary in both sequence and total DNA. Sequence variation between species is much larger than variation within one species, while repeated and other non-coding DNA can contribute greatly to genome size.
Whole-genome duplication produces polyploid organisms with several chromosome sets. This can greatly enlarge plant genomes without making the organism proportionally more complex, so a genome-size comparison is not a complexity ranking.
Sequencing produces a dataset; validation produces a conclusion
Whole-genome sequencing determines the order of bases across an organism’s complete DNA. The Human Genome Project established large-scale reference sequencing and accelerated bioinformatics for storing, comparing and interpreting sequence data.
Current and developing uses include:
comparing evolutionary relationships
locating genes and variants associated with disease
identifying and tracking pathogens
finding possible diagnostic, treatment or vaccine targets
guiding prevention or treatment using an individual’s genetic profile
A sequence match or statistical association generates a hypothesis. Clinical effect, causation and safety require independent evidence; sequencing alone does not diagnose every disease or guarantee that a proposed target will work.
Summary: match the species question to the evidence
Question
Useful evidence
Main limit
How do individuals vary?
Trait distributions, genes and environment
A pattern does not identify its cause by itself
Where is a species boundary?
Morphology, gene flow and fertile offspring
Speciation is gradual and some cases cannot be crossed or observed
What changed in chromosome history?
Number, banding, centromeres and sequence landmarks
One similarity alone is weak evidence
How do genomes differ?
Sequence variants and genome size measured at the right scale
More DNA does not mean greater complexity
Start with the biological question, choose evidence at the organism, reproductive, chromosome or sequence scale, then state what that evidence cannot decide alone.
Horizontal gene transfer blurs bacterial species boundaries
HL only
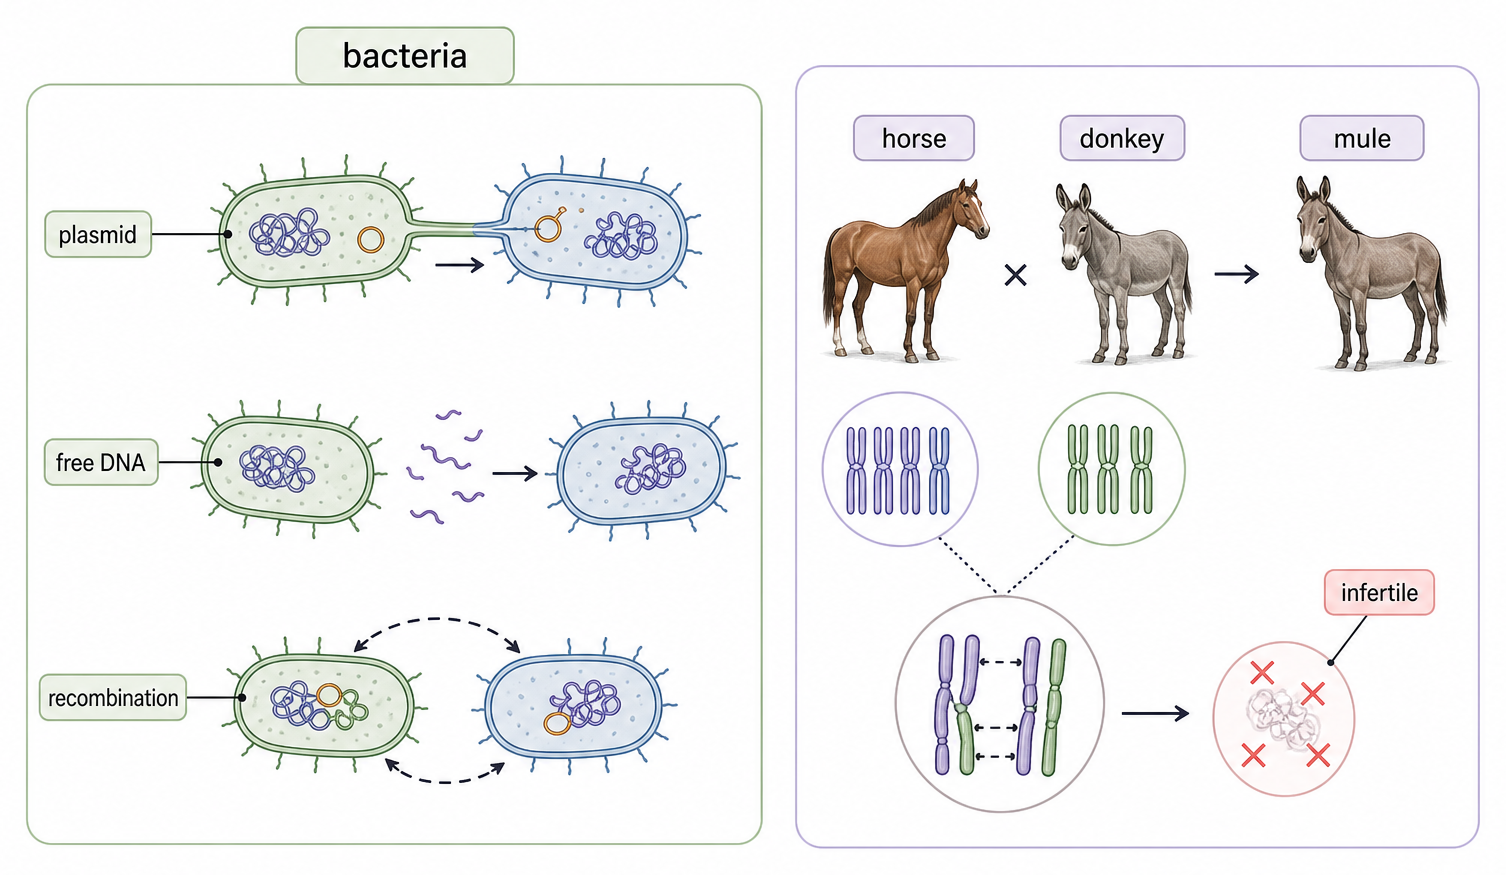
Bacteria reproduce asexually, so ‘interbreed and produce fertile offspring’ cannot define their species. Mutation creates new variants within lineages, while horizontal gene transfer moves DNA between cells and sometimes across established taxonomic boundaries.
Route
How DNA moves
Transformation
A cell takes up free DNA or a plasmid from its surroundings; homologous DNA may recombine with the chromosome
Transduction
A bacteriophage accidentally carries bacterial DNA to another cell
Conjugation
Direct contact transfers a copied DNA strand, often from a plasmid, from donor to recipient
Because ancestry is partly tree-like and partly network-like, no mating test encloses a single bacterial gene pool. Bacterial groups are therefore distinguished using combinations of genome sequence, evolutionary history, physiology and ecology.
Meiosis separates homologous pairs to produce haploid gametes; fertilization combines two haploid sets and restores the characteristic diploid number. This cycle prevents chromosome number doubling in every generation.
Horse gametes carry 32 chromosomes and donkey gametes carry 31, so their mule offspring has 63. During mule meiosis, many chromosomes lack a matching homologue and cannot segregate into balanced gametes; different parental chromosome numbers can therefore cause hybrid sterility.
Build a dichotomous key from observable contrasts
HL only
1
List stable, observable features for representative specimens in a character matrix—for leaves, examples include divided versus entire, margin toothed versus smooth, and leaflet arrangement.
2
Choose a feature that divides the remaining specimens into two clear groups. Write the alternatives as a matched pair using the same feature.
3
Repeat the split within each group until every route ends at one identification. Use positive, unambiguous wording that a field observer can apply.
4
Run every known specimen through the finished key, then test additional individuals. Revise any couplet that gives two possible routes, depends on a variable trait or fails to identify a member of the intended set.
A usable key pairs every choice on one feature
HL only
Couplet
Alternative A
Alternative B
1
Leaf divided into leaflets → go to 2
Leaf blade entire → go to 3
2
Leaflets radiate from one point → horse chestnut
Leaflets arranged in two rows → pignut hickory
3
Blade margin toothed → sweet chestnut
Blade margin smooth → southern catalpa
Each row asks about one observable contrast, and every answer either gives an identification or points to exactly one next couplet. The key identifies only organisms represented when it was designed; it does not prove that the resulting names are evolutionarily closest.
A key can fail when the specimen is outside its scope, damaged or at a different life stage; when a trait varies with sex or environment; or when terminology and hidden physiological features cannot be judged reliably in the field.
Environmental DNA turns molecular traces into candidate species
HL only
1
Collect water, soil or another habitat sample containing DNA shed in cells, mucus, faeces or tissue fragments; include controls so contamination can be detected.
2
Extract the mixed environmental DNA and use PCR primers to amplify a short barcode region chosen to vary more between species than within a species.
3
Sequence the amplified DNA and compare each barcode with a reference database. A close match identifies a candidate source species and allows many taxa in one habitat to be surveyed rapidly.
A detection shows that matching DNA was present in the sample. It does not by itself prove population size, current survival or ecological importance; missing reference sequences, degradation and contamination can also change the result.
Summary: species evidence works at several biological scales
HL only
Case
Best starting evidence
Why one rule is insufficient
Sexual populations
Gene flow and fertile offspring
Divergence is gradual and separated populations may never meet
Bacteria
Genome, physiology, ecology and ancestry
Asexual reproduction and horizontal transfer defeat a mating test
Closely related hybridizing species
Chromosome pairing plus reproductive evidence
Similar appearance does not guarantee balanced meiosis
A dichotomous key identifies a specimen from observable alternatives. DNA barcoding identifies a sequence against reference data, and eDNA extends that comparison to traces collected from a habitat. Both depend on the quality and scope of their reference set.
Species are hypotheses about biological groupings supported by converging evidence. Keep identification, classification and evolutionary relationship as separate claims, even when the same specimen or sequence contributes to all three.
Variation as defining feature of life
[ 2 ]
State, giving a reason, the type of variation shown by shell length.
Species as groups with shared traits
[ 2 ]
List two anatomical features of humans that are characteristic of primates. 1. 2.
Binomial system
[ 4 ]
Outline the binomial system of classification.
Biological species concept
[ 3 ]
Outline the criteria that should be used to assess whether a group of organisms is a species.
Difficulties in distinguishing species
[ 1 ]
State with a reason whether the genetic evidence shows that the western coyote and the grey wolf have overlapping ranges.
Diversity in chromosome numbers
[ 1 ]
State the chromosome number in this gorilla.
Karyotyping and karyograms
[ 8 ]
Explain the use of karyotyping in human genetics.
Drawing canvas
Unity and diversity of genomes within
[ 7 ]
Discuss the role of genes and chromosomes in determining individual and shared character features of the members of a species.
Diversity of eukaryote genomes
[ 1 ]
The table shows the estimated total number of genes in several organisms.
Species
Estimated number of genes
Saccharomyces cerevisiae (a yeast)
6000
Escherichia coli (a bacterium)
3200
Drosophila melanogaster (fruit fly)
14000
Canis familiaris (domestic dog)
19000
Oryza sativa (rice)
51000
Homo sapiens (human)
25000
What can be deduced from the information in this table?
Comparison of genome sizes
[ 2 ]
Using the data provided in the table, discuss whether genome size positively correlates to organism complexity.
Whole genome sequencing
[ 3 ]
Discuss the current and potential future uses of whole genome sequencing.
Difficulties with biological species concept
HL only
[ 1 ]
Outline a difficulty in applying the biological species concept to bacteria.
Chromosome number as shared trait
HL only
[ 1 ]
Sex is determined in the same way in pangolins as in humans. State how many autosomes there are in somatic cells of M. pentadactyla.
Dichotomous key development
HL only
[ 2 ]
Parts of a dichotomous key to organisms A, B, C and D are shown. Design missing parts of the key using features visible in the following diagrams.
1. Body with tentacles ..... A Body without tentacles ..... go to 2 2. ..... B ……go to 3 3. ..... C .....D
Environmental DNA barcodes
HL only
[ 1 ]
What is one application of DNA barcoding?
A3.2 Classification and cladistics [HL only]
Classification and cladistics use hierarchy, molecular evidence, clades, cladograms, molecular clocks, and domains to organize evolutionary relationships across biodiversity accurately.
Syllabus
First assessment 2025
Topic
A3.2
Level
HL
Classification is a testable claim about relationships
HL only
Classification does more than file organisms under names. It proposes which organisms belong together, so it should organize observations and support predictions about shared structures, functions and evolutionary history.
A useful classification lets biologists:
use the same names and groups worldwide
compare unfamiliar organisms with known relatives
connect new evidence to an organized body of knowledge
Traditional hierarchy
Evolutionary classification
Places organisms in fixed ranks such as kingdom, phylum, class, order, family, genus and species
Groups organisms by their inferred common ancestry
Rank boundaries can be arbitrary because evolution is continuous
Branches can represent different amounts of evolutionary divergence
Similar appearance may dominate the decision
Morphology is tested against molecular and other evidence
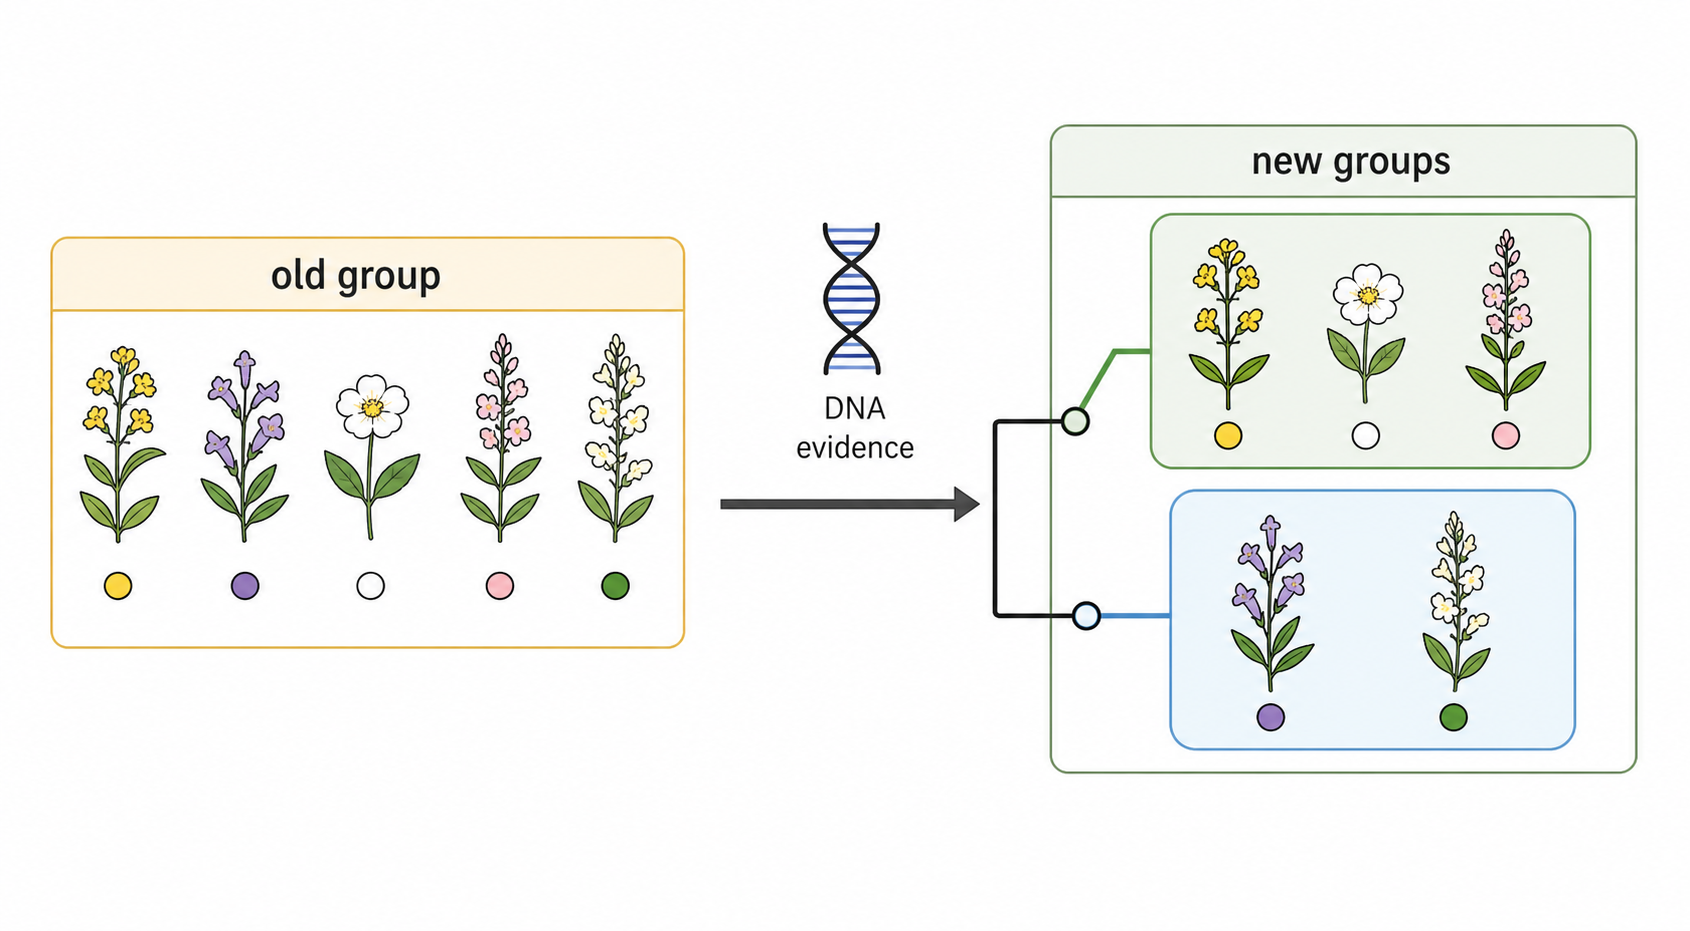
A named group is therefore a biological hypothesis. If new evidence shows that its members do not share the expected ancestry, the classification should change.
Shared function is not always shared ancestry
HL only
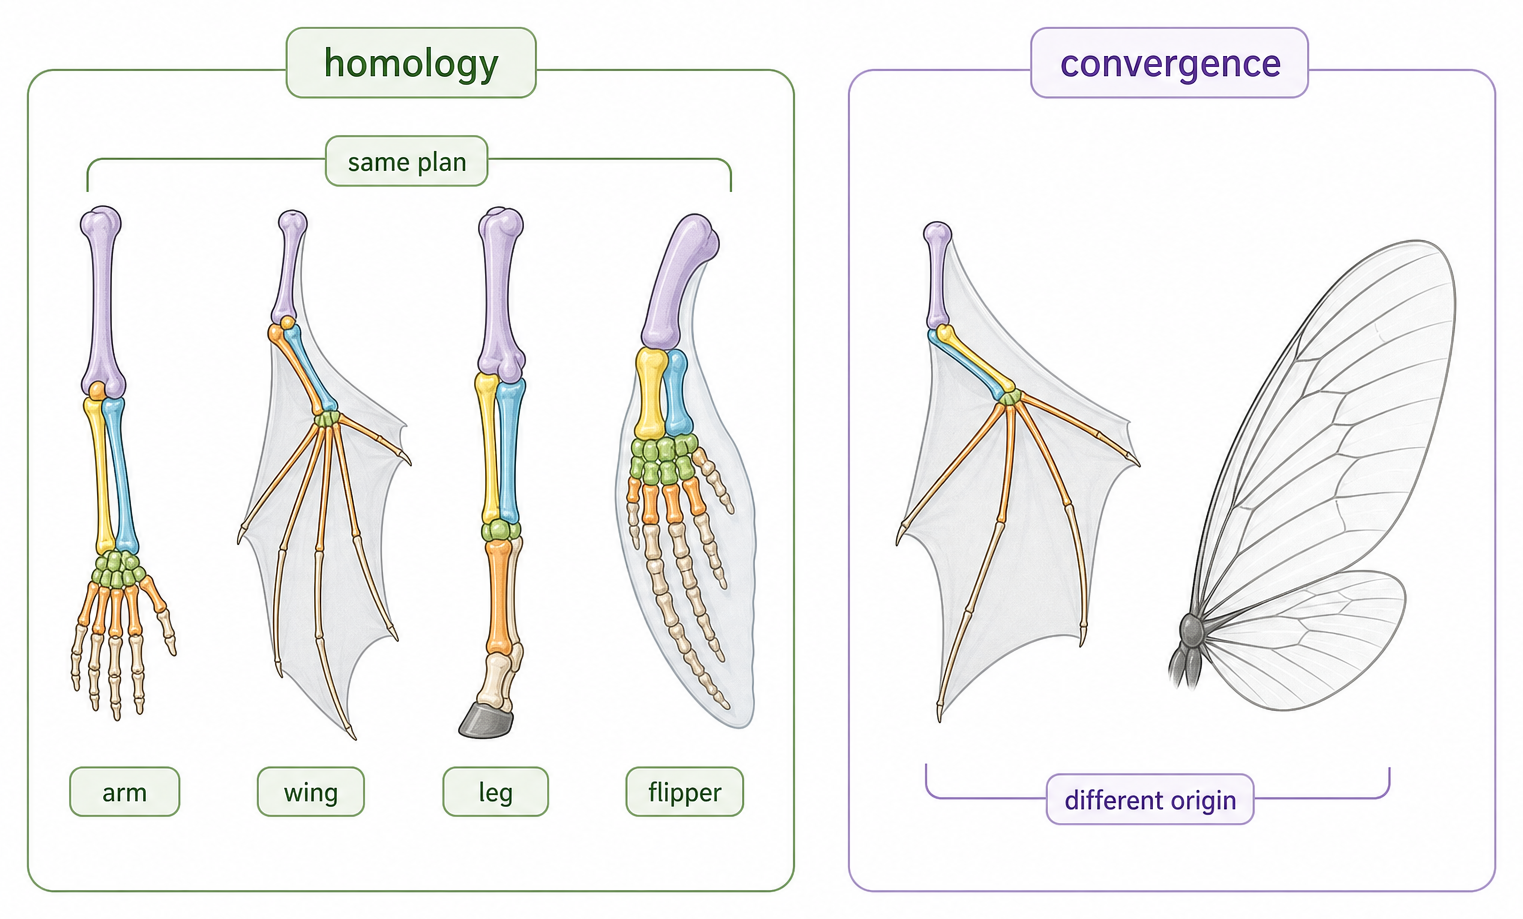
Homologous structures inherit the same underlying feature from a common ancestor, even when later evolution modifies that feature for different functions. Their shared origin can support placement in the same clade.
Analogous structures have similar functions but evolved independently under similar selection pressures. Treating resemblance alone as ancestry can therefore join unrelated lineages.
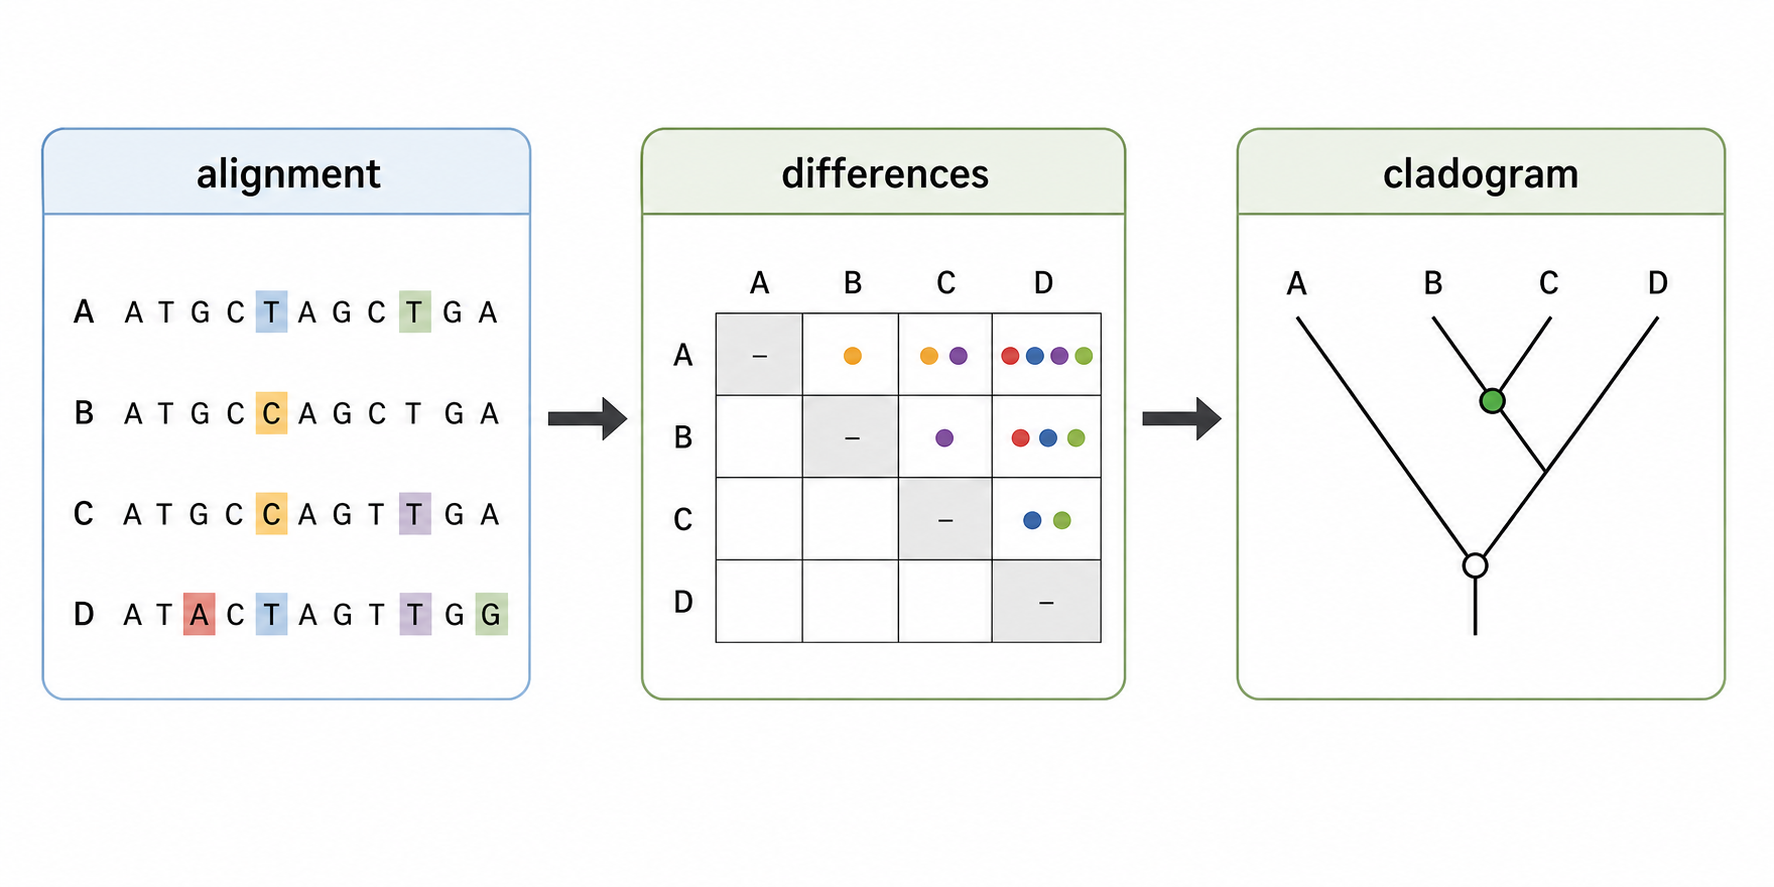
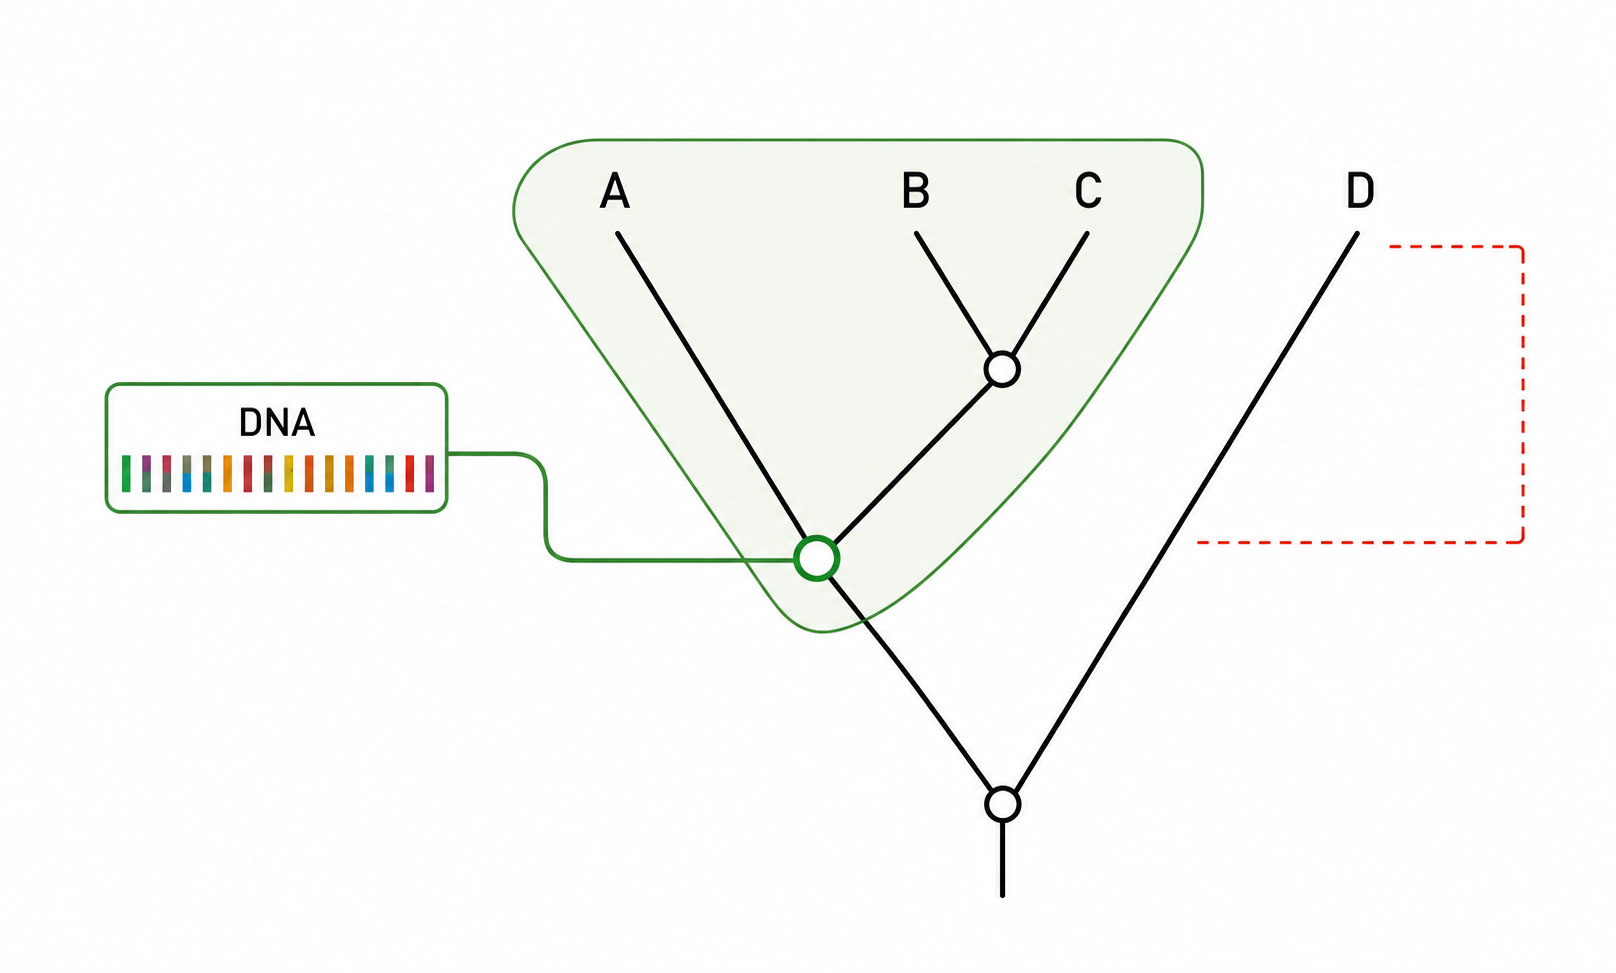
A clade is monophyletic: it contains one common ancestor and all of its descendants. A shared derived characteristic that helps identify a clade is a synapomorphy.
Possible synapomorphies include:
anatomical or physiological features
behaviour
homologous DNA, RNA or amino-acid sequences
Read relatedness by tracing backwards to a node
HL only
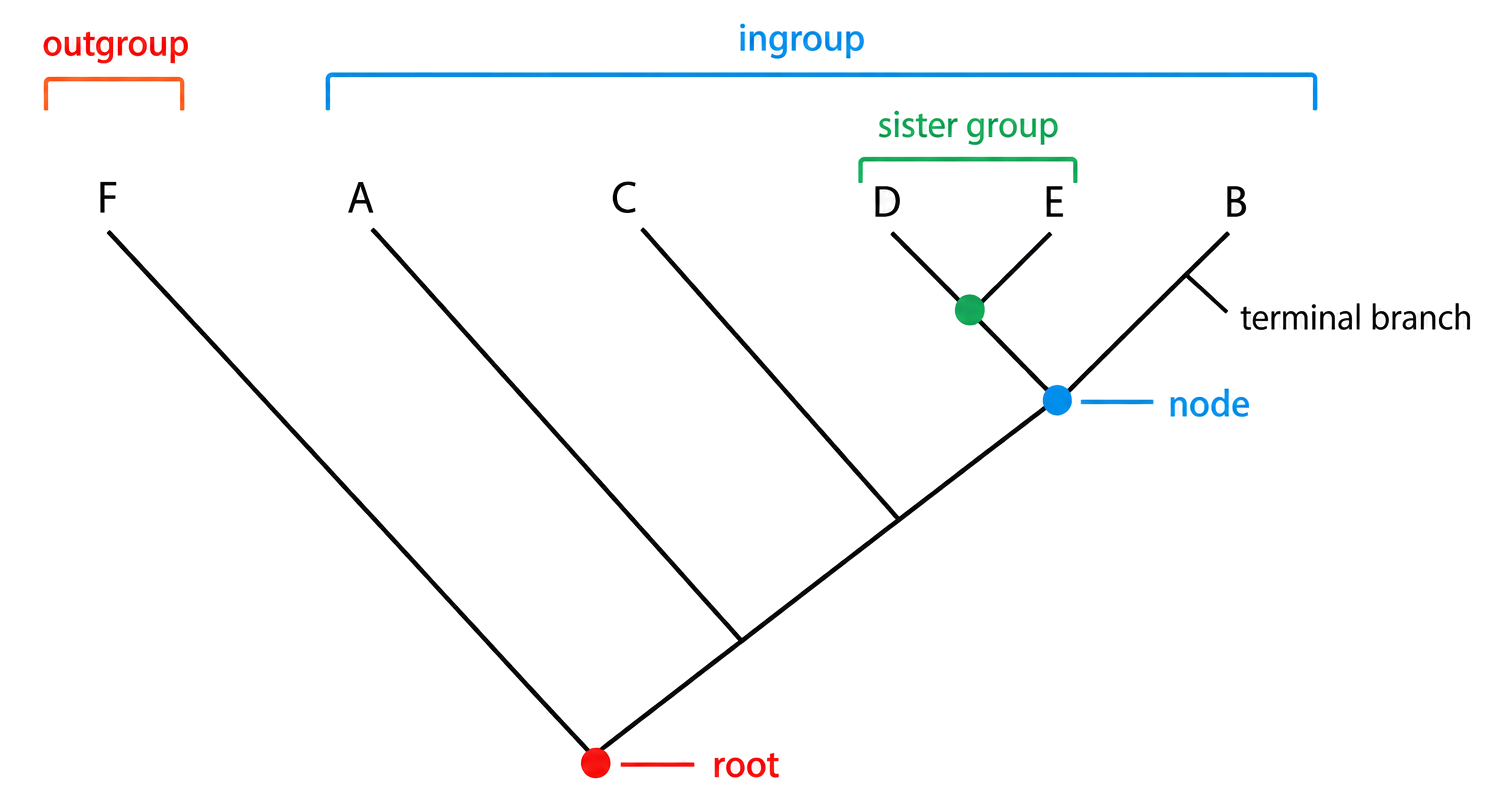
To compare two taxa, trace both branches backwards. The first node at which they meet represents their most recent common ancestor. Taxa that meet at a more recent node are more closely related, regardless of how near their tips appear on the page.
Root: common ancestor of every taxon shown
Node: hypothetical common ancestor and a divergence event
Terminal branch: lineage leading to the sampled taxon
Sister groups: lineages sharing an immediate common ancestor
Outgroup: a more distantly related comparison lineage outside the ingroup
Rotating branches around a node changes the drawing but not the relationships. The branching pattern carries the evidence; left-to-right tip order does not.
A cladogram is inferred from comparable characters
HL only
1
Choose the same homologous gene, RNA region or protein from every taxon and align the sequences so equivalent positions are compared.
2
Record shared characters and sequence differences. Similarity is informative only when the compared positions have the same evolutionary origin.
3
Computer analysis evaluates alternative branching patterns that could account for the observed distribution of characters.
4
Under parsimony, prefer the cladogram that explains the evidence with the fewest evolutionary changes. It is the best-supported hypothesis under that rule, not absolute proof.
Sequence difference becomes a clock only after calibration
HL only
After two lineages diverge, mutations can accumulate independently in homologous sequences. On average, a greater sequence difference is consistent with a longer time since their common ancestor.
Using a molecular clock requires:
a homologous sequence compared across the taxa
an independently dated divergence, such as reliable fossil evidence, to calibrate the rate
the calibrated rate applied to the sequence difference for the unknown split
The result is an estimate. Mutation rates can differ among genes and lineages and can be affected by generation time, population history and selection. There is no single universal clock rate.
From a character to an evolutionary hypothesis
HL only
Move
Question to ask
What it supports
Choose a character
Is it homologous and comparable across taxa?
A defensible data set
Find shared derived states
Which taxa share a synapomorphy?
A candidate clade
Compare trees
Which branching pattern explains the characters with the fewest changes?
A parsimonious cladogram
Read the tree
Where is the most recent shared node?
A claim about relative relatedness
Calibrate sequence change
Is there an independent date and an appropriate rate?
An estimated divergence time
At every stage, distinguish the observation from the inference. A cladogram is a testable model of relationships, and a molecular-clock date is an estimate rather than direct observation of the past.
New evidence can split an old taxonomic group
HL only
The traditional figwort family grouped many plants by similar flower morphology. That resemblance was a classification hypothesis, not proof of one recent common ancestor.
Comparisons of conserved chloroplast-gene sequences produced clades that did not preserve the old family boundary. Several genera were moved to other families, while some outsiders joined the redefined group.
The case shows how cladistics tests classification: molecular evidence can reveal that a shared appearance arose through convergence and falsify the original grouping. The specific genera are less important than the evidence → tree → reclassification reasoning.
rRNA evidence separated cellular life into three domains
HL only
Ribosomes occur in all cellular organisms, so homologous rRNA sequences can be compared across very distant groups. Their differences showed that prokaryotes contain two deeply distinct lineages, not one natural group.
The rRNA tree supports three deep lineages:
Bacteria (Eubacteria)
Archaea
Eukarya
“Prokaryote” still describes cells without a nucleus, but it does not name one monophyletic group. Similar cell organization can persist across lineages that diverged very early.
Independent cell features corroborate the three domains
HL only
Feature
Bacteria
Archaea
Eukarya
Chromosomes
Usually circular
Usually circular
Linear
Histone proteins
No true histones
Present
Present
Introns
Uncommon
Present in some genes
Common in many genes
Cell wall
Peptidoglycan when present
No peptidoglycan
No peptidoglycan; walls, if present, use cellulose or chitin
Membrane lipids
Ester-linked, unbranched fatty acids
Ether-linked, branched hydrocarbon chains
Ester-linked, unbranched fatty acids
These independent features agree with the rRNA evidence. Archaea share a prokaryotic cell organization with Bacteria but differ in fundamental molecular structures; some information-processing features resemble those of Eukarya.
Extreme habitats led scientists to study many archaea, but habitat does not define the domain. Archaea also occur in ordinary soils, oceans and animal digestive systems.
Match the claim to the evidence
HL only
Claim
Strongest relevant evidence
Boundary to remember
Two traits share an evolutionary origin
Homologous anatomy or homologous sequence data
Similar function alone may be convergence
Taxa form a clade
Shared derived characters and a tree containing an ancestor plus all descendants
A named traditional taxon may not be monophyletic
Two taxa are close relatives
A recent shared node
Tip position and branch rotation do not determine relatedness
One split is older than another
More accumulated difference in a calibrated homologous sequence
Rates vary, so dates are estimates
A classification should change
Independent evidence consistently contradicts its old boundary
A cladogram is a supported hypothesis, not direct observation
Cellular life has three domains
rRNA sequence patterns plus corroborating chromosome, histone, intron, wall and lipid evidence
“Prokaryote” describes cell organization but not one natural clade
Classification becomes scientifically useful when every group can be traced to evidence and revised when better evidence changes the inferred evolutionary relationships.
Need for classification
HL only
[ 4 ]
Outline the principles used by scientists to classify organisms.
Analysing cladograms
HL only
[ 2 ]
Outline what is meant by the "root" and "node" with reference to a cladogram.
Clades exam focus
HL only
[ 3 ]
Outline the types of evidence that can be used to place a species in a particular clade.
Molecular clock
HL only
[ 1 ]
State the relationship between divergence time and number of substitutions.
Constructing cladograms
HL only
[ 3 ]
Discuss the use of amino acid sequences of proteins as the basis for constructing cladograms.
Difficulties with traditional hierarchy
HL only
[ 1 ]
Based on the taxa shown, deduce a difficulty in gathering data to study turtle ancestry.
Advantages of evolutionary classification
HL only
[ 8 ]
Explain how evolutionary relationships and cladograms can be used for classification.
Testing classification correspondence
HL only
[ 1 ]
The figwort family is a large one consisting of many flowering plants that look similar. For what reason have some members of the family been reclassified into a new family?
Three domains classification
HL only
[ 2 ]
Distinguish between the two domains of prokaryotes.
A4.1 Evolution and speciation
Evolution and speciation explain how heritable variation, molecular evidence, selection, isolation, and chromosome change produce population divergence and new species over time.
Syllabus
First assessment 2025
Topic
A4.1
Level
HL
Evolution changes populations across generations
Evolution is the cumulative change in the heritable characteristics of a population across generations. The population evolves when inherited variants change in frequency; an individual does not evolve during its lifetime.
Change
Inherited by offspring?
Evolutionary meaning
A DNA variant in a reproductive lineage
potentially
can enter the population gene pool
A stable heritable change in gene regulation
sometimes
can contribute while it remains transmissible
Larger muscles from training or a stretched body part
no
an acquired phenotype, not Darwinian evolution
Mutation and recombination generate heritable variation. Selection, genetic drift and gene flow alter which variants are passed on, so the distribution of characteristics in the next generations can differ from the starting population.
Molecular unity and difference reveal evolutionary history
Nearly all cellular life stores heredity in DNA, uses an almost universal genetic code, translates RNA on ribosomes, transfers energy with ATP and shares core metabolic chemistry. This deep unity is evidence of common ancestry.
Observation in homologous sequences
Supported inference
many conserved positions
inheritance from a shared ancestor
fewer sequence differences between two taxa
usually a more recent common ancestor
differences accumulated after a split
evidence of divergence, interpreted with the gene and model used
Sequence similarity is evidence, not a complete history by itself. The sequences must be homologous, sampling must be adequate, and different genes or evolutionary models can yield different estimates.
Selective breeding exposes the power of inherited variation
1
A breeding population already contains heritable variation produced by mutation and recombination. The breeder does not create the desired allele by wanting it.
2
Individuals with a desired phenotype are chosen as parents, so alleles contributing to that phenotype are overrepresented among their offspring.
3
Repeating the choice over generations shifts the population mean and can produce striking breeds or crop forms, as in pigeons, Brassica vegetables and maize.
Artificial and natural selection act on inherited variation, but the selecting agent differs: human preference in breeding, and differential survival or reproduction in the environment.
Homology records divergence; analogy records convergence
Pattern
Origin
Evolutionary process
Example
Homologous structures
one ancestral structure, modified for different functions
divergent evolution
pentadactyl forelimbs for grasping, flight, running or swimming
Analogous structures
independent structures shaped by similar selection
convergent evolution
bat and insect wings as flight surfaces
Similarity of function does not establish close ancestry. Classify evolutionary relationships using homologous features and independent molecular evidence; use analogous features to explain how similar niches can produce similar solutions.
Speciation begins when gene flow no longer unifies a population
1
One ancestral species begins as populations exchanging alleles through reproduction; gene flow tends to keep their gene pools similar.
2
A geographic, ecological, temporal, behavioural or chromosome barrier reduces allele exchange, so the populations no longer evolve as one fully connected gene pool.
3
Mutation, genetic drift and different selection pressures alter allele frequencies independently on each side of the barrier.
4
If reproductive isolation becomes strong enough that the lineages no longer exchange genes and produce fertile offspring, one pre-existing species has split into two or more species.
Isolation changes which variants succeed in each gene pool
1
Chimpanzees occur mainly north of the Congo River and bonobos south of it. A founder population crossing during a lower-water period, followed by renewed river isolation, is one evidence-based explanation for their divergence from a common ancestor.
2
The river restricts movement and mating, so alleles are not continually mixed between the populations. Isolation creates the conditions for divergence; it does not directly specify which traits will evolve.
3
Different environments and social or ecological interactions can favour different heritable variants, while mutation and genetic drift also change each gene pool independently. Over many generations these processes can establish reproductive isolation.
A present-day barrier and a modern distribution support a historical hypothesis but do not by themselves date the split. Fossil, geological and molecular evidence are needed to test when and how isolation occurred.
Summary: match evolutionary evidence to the claim
Evidence
What it supports
What it does not show alone
molecular universals
deep common ancestry
the exact branching history
homologous-sequence differences
relative relatedness and divergence
a conclusion independent of gene choice or model
selective breeding
populations respond rapidly to selection on heritable variation
that humans direct natural evolution
homologous structures
descent with modification
identical function
analogous structures
convergence under similar selection
recent common ancestry
Evolution can change one connected population without creating a new species. Speciation specifically requires a pre-existing species to split: gene flow falls, gene pools diverge independently, and reproductive isolation prevents renewed allele mixing.
Keep the scale explicit: individuals carry variants and reproduce; populations evolve; lineages split into species.
Allopatric and sympatric speciation differ in how isolation begins
HL only
Dimension
Allopatric speciation
Sympatric speciation
Spatial relation
populations separated geographically
populations remain in the same area
Initial barrier
river, mountain, island colonization or other physical separation
temporal, behavioural, ecological or chromosome-based isolation
Shared mechanism
reduced gene flow allows independent selection, mutation and drift
reduced gene flow allows independent selection, mutation and drift
Test
show that the spatial barrier plausibly restricted allele exchange
show that mating or fertilization is restricted despite overlap
Geography is not the definition of reproductive isolation. Some gene flow can persist if divergent selection is strong enough to overcome its homogenizing effect, and intrinsic barriers may evolve after an earlier period of geographic separation.
Adaptive radiation turns ecological opportunity into related species
HL only
1
An ancestral population reaches an environment containing several underused ecological niches, such as different food sources or habitats.
2
Heritable variants that improve performance in different niches leave more offspring in those niches, so populations diverge in traits such as beak form.
3
Reduced gene flow and reproductive isolation turn the diverging populations into several related species. Niche differences reduce direct competition and allow the species to coexist.
Adaptive radiation is therefore rapid diversification from one ancestor into multiple species adapted to different ecological roles; it is not simply variation within one population.
Prezygotic barriers stop allele transfer before a zygote forms
HL only
Barrier
How allele mixing is prevented
Example
habitat or temporal isolation
potential mates do not encounter one another in the right place or season
spring- and autumn-spawning populations
behavioural isolation
courtship signal and preference do not match
divergent bird displays
mechanical or gametic isolation
mating or gamete recognition fails
incompatible structures or gametes
Prezygotic barriers prevent mating or fertilization. They avoid the cost of producing low-fitness hybrids and can therefore be strengthened by selection where related populations meet, a process called reinforcement.
Postzygotic barriers reduce hybrid survival or fertility
HL only
Barrier
How allele mixing is prevented
Example
hybrid inviability
offspring fails to develop or survive
incompatible developmental gene interactions
hybrid sterility
hybrid survives but cannot form balanced gametes
mule
Species boundaries can be partly permeable. Occasional hybrids do not prove that two gene pools are fully connected: measure how often hybrids form, whether they survive and reproduce, and how much gene flow actually occurs.
Autopolyploidy can isolate a plant in one generation
HL only
1
A meiotic spindle failure can produce an unreduced 2n gamete instead of a haploid n gamete.
2
Fusion of two 2n gametes, or genome doubling in a diploid individual, produces a 4n autopolyploid containing extra chromosome sets from the same species.
3
A 4n plant crossed with a 2n ancestor produces 3n offspring. Three homologues cannot divide into balanced pairs during meiosis, so the triploid is usually infertile.
4
Two compatible 4n plants can pair homologues and produce fertile offspring with one another. The chromosome-number barrier can therefore establish a reproductively isolated lineage abruptly.
Allopolyploidy restores pairing after hybridization
HL only
1
Gametes from two related species, carrying chromosome sets A and B, can fuse to form an AB hybrid. Each chromosome lacks a fully homologous partner, so meiosis is unbalanced and the hybrid is usually sterile.
2
Whole-genome doubling produces AABB. Every chromosome now has a homologous partner, allowing balanced pairing and potentially fertile gametes.
3
The fertile allopolyploid can reproduce with others carrying AABB but not successfully with either original diploid parent, creating a new reproductively isolated lineage.
The plant genus Persicaria contains multiple allopolyploid species; widespread P. lapathifolia has contributed to several hybrid lineages. The named case illustrates the mechanism—it does not imply that every hybrid automatically becomes a species.
HL Summary: identify what stops alleles mixing
HL only
Route
First reduction in gene flow
How distinct lineages become established
allopatric
physical separation
independent selection, mutation and drift; later reproductive barriers
sympatric
temporal, behavioural, ecological or chromosome barrier in one area
assortative mating or gamete and ploidy barriers
adaptive radiation
repeated ecological separation among niches
divergent selection plus reproductive isolation produces several related species
polyploid plant speciation
chromosome-set mismatch with diploid ancestors
compatible polyploids pair chromosomes and reproduce with one another
Prezygotic barriers prevent mating or fertilization; postzygotic barriers reduce hybrid survival or fertility. Both matter because they reduce the movement of alleles between gene pools.
Speciation is complete lineage splitting, not simply visible difference. Ask what reduced gene flow, what made the gene pools diverge, and what now maintains reproductive isolation.
Evolution as change in heritable characteristics
[ 8 ]
Explain how the process of evolution occurs.
Evidence from sequences
[ 6 ]
Discuss how variations in proteins can indicate phylogeny and be used as an evolutionary clock.
Evidence from selective breeding
[ 3 ]
Outline the evidence for evolution provided by selective breeding.
Evidence from homologous structures
[ 4 ]
Describe the evidence for evolution from homologous structures.
Convergent evolution
[ 4 ]
Explain how analogous structures can evolve.
Speciation by splitting of pre-existing species
[ 5 ]
Describe the changes that occur in gene pools during speciation.
Reproductive isolation and differential selection
[ 7 ]
Explain how isolation leads to speciation.
Sympatric vs. allopatric speciation
HL only
[ 3 ]
Compare allopatric speciation and sympatric speciation using the table below.
Allopatric
Sympatric
Adaptive radiation
HL only
[ 5 ]
The human hand is an example of adaptive radiation. Outline adaptive radiation.
Abrupt speciation in plants
HL only
[ 7 ]
Research suggests that many living plant species are polyploid. Explain how polyploidy occurs and, using a named example, how polyploidy can lead to speciation.
A4.2 Conservation of biodiversity
Conservation of biodiversity connects biodiversity measurement, human-driven losses, ecosystem evidence, and targeted conservation strategies for protecting species, communities, and evolutionary history.
Syllabus
First assessment 2025
Topic
A4.2
Level
HL
Biodiversity Exists at Three Linked Levels
Biodiversity is the variety of life at genetic, species and ecosystem levels. A community can have the same richness as another yet lower diversity if one species dominates.
D=∑n(n−1)N(N−1)
N is the total number of organisms and n is the number in each species. For comparable samples, a larger D indicates greater species diversity.
Present and Past Biodiversity Need Different Evidence
Present biodiversity is estimated from field surveys, species records and DNA-based discovery. Past biodiversity is reconstructed from fossils placed in dated geological contexts.
Claim
Main evidence
Main limit
about 9 million living species
sampled habitats, described species and extrapolation
many habitats and species remain unsampled or undescribed
change in diversity through geological time
fossils, stratigraphy and radiometric dating
fossilisation and discovery are selective and incomplete
Trace Human Pressure to Extinction through Populations
Human activity can raise mortality, remove habitat and shrink populations until recovery is impossible. Small fragmented populations also face inbreeding, genetic drift and chance events.
Case
Human pressure
Population effect
Wider effect
North Island giant moa
hunting and forest clearance
mortality rose while habitat fell
extinction
Caribbean monk seal
hunting and depletion of food by fishing
a small population could not recover
extinction and loss of a top predator
Ecosystem Loss Breaks Structure and Process
Ecosystem loss includes conversion, degradation and fragmentation. These change habitat structure and abiotic conditions, disrupt interactions and nutrient cycling, and reduce resilience.
Ecosystem
Pressures
Biological pathway
Borneo mixed dipterocarp forest
logging, fire and oil-palm conversion
canopy and habitat loss → fragmentation → decline of forest communities
Great Barrier Reef
warming, falling pH, runoff and fishing
coral stress and mortality → habitat loss → reef-community decline
A Biodiversity Crisis Is a Trend, Not One Snapshot
A biodiversity crisis is supported by consistent declines across repeated, comparable measurements, not by one low count.
Set a baseline with defined sites, season, method and sampling effort.
Repeat the same protocol and control changes in detectability.
Track richness, evenness, abundance and, where suitable, Simpson reciprocal index.
Compare independent datasets and syntheses such as IPBES reports.
Evidence source
Strength
Reliability check
peer-reviewed study
detailed methods and scrutiny
sampling design, replication and uncertainty
citizen science
wide spatial and temporal coverage
training, validation and correction for reporting bias
Human Demand Acts through Several Biological Drivers
Population size and consumption create pressure through land, food, energy and material demand. Biodiversity changes through the biological mechanism of each driver.
Driver
Biological mechanism
Useful response to monitor
habitat conversion and urbanisation
habitat area and connectivity fall
range, occupancy and fragment connectivity
overexploitation
mortality exceeds recruitment
abundance, age structure and harvest rate
pollution and climate change
survival, reproduction or species interactions change
reproductive success, mortality and distribution
introduced invasive species
competition, predation, disease or habitat change
native abundance and invader spread
An alien species occurs outside its natural range through human activity. It is invasive when it spreads and causes ecological or economic harm; alien does not automatically mean invasive.
Conservation Must Match the Threat and the Scale
Conservation works when the intervention removes or reduces the diagnosed threat and protects a viable population, habitat or ecological process.
Approach
Best suited to
Examples
Key condition
in situ
protecting species in functioning habitat
reserves, corridors, rewilding
threats must be controlled in the habitat
ex situ
preventing immediate loss or preserving genetic material
captive breeding, zoos, botanic gardens, seed and tissue banks
genetic diversity and suitable release habitat must be maintained
diagnose threat → select action at the same scale → set a measurable biological target → monitor → adapt management
EDGE Prioritizes Unique Evolutionary History at Risk
EDGE combines Evolutionary Distinctiveness (ED) with Global Endangerment (GE). ED measures how isolated a species is on the tree of life; GE reflects IUCN extinction risk.
High ED + high GE → high EDGE priority. Protecting such a species avoids losing a disproportionately large amount of evolutionary history.
EDGE is a prioritisation tool, not the whole conservation plan: feasibility, ecosystem role, cost and the causes of decline still shape the intervention.
Summary: Turn Biodiversity Evidence into Action
Focus
Measure the state or trend
Diagnose the driver
Match the action
Monitor recovery
genetic diversity
allelic variation, heterozygosity, population size
isolation, bottleneck or inbreeding
reconnect populations or manage breeding
genetic diversity and effective population size
species diversity
richness, evenness, abundance, extinction risk
exploitation, invasive species or habitat change
protect, control threats, breed or reintroduce
abundance, recruitment and distribution
ecosystem diversity/function
habitat extent, condition and process indicators
conversion, fragmentation, pollution or climate stress
protect, restore and reconnect habitat
structure, processes and resilience
Define the level → establish a comparable trend → identify the causal driver → choose an action at the same scale → test whether biological recovery follows.
No single index or intervention is sufficient: species counts can miss evenness, genetic erosion and ecosystem dysfunction, while a reserve can fail without connectivity, enforcement or threat removal.
Biodiversity definition
[ 4 ]
Entire communities need to be conserved in order to preserve biodiversity.
Suggest different quantitative methods to measure changes in biodiversity in a community over time.
Anthropogenic species extinction
[ 1 ]
The North Island giant moa (Dinornis novaezealandiae) went extinct some time between the arrival of humans in New Zealand and the 1800s.
What do scientists believe to be the cause of this extinction?
Ecosystem loss causes
[ 1 ]
The satellite images show changes in the area covered by forest, much of which is mixed dipterocarp forest, on the island of Borneo in Southeast Asia.
Which human activities are most likely to have caused the changes shown in the map?
Causes of biodiversity crisis
[ 3 ]
List human actions that could threaten populations of insect pollinators such as bees.
Conservation approaches
[ 4 ]
Discuss in situ and ex situ conservation of endangered species.
EDGE of Existence programme
[ 2 ]
Outline the importance of the EDGE of Existence programme.