
Edexcel IGCSE Chemistry Communicate Findings

Edexcel IGCSE Chemistry Communicate Findings
Edexcel IGCSE Chemistry syllabusChemistry 4CH1Issue 3 (2024)

Practise Edexcel IGCSE Chemistry communicating experimental findings by drawing best-fit curves through plotted reaction data.

How this is tested

  • Draw a curve of best fit through plotted points from a practical chemistry investigation.
  • Shape a best-fit curve so it starts correctly and levels off where the reaction data plateaus.

Question 7(b)(ii)

[Maximum number: 1]

A student reacts small chips of calcium carbonate with an excess of dilute hydrochloric acid.

This is the student's method.
- add 5.00 g of small calcium carbonate chips to a conical flask
- add 30 cm330 \mathrm{~cm}^{3} of dilute hydrochloric acid which is in excess
- quickly add a cotton wool plug and place the conical flask on a balance
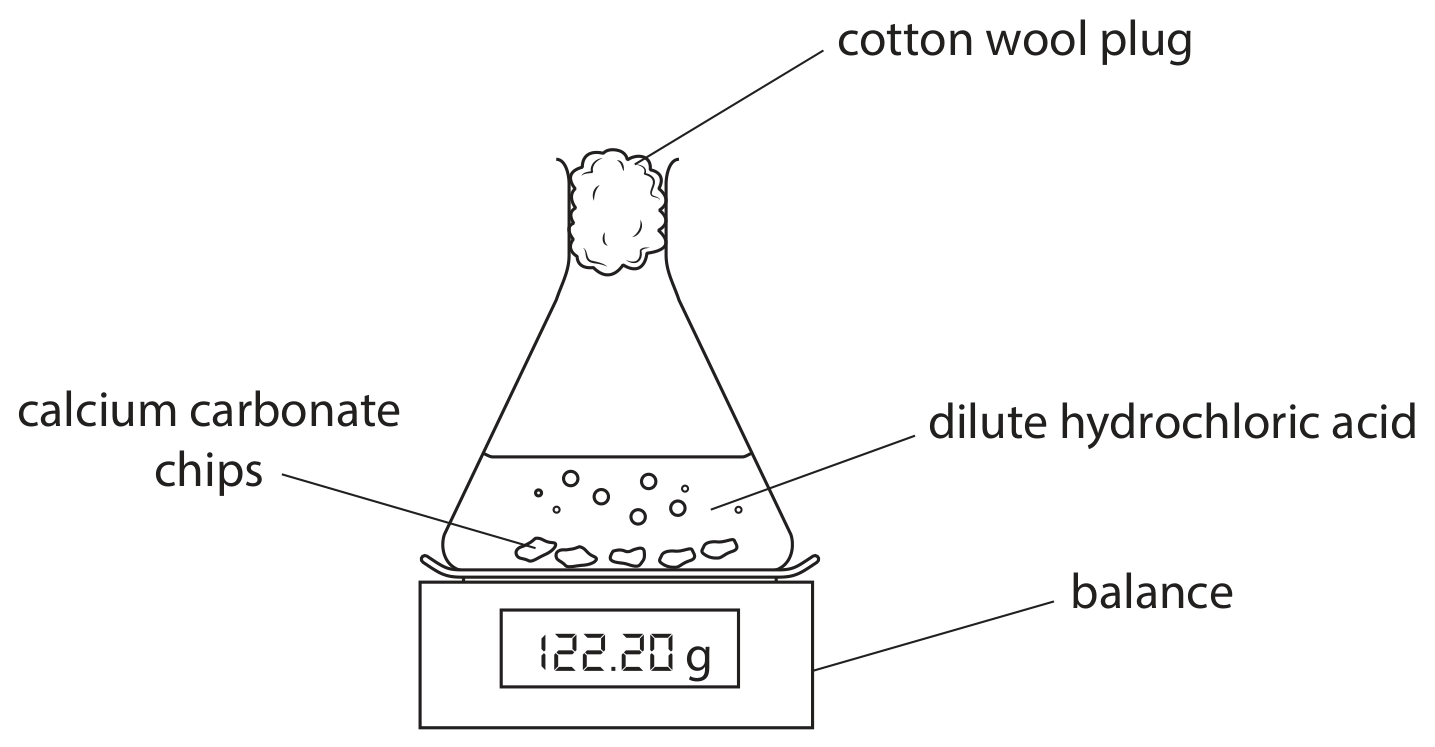
Figure for Question 7(b)(ii) — Edexcel IGCSE Chemistry

This is the equation for the reaction.

CaCO3( s)+2HCl(aq)CaCl2(aq)+H2O(l)+CO2( g)\mathrm{CaCO}_{3}(\mathrm{~s})+2 \mathrm{HCl}(\mathrm{aq}) \rightarrow \mathrm{CaCl}_{2}(\mathrm{aq})+\mathrm{H}_{2} \mathrm{O}(\mathrm{l})+\mathrm{CO}_{2}(\mathrm{~g})

The reading on the balance decreases as carbon dioxide gas is lost through the cotton wool plug.

The student repeats the experiment with a different mass of calcium carbonate and a different volume of dilute hydrochloric acid.
The hydrochloric acid is in excess.
The student records the total mass of carbon dioxide produced at 1-minute intervals for 8 minutes.

The table shows the student's results.
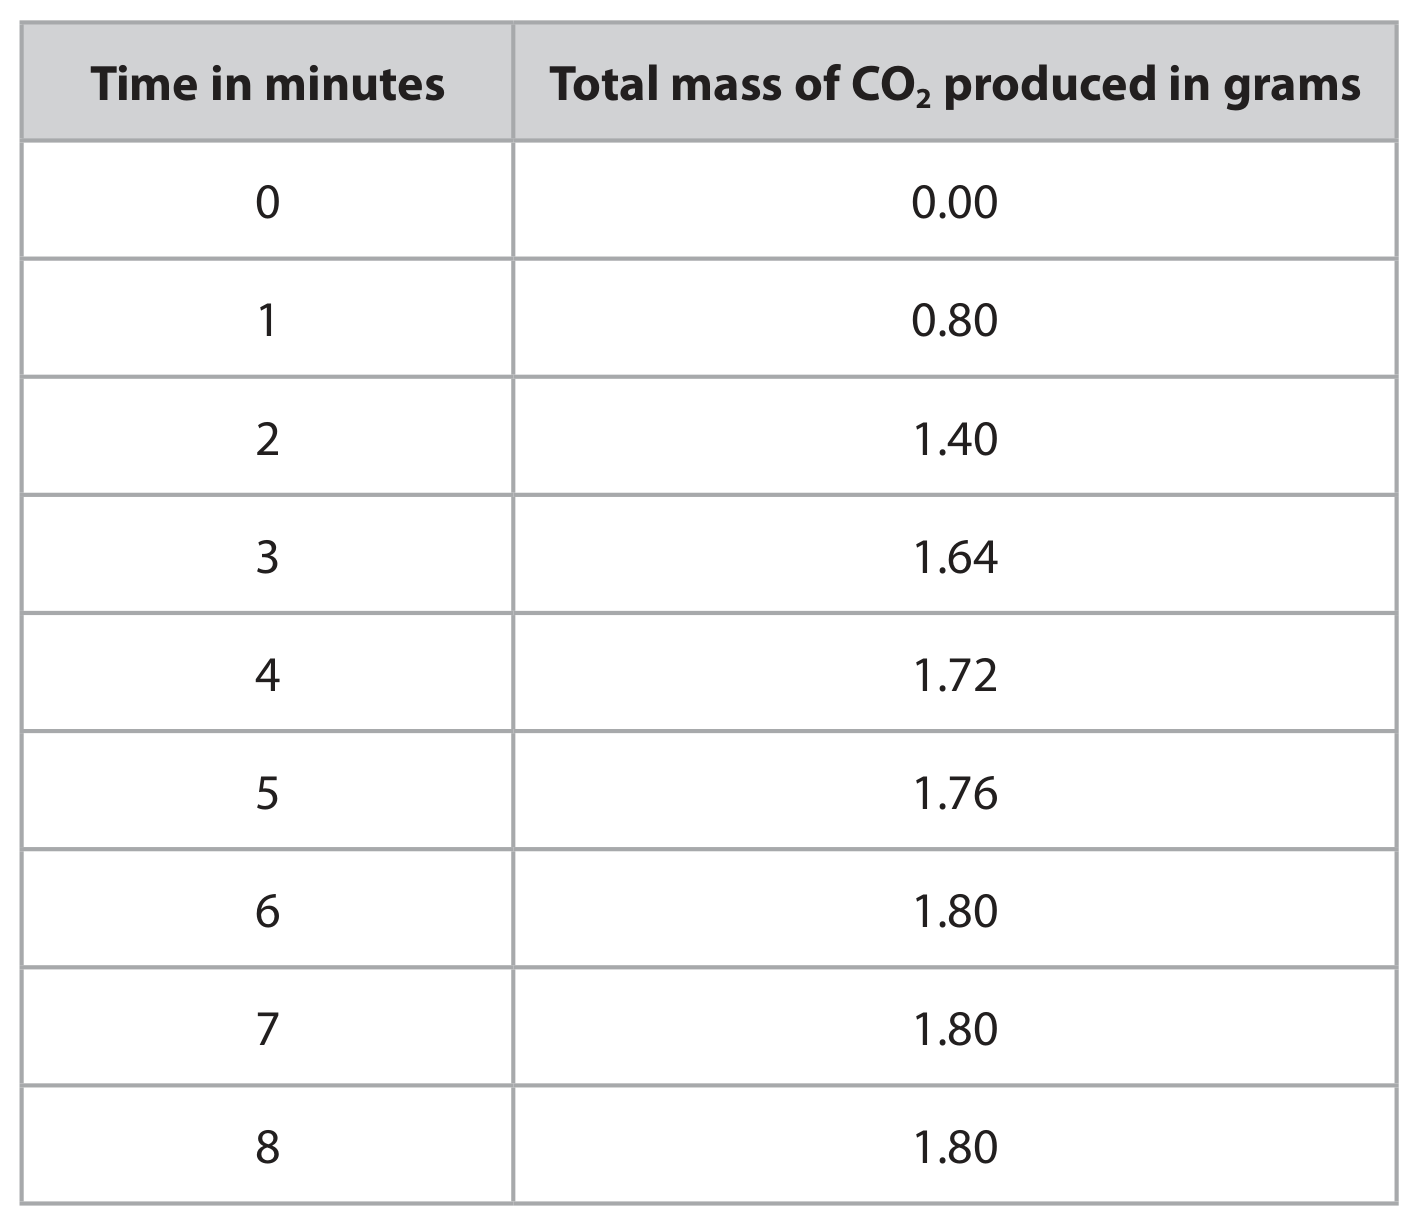
Table for Question 7(b)(ii) — Edexcel IGCSE Chemistry

Draw a curve of best fit through the points.
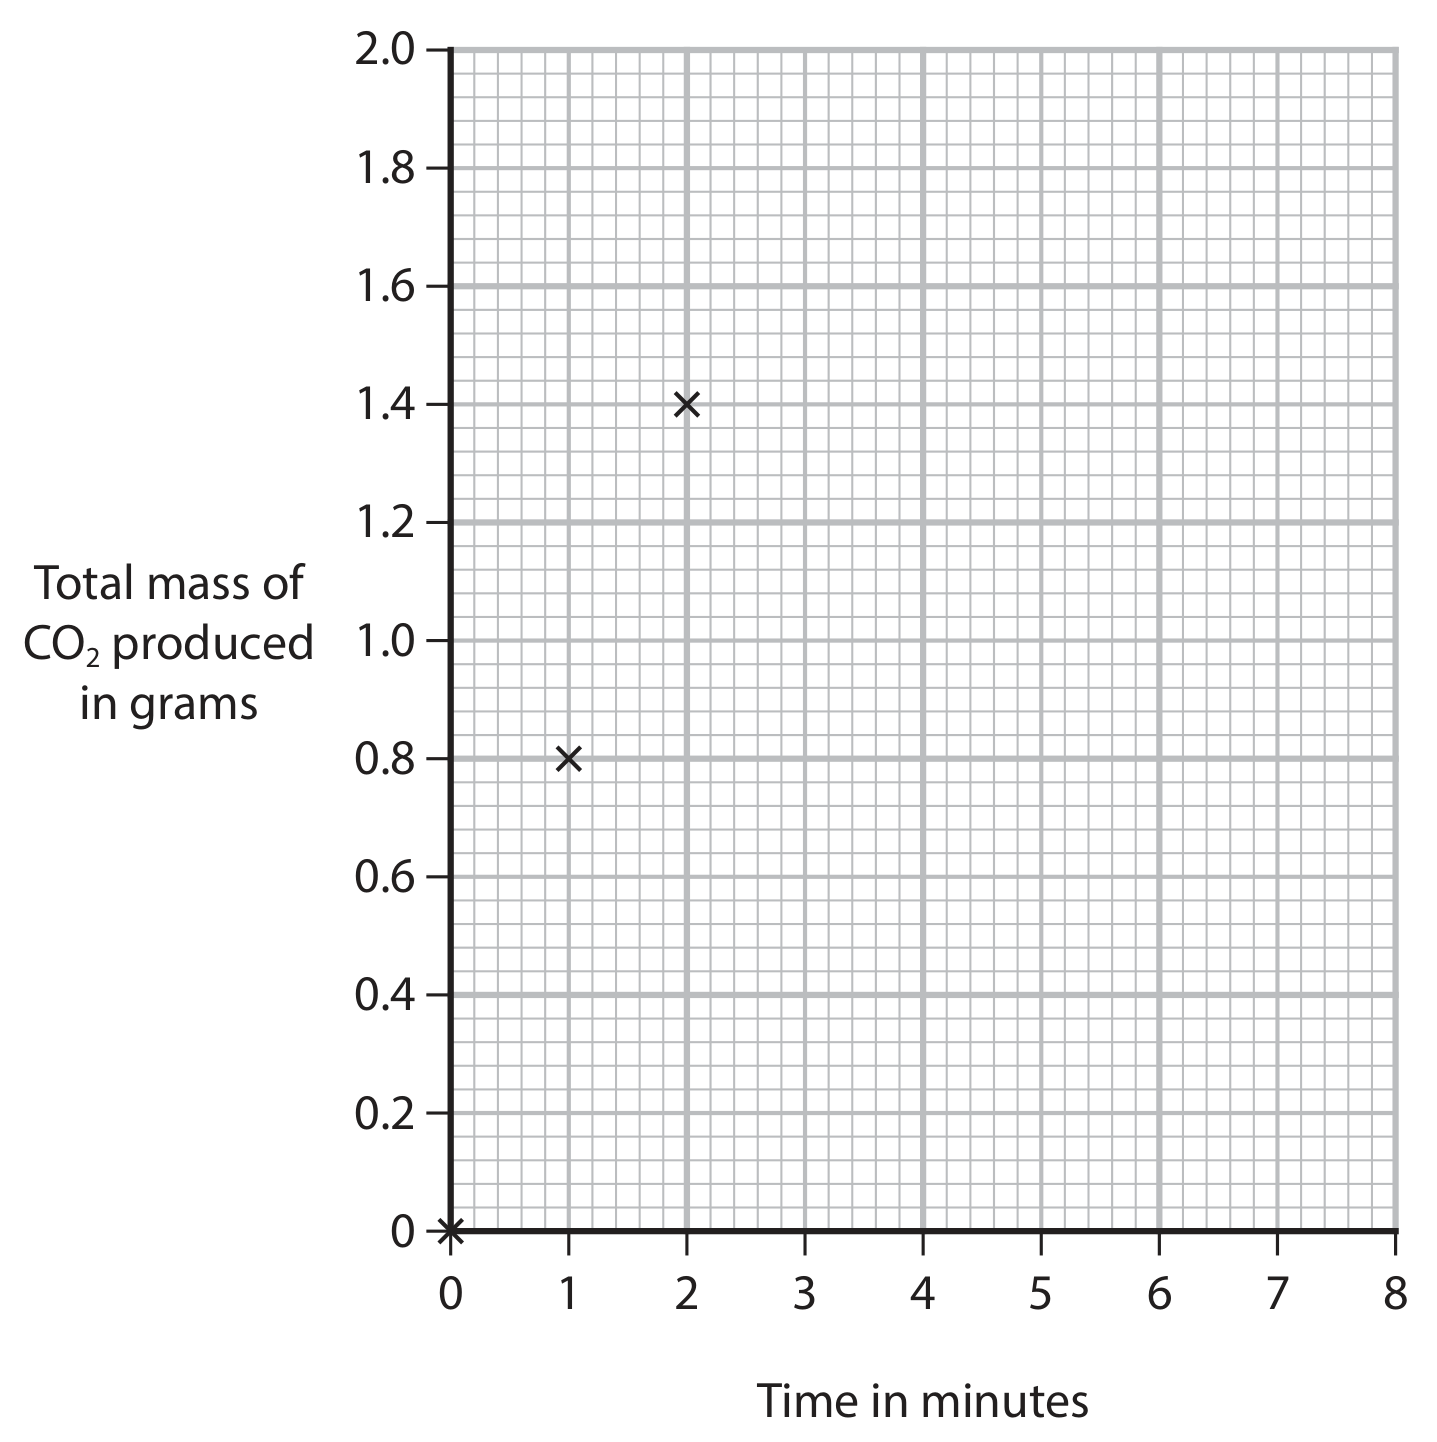
Figure for Question 7(b)(ii) — Edexcel IGCSE Chemistry