EduNinja

IGCSE Economics2.2. DemandTopic Practice

2.2. Demand

CAIE IGCSE Economics 2.2. Demand question practice helps you revise this syllabus point with the course map in view. Use this page to focus on one topic, check the style of questions available, and connect each attempt back to the knowledge area it is testing.

EduNinja keeps Economics practice aligned to CAIE, so you can move from topic review into exam-style question bank work without losing the syllabus structure. Start with a small set, mark the weak steps, then return to nearby topic links when a definition, graph, calculation, or explanation needs repair.

Question 1(e)

[Maximum number: 4]

Read the source material carefully before answering Question 1.
Source Material: Cambridge (UK) and Education

Source Material: Cambridge (UK) and Education

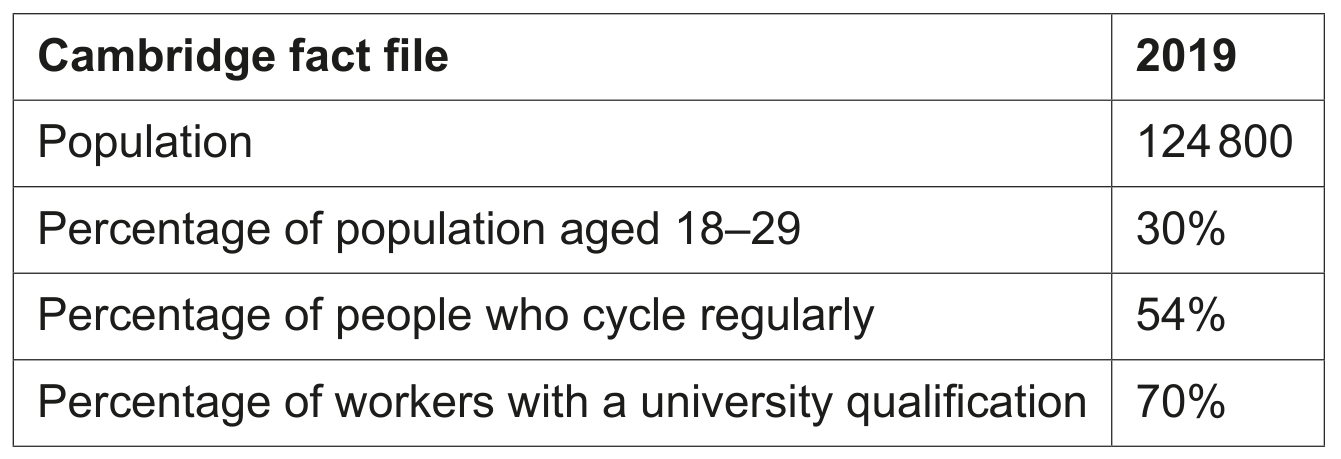
Cambridge ranks number one amongst all UK cities in terms of the percentage of workers with a university qualification. It is also ranked number two in the UK in terms of the percentage of people aged 18-29. This is due to the high number of university students in Cambridge. Although the city has a relatively small population, its contribution to the overall size of the UK economy is significant.

Many firms in Cambridge operate in the education, healthcare, research and development, and hi-tech manufacturing industries. Cambridge firms' exports are highly knowledge-intensive, making them highly priced and price-inelastic in demand. Increasing global incomes have also increased the demand for services such as education from Cambridge.

The increase in the size of the education industry has the potential to reduce poverty. This is because a more educated labour force is able to earn higher wages and also have access to more information on health. Table 1.1 shows the percentage of population aged 25-64 with a university degree and the GDP per head in selected countries in 2019.
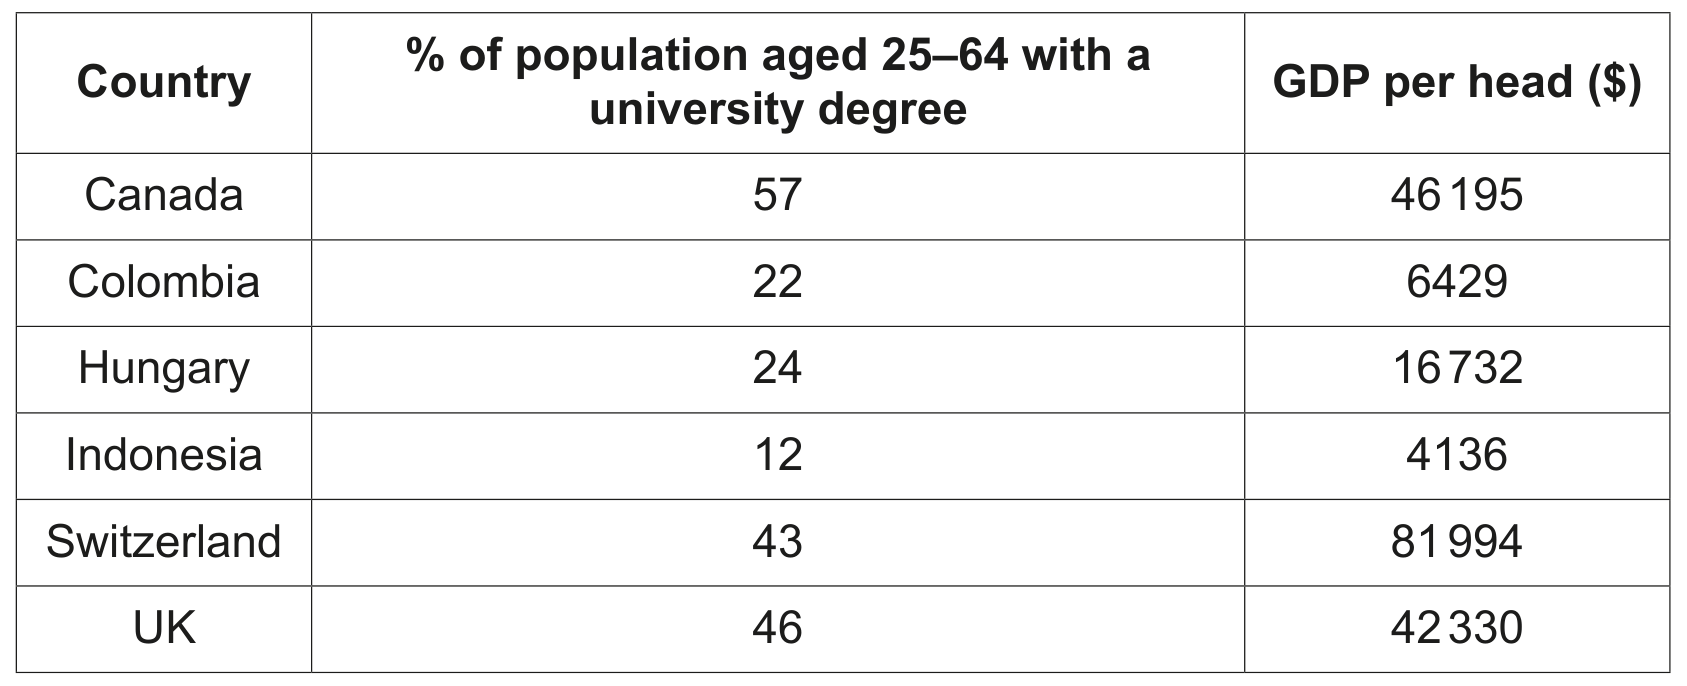
Table 1.1 Percentage of population aged 25-64 with a university degree and the GDP per head in selected countries in 2019

Table 1.1 Percentage of population aged 25-64 with a university degree and the GDP per head in selected countries in 2019

Many of the people who live in Cambridge are strong supporters of globalisation and free trade between countries. A large number of firms in Cambridge depend on export revenues.

Cambridge is an attractive location for growing firms because of the availability of many highly skilled and educated workers from all over the world. It has good infrastructure including access to ultra-fast broadband and transport links to other cities and international airports. However, firms may be faced with high land and office costs. In 2019, Cambridge was the city with the third highest house prices in the UK. Poor air quality may also discourage workers from moving to Cambridge.

Draw a demand and supply diagram to show the effects of increased global income on the market for education in Cambridge.
Question 1(f)

[Maximum number: 4]

Read the source material carefully before answering Question 1.

Source material: Istanbul's geographical advantage

Source material: Istanbul's geographical advantage

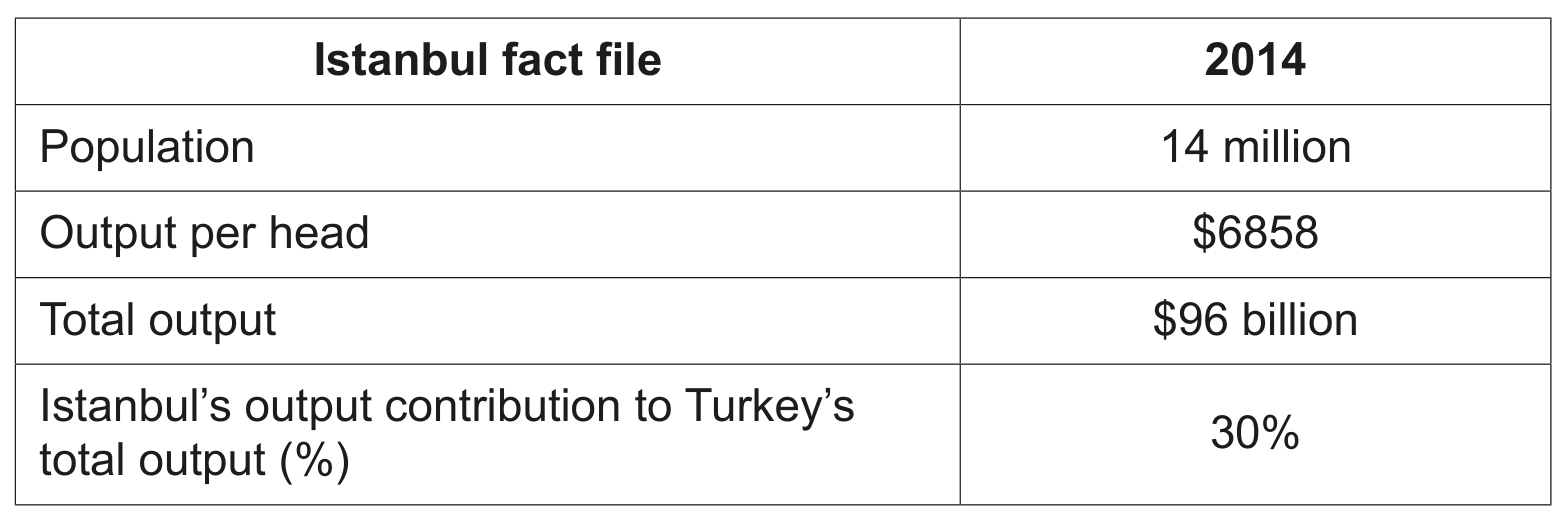
Istanbul is Turkey's largest city by population size. In 2014, its population was approximately 14 times more than it was in 1955. This could be due to increased migration from rural areas to cities and improved healthcare. Istanbul also has the highest output per head of all regions in Turkey.

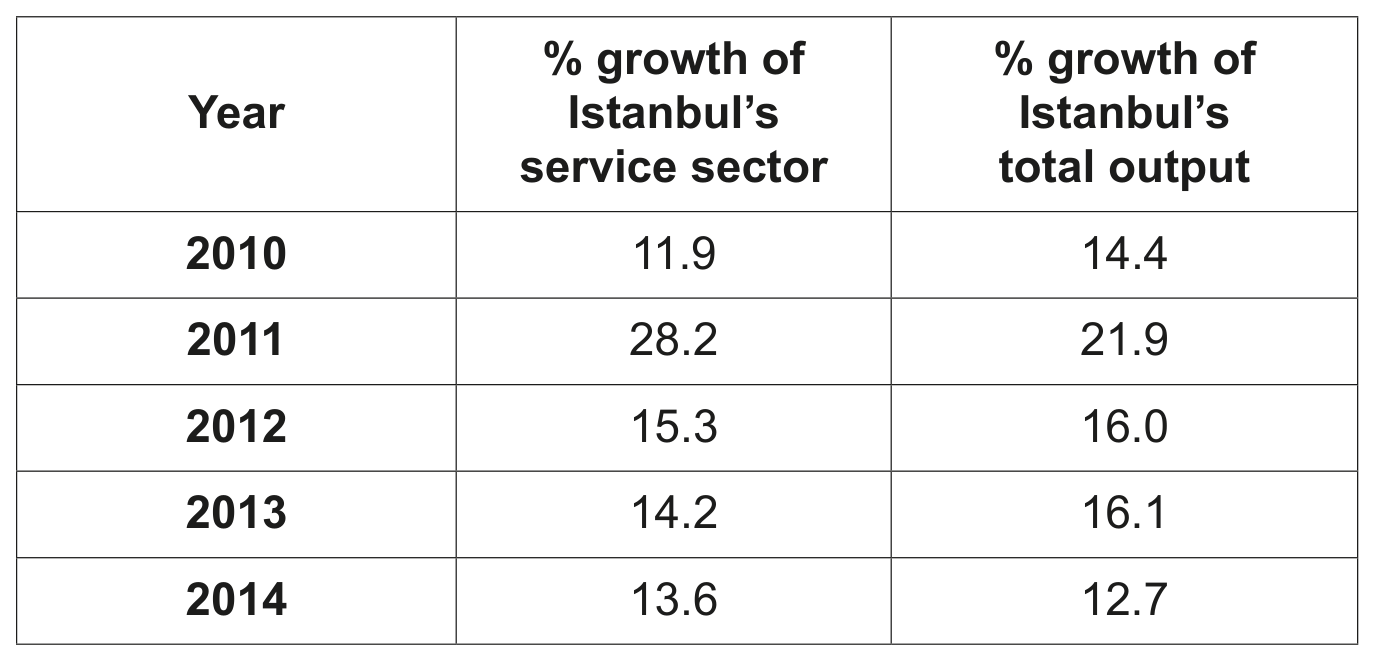
Good transport links have contributed to Istanbul's economic growth. In addition to good land transport, Istanbul is also home to the 14th 14^{\text {th }} largest airport in the world, measured by passenger numbers. From Istanbul, there is access to a market of $24\$ 24 trillion with 1.5 billion people within a flight time of 4 hours. In addition to affordable international air travel to and from Istanbul, domestic air travel is also very affordable. This is most likely due to economies of scale. There is also a high level of competition in this industry which influences prices and quality of service. The growth in transport industries, along with growth of financial services, has contributed greatly to Istanbul's growth rate as shown in Table 1.1.

Table 1.1 The percentage growth of Istanbul's service sector and the percentage growth of Istanbul's total output 2010-2014

Table 1.1 The percentage growth of Istanbul's service sector and the percentage growth of Istanbul's total output 2010-2014

Foreign investment is flowing into Istanbul. Multinational companies (MNCs) are finding Istanbul an attractive city to invest in because of the low cost of living. These MNCs are affecting employment, the level of technology and wages in Istanbul.

However, there is worry that such confidence in the Turkish economy may not last. Many companies have depended on borrowing for expansion. Increased interest rates around the world may make it harder for such companies to continue borrowing and also to attract new customers. If there are greater worries about safety for tourists in Turkey in the future, this may cause fewer people to book flights to Turkey.

Draw a demand and supply diagram to show the effects on flights to Turkey of greater worries about safety for tourists.

Question 1(h)

[Maximum number: 6]

Read the source material carefully before answering Question 1.

Source material: The destruction of forests in Indonesia

Source material: The destruction of forests in Indonesia

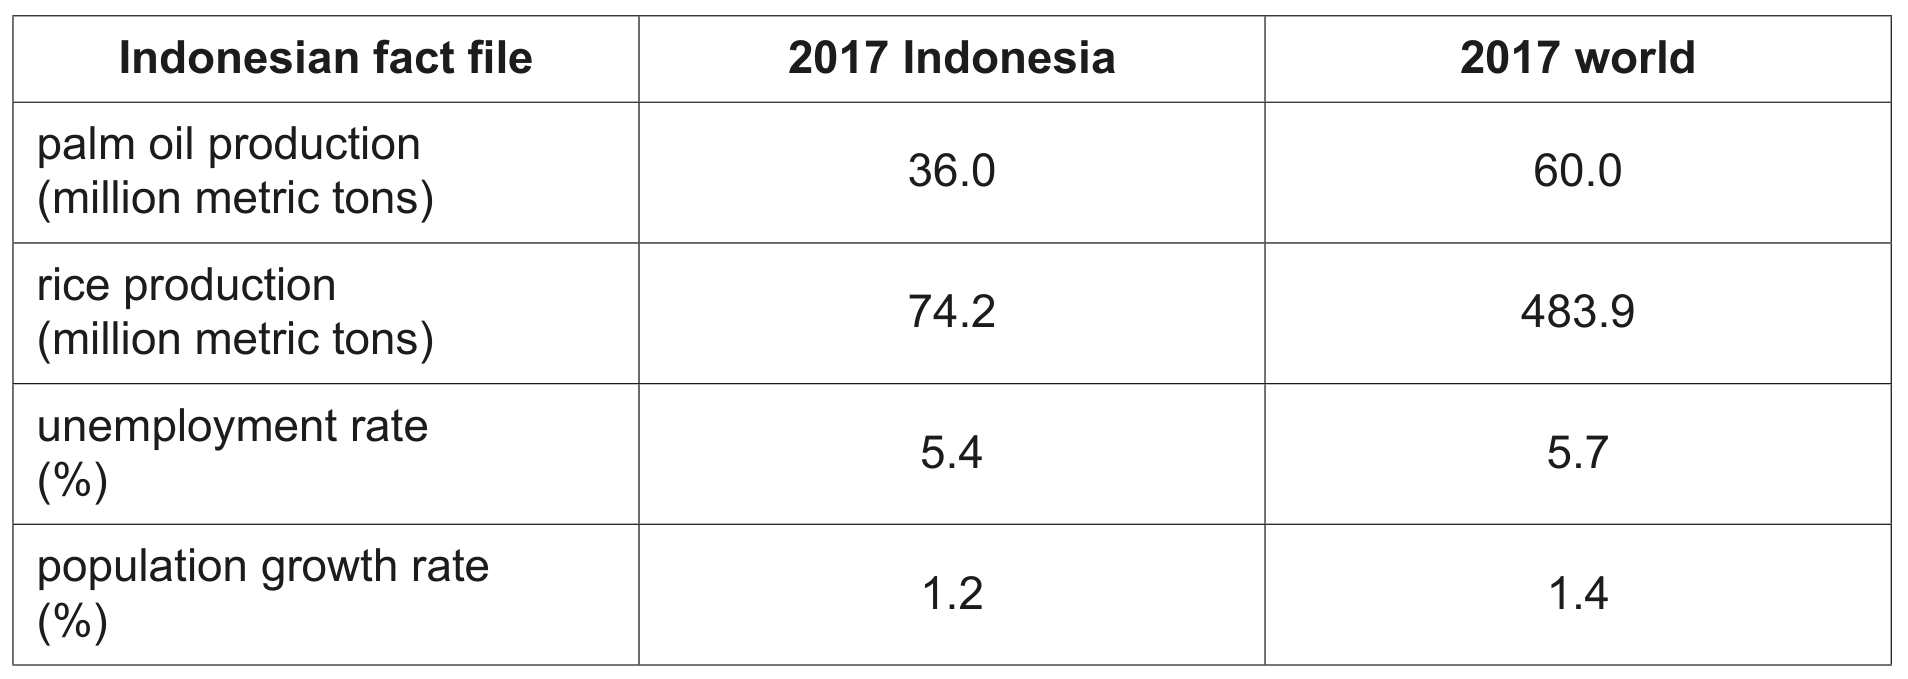
Indonesia is the world's largest producer of palm oil. The costs involved in producing palm oil include rent of land, fertiliser, palm oil seeds, maintenance of irrigation systems and casual labour. Fires are set to clear forests to make way for palm oil plantations. These fires destroy the homes of many species of wildlife and release harmful gases into the air. Since 2011, Indonesia has been paid to conserve its forests by the Norwegian government.

While Indonesia is the largest producer of palm oil, it is the third largest producer of rice. Indonesia exports 85%85 \% of its palm oil but sometimes has to import rice to meet domestic demand. Its international trade in palm oil and rice is influenced by changes in its foreign exchange rate. The price of the Indonesian currency, the rupiah, fell in 2017.

Rice production also contributes to air pollution. Rice farmers burn the stubble left after harvesting to clear the fields and to raise the fertility of the land so they can produce more rice. Some environmentalists argue that stubble burning should be banned.

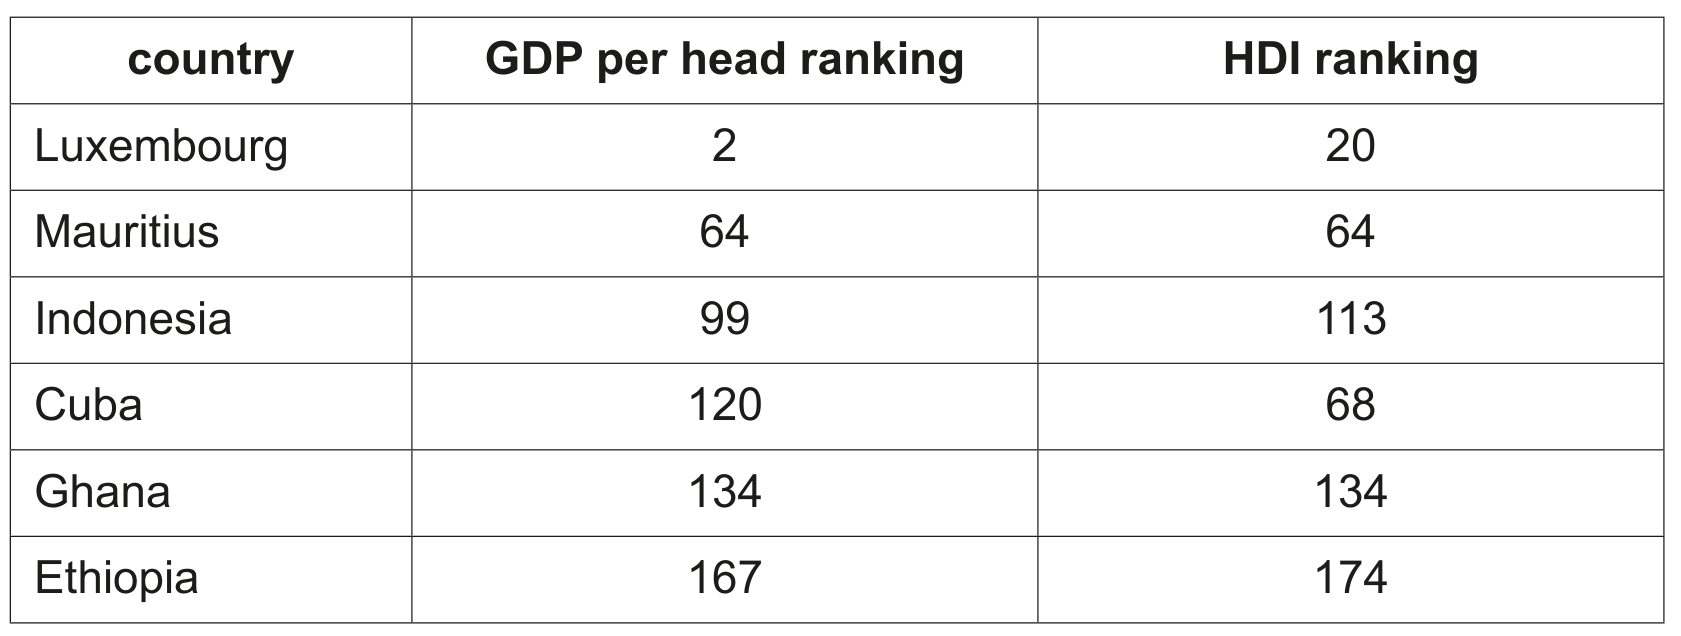
The Indonesian economy, along with the world economy, continues to grow. Economic growth can cause pollution. It can also affect a country's GDP per head ranking and Human Development Index (HDI) ranking as shown in Table 1.1.

Table 1.1 GDP per head ranking and HDI ranking for selected countries in 2016

Table 1.1 GDP per head ranking and HDI ranking for selected countries in 2016

Indonesia experiences net emigration. Some Indonesians work abroad and send money home to their families. People also come from abroad to work in Indonesia, some in relatively highly paid jobs in the country's expanding tourism industry. Indonesia currently attracts fewer tourists than its neighbours, Singapore and Malaysia. It does, however, have many natural tourist attractions and is currently price competitive.

Discuss whether or not the Indonesian tourism industry will increase in the future.

Answer any three questions.

Each question is introduced by stimulus material. In your answer you may refer to this material and/or to other examples that you have studied.

Question 1(b)

[Maximum number: 2]

Read the source material carefully before answering Question 1.

Source material: Bank mergers

Source material: Bank mergers

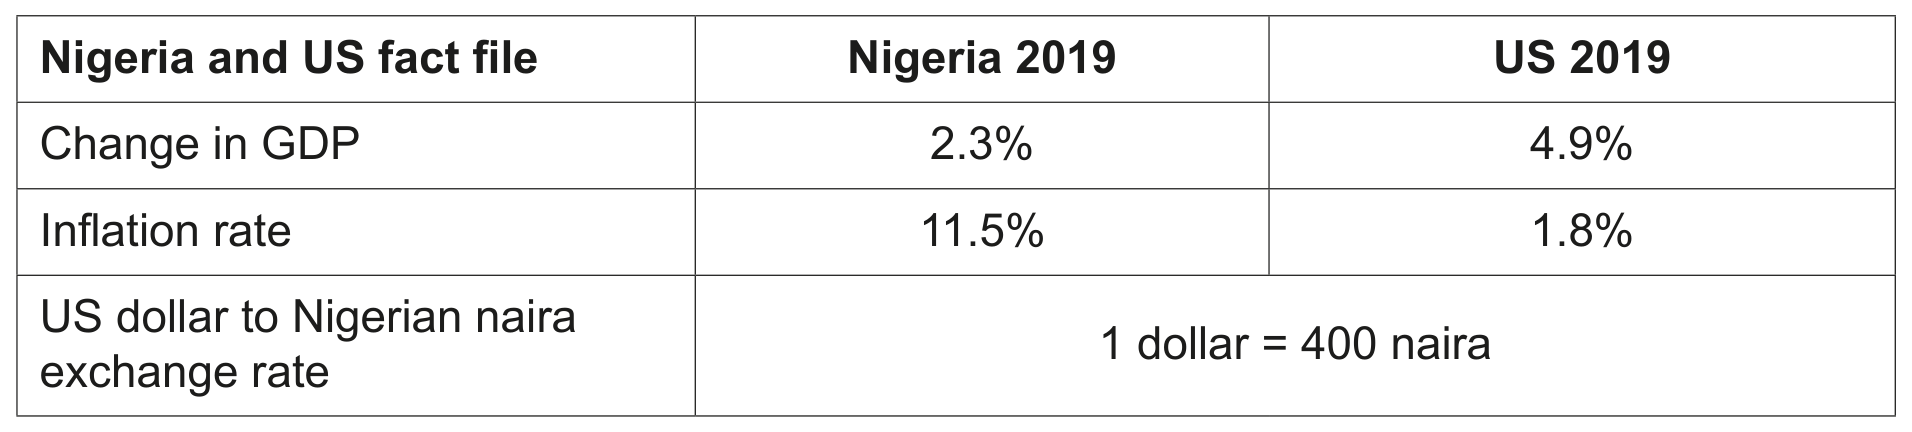
In 2019, there was a merger between three Nigerian commercial banks to form Nigeria's largest commercial bank. In 2019, two US commercial banks merged to form the US's 6th largest commercial bank. In the US, the three largest banks controlled 32%32 \% of the market. In the US and Nigeria, large banks have opened more branches, carried out advertising campaigns and improved online banking.

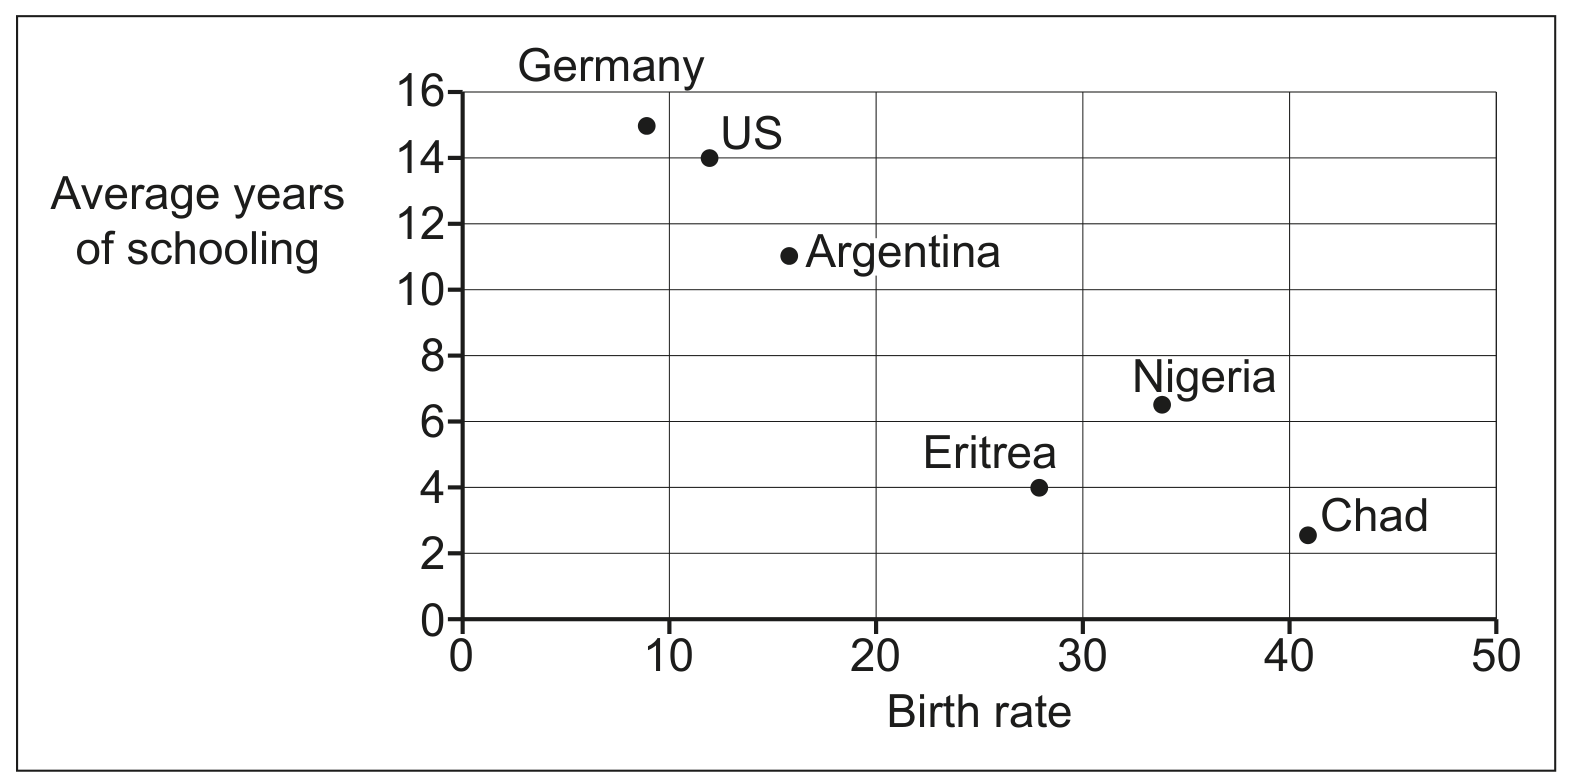
Bank mergers can result in some bank employees losing their jobs. Unemployment did rise in Nigeria in 2019. This is likely to have affected the government's budget as both government tax revenue and government spending will have changed. Most commercial bank workers are well-educated. The number of years of education people receive can affect a country's birth rate. Fig. 1.1 shows average years of schooling and the birth rate in selected countries in 2019.

Fig. 1.1 Average years of schooling and birth rate in selected countries 2019

Fig. 1.1 Average years of schooling and birth rate in selected countries 2019

Some households in both Nigeria and the US, who spend more than they earn, borrow from commercial banks. Some children in Nigeria, in low-income households, do not have enough to eat due to the high price of food. A government subsidy to farmers could be used to help low-income Nigerian households. The subsidy could also help to reduce the deficit on the current account of its balance of payments. This will depend on Nigeria's inflation rate compared with other countries and incomes at home and abroad.

In the US, nearly 35%35 \% of children are overweight. One cause of this is the consumption of high-sugar food and drinks. The US government could impose a minimum price on such products, including chocolate. A minimum price could move the market closer to where social benefit equals social cost. However, some consumers think it would be unfair and some firms think it would reduce profits. A minimum price may also impose a cost on the government and its success would be influenced by how high the minimum price is set.

Identify two ways a bank could increase demand for its services.

Question 1(e)

[Maximum number: 4]

Read the source material carefully before answering Question 1.

Source material: Changes in US macroeconomic performance and policies

Source material: Changes in US macroeconomic performance and policies

Between 2009 and 2019, US real GDP increased every year. This was the result of, among other causes, low interest rates, land reclamation and an increase in the labour force. The higher US output brought a number of benefits but some workers lost their jobs. This was because while some industries expanded, others closed down. Income also became more unevenly distributed and pollution increased.

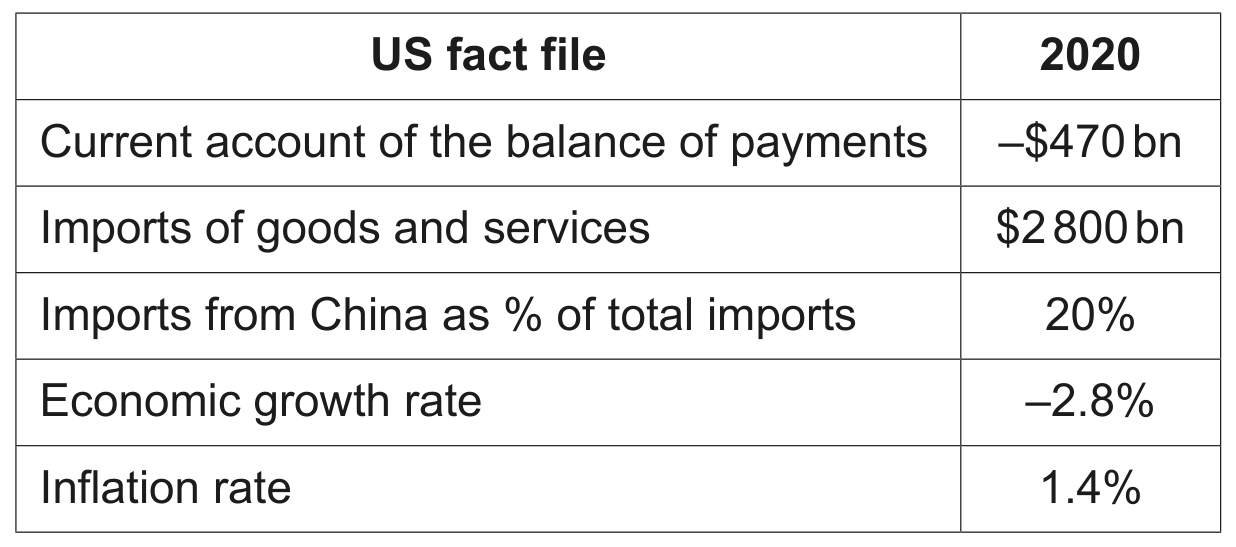
US exports and imports rose over this period. The growth of trade with China, a major trading partner of the US, was affected later in the period by increases in US tariffs on some Chinese imports. These increases were expected to change the US current account balance, output and tax revenue.

The US exports a range of products to China, including ice cream. China is the world's largest consumer of ice cream, buying a third of all ice cream consumed. Chinese consumers sometimes buy chocolate to eat with ice cream. In 2019, the price of chocolate increased.

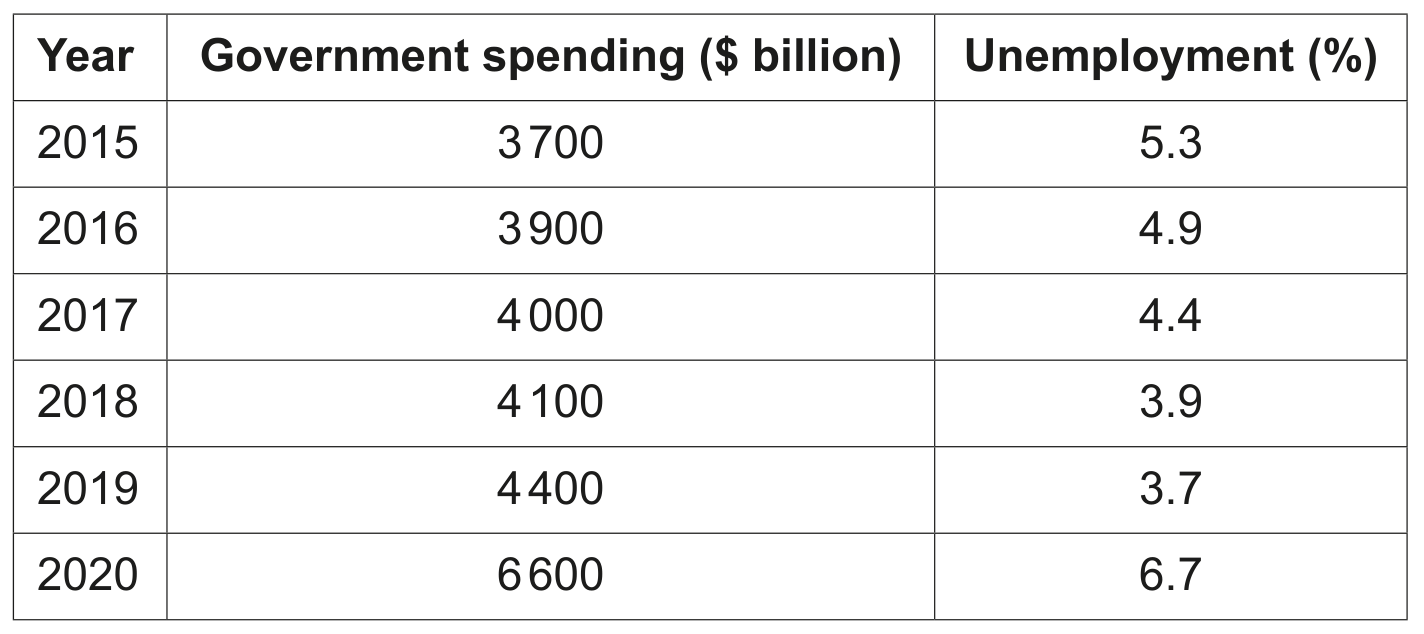
In 2020, US macroeconomic performance changed. The country's price level rose more slowly, largely due to a decrease in consumer expenditure and a reduction in workers' bargaining power. The country's real GDP fell and unemployment rose. These changes influenced US macroeconomic policy. US government spending rose significantly as shown in Table 1.1.

Table 1.1 US Government spending and unemployment rate 2015-2020

Table 1.1 US Government spending and unemployment rate 2015-2020

The US central bank, the Federal Reserve, announced in September 2010 that it would allow the inflation rate to rise and would not increase the interest rate. In the past, central banks have aimed to keep the inflation rate low because of the effects that inflation can have on, for example, investment, exports, the distribution of income and tax revenue. The Federal Reserve stated that it wanted to raise economic growth which can increase income per head, employment and tax revenue.

Draw a demand and supply diagram to show the effect of an increase in the price of a complement on the market for ice cream.

Question 1(b)

[Maximum number: 2]

Read the source material carefully before answering Question 1.
Source material: Is there a future for Australian coal?

Table

Australia is a major producer of coal. Most coal is used to produce electricity. In this process, carbon dioxide is emitted. Global demand for coal has declined in recent years as countries have tried to reduce pollution. There has been a switch to, for example, gas, offshore wind and solar power.

Coal is mined in each of Australia's six states but most is mined in Queensland and in New South Wales. In Queensland, some of the firms are very large. These firms employ both low-paid, unskilled workers and high-paid, specialist mining engineers, site managers and accountants. The firms use the latest excavators, mining drills, crushing equipment, earth movers and drones to detect maintenance issues.

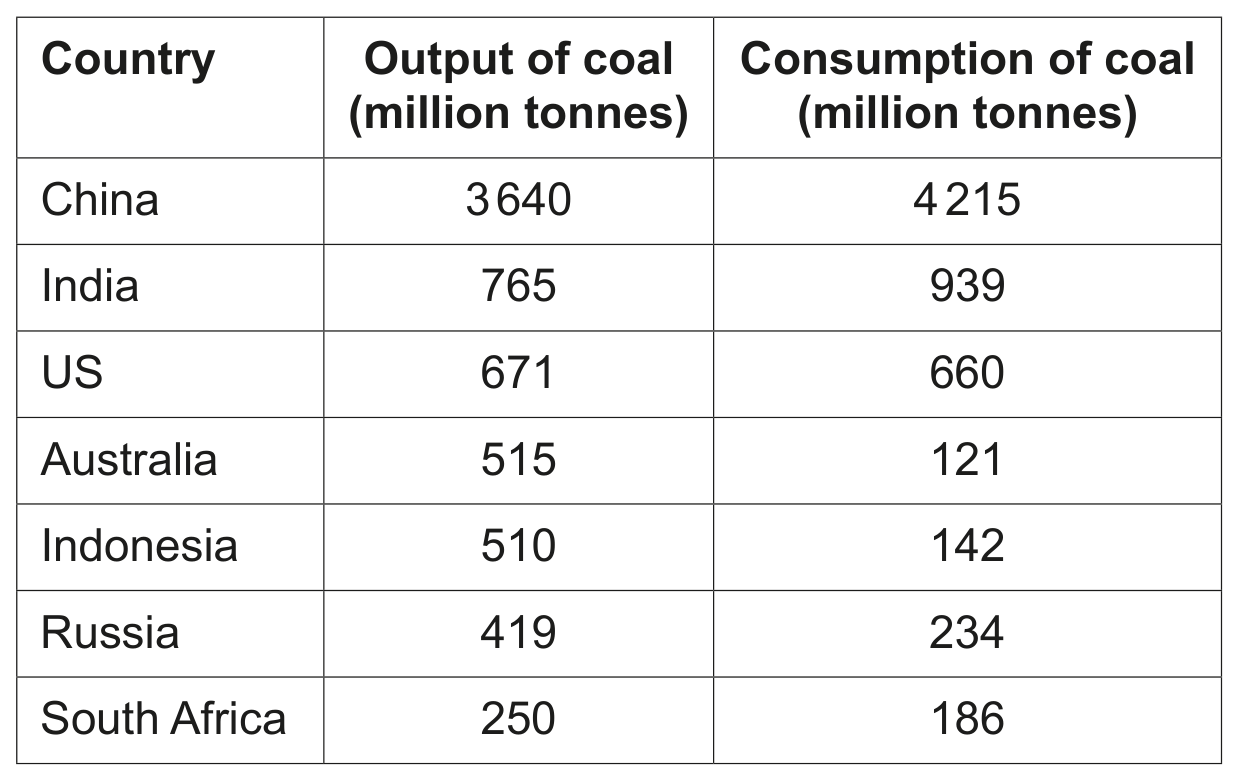
Coal can be stored to meet changes in market conditions but storage costs can be high. It can also take years to construct a new coal mine. Table 1.1 shows the output and consumption of the seven largest producers in 2020.

Table 1.1 The output and consumption of the seven largest producing countries 2020

Table 1.1 The output and consumption of the seven largest producing countries 2020

Global coal production has fallen in recent years with most countries switching to renewable sources of energy. However, there are some countries where coal production is set to increase. There are plans in both Australia and India, for example, to open new coal mines. The Indonesian government sets a maximum price on coal to encourage the country's power stations to use it.

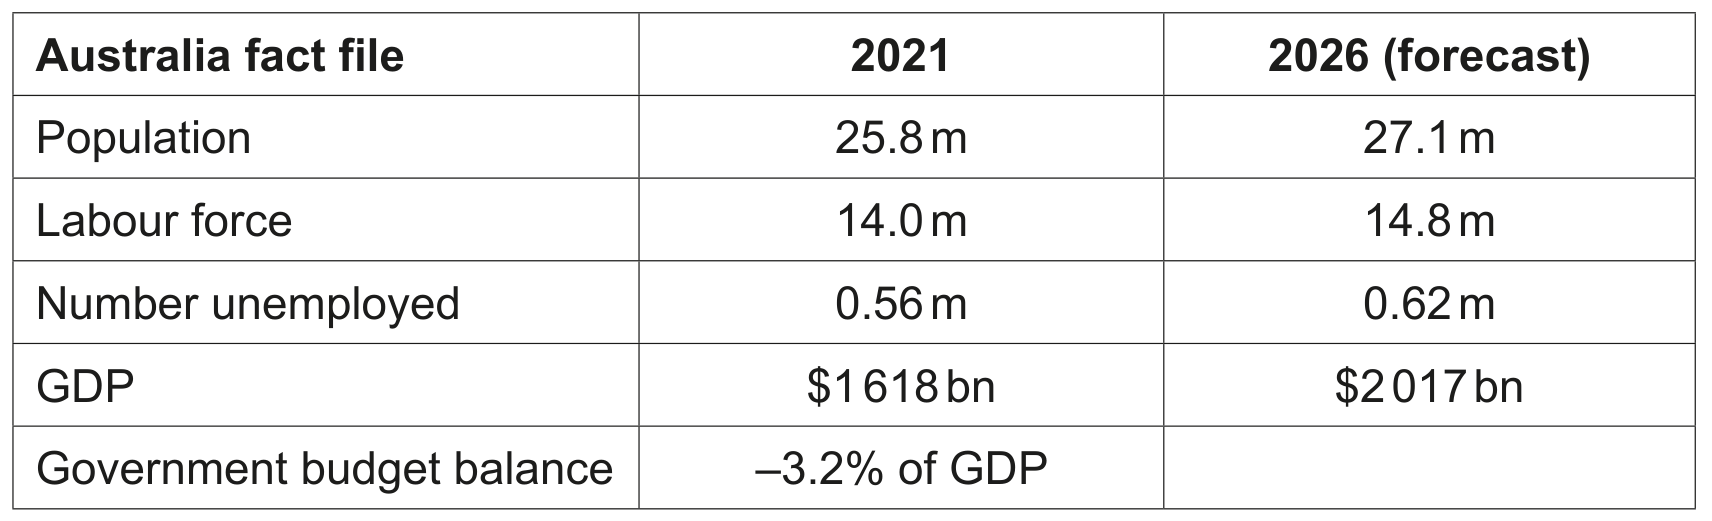
The Australian coal industry contributes to its government's tax revenue. There are, however, other influences on Australia's government's budget balance including changes in tax rates and state support for some of the country's industries.

Identify two substitutes for coal.

Question 1(e)

[Maximum number: 4]

Read the source material carefully before answering Question 1.
Source material: How will oil change Guyana?

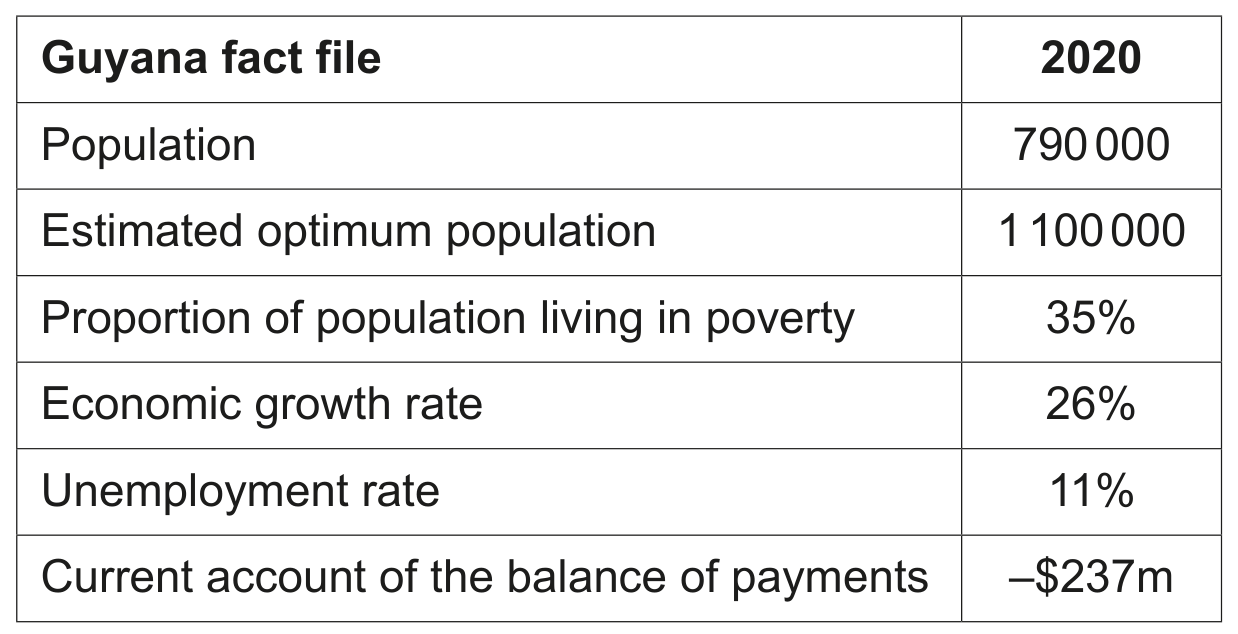
Table

Guyana was the fastest growing economy in the world in 2020. Sugar, gold and timber have accounted for a relatively high proportion of the country's output and exports for some time. In 2020, the sugar industry was hit by bad weather and falling global demand. In contrast, the output of gold and timber increased.

The main reason why Guyana's real GDP increased so rapidly was the increase in oil production. Oil was discovered offshore by a foreign multinational company (MNC) in 2015 and the MNC started production in 2019. It is predicted that Guyana will become the world's largest oil producer per head by 2025 .

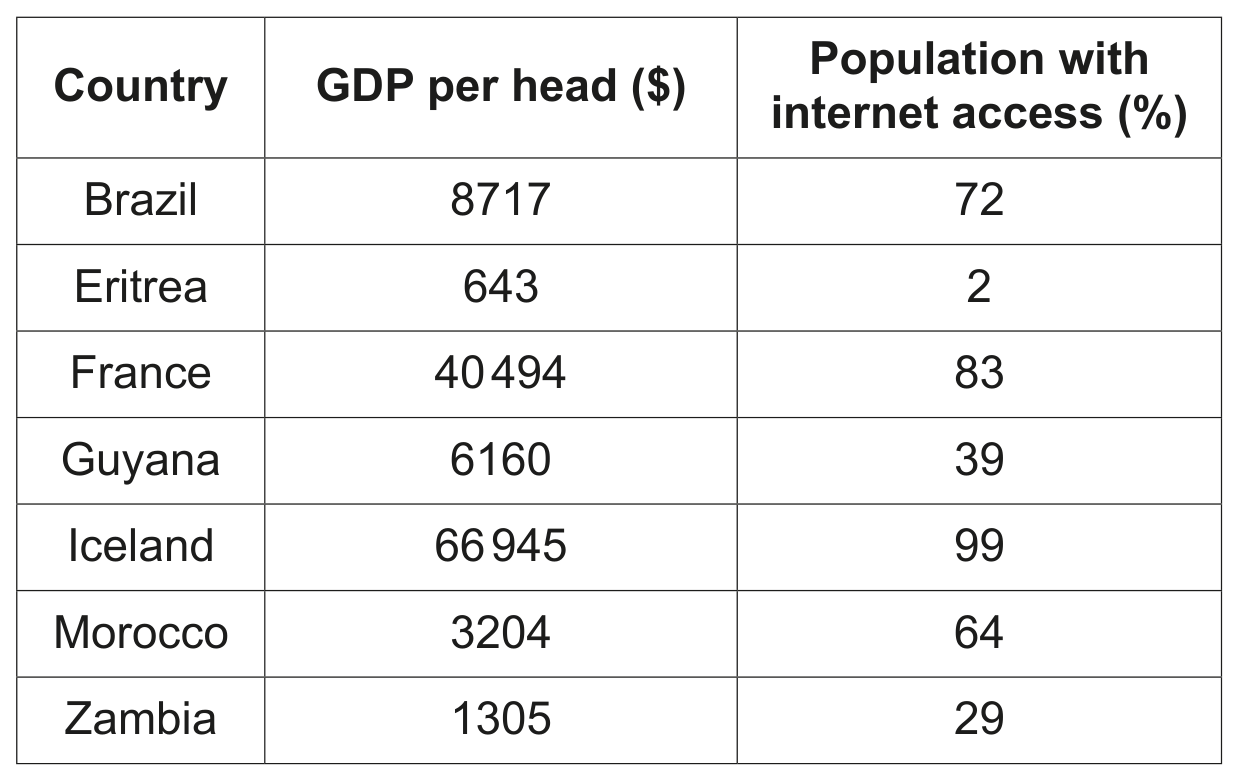
The Guyanese government is planning to use some of the tax revenue it will raise from oil to spend on education and improvements to the country's infrastructure. Planned projects include new railway lines and stations. A more extensive and cheaper rail service may enable more people to work further from home and may influence the market for substitutes, such as car transport. The Guyanese government is also planning to spend some of the tax revenue on improving the country's access to the internet. Table 1.1 shows GDP per head and internet access in seven countries in 2020.

Table 1.1 GDP per head and internet access in selected countries in 2020

Table 1.1 GDP per head and internet access in selected countries in 2020

Guyana has experienced a slow growth in its population size in recent years. In 2020, its birth rate was 16.5 , its death rate was 6.8 and its net migration rate was -7.7 . With increases in oil production, emigration may decline and the country may start to experience net immigration. A higher population may affect Guyana in a number of ways including changing the size of its labour force and affecting the environment.

Draw a demand and supply diagram to show the effect of a decrease in the price of rail transport on the market for car transport.

Question 1(e)

[Maximum number: 4]

Read the source material carefully before answering Question 1.

Source material: New Zealand's aim for carbon-neutrality

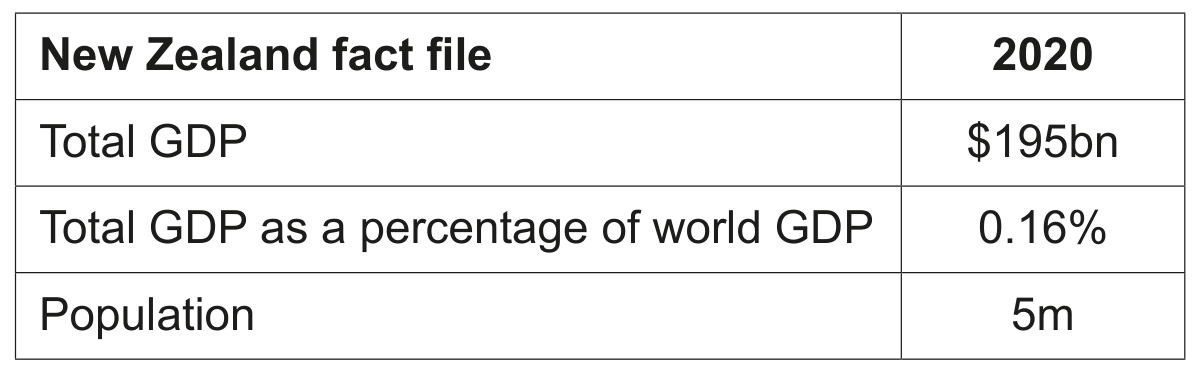
Table

New Zealand is a relatively small economy that intends to be carbon-neutral by the year 2050. Carbon-neutrality is when a country removes the same amount of carbon dioxide from the environment as it emits or simply eliminating carbon dioxide emissions altogether.

There are now various plans in place to reduce external costs in industries such as the milk and car industries. Both industries are major contributors to air pollution and the milk industry damages the environment where many wild animals live. The government intends to end imports of petrol-powered cars by 2032 and also limit the number of cows that each farmer can keep. However, good substitutes will need to be found to achieve these targets. Consumers will want a cheaper substitute for petrol-powered cars and farmers will need a different source of revenue than cows.

The success of the government plans will be important for New Zealand's macroeconomic performance. New Zealand exporters rely on a clean and green brand image, and this will help economic growth and reduce the deficit on the current account of the balance of payments. However, not all firms will benefit from government plans to achieve carbon-neutrality and inflation rates may also increase.

A switch to a carbon-neutral economy could result in increased unemployment due to significant job losses in the coal, oil and gas industries. This could lead to increased poverty in certain communities and large losses in the firms that serve these communities. However, these changes may be temporary and an economy with a high mobility of factors of production could avoid such problems.

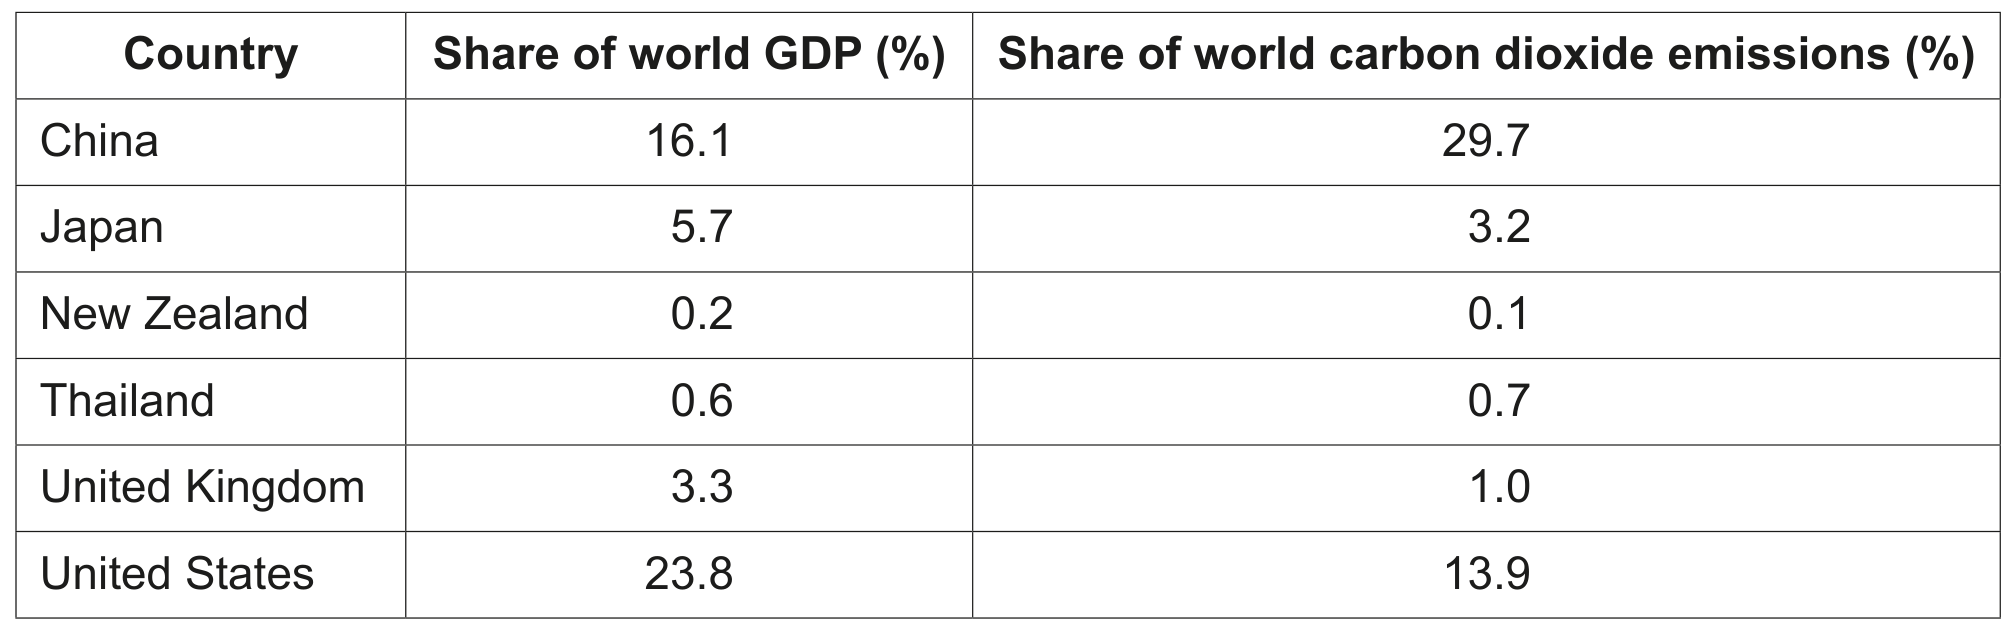
The good news is that New Zealand already has a low level of carbon dioxide emissions. However, not all countries can easily take the route New Zealand is planning to take. For selected countries, Table 1.1. shows their share of world GDP (\%) and their share of world carbon dioxide emissions (\%) in 2018.

Table 1.1 Share of world GDP (\%) and share of world carbon dioxide emissions (\%) in 2018 for selected countries

Table 1.1 Share of world GDP (\%) and share of world carbon dioxide emissions (\%) in 2018 for selected countries

Draw a demand and supply diagram to show the effect of a cheaper substitute on the market for petrol-powered cars.

Question 1

[Maximum number: 9]

Read the source material carefully before answering Question 1.

Source material: Labour shortages in Japan

Source material: Labour shortages in Japan

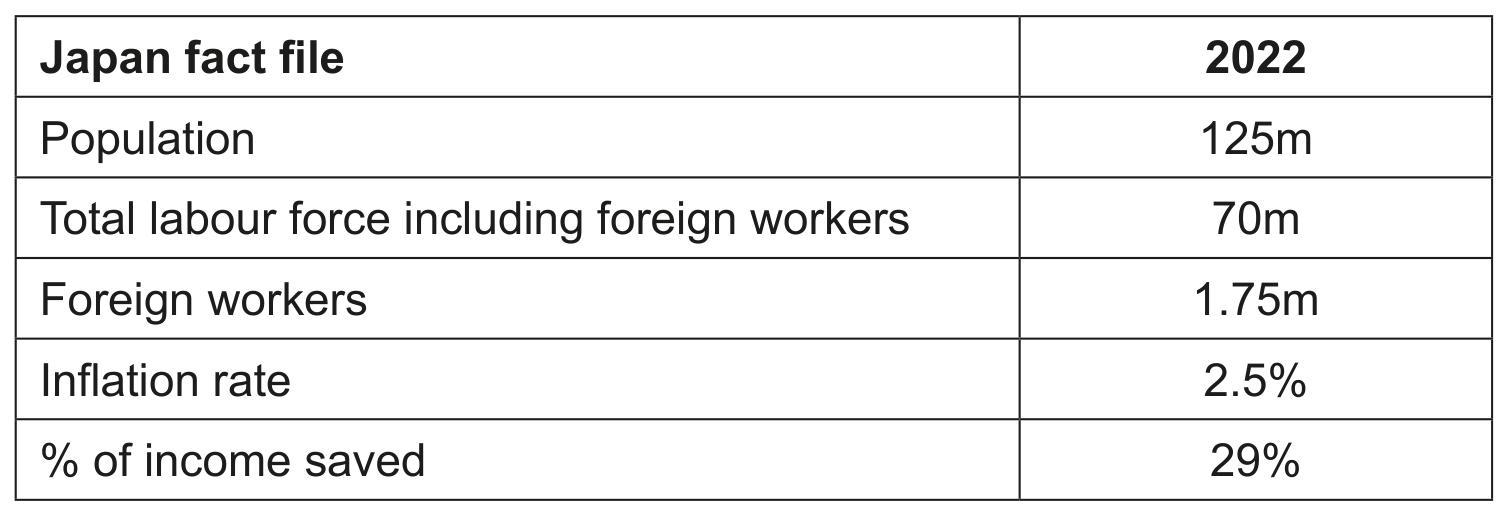
Japan has a high average age of population and a varied economic performance. It has a low birth rate, low inflation rate, good healthcare, high life expectancy and low unemployment rate. Fewer Japanese people enter the labour force each year. It is predicted that Japan's labour force will fall by 10 million by 2040. Many young Japanese people emigrate to Australia, Canada and the US in search of higher wages. However, Japan now experiences net immigration although foreign workers are currently only a small proportion of Japan's labour force.

To achieve an annual economic growth rate of 1.2%1.2 \%, it has been estimated that the number of foreign workers would have to increase to 7 million by 2040. Some foreign workers are discouraged from working in Japan due to the requirement to pass a Japanese language test. Only the most skilled are allowed to stay for more than 5 years and to bring their families with them.

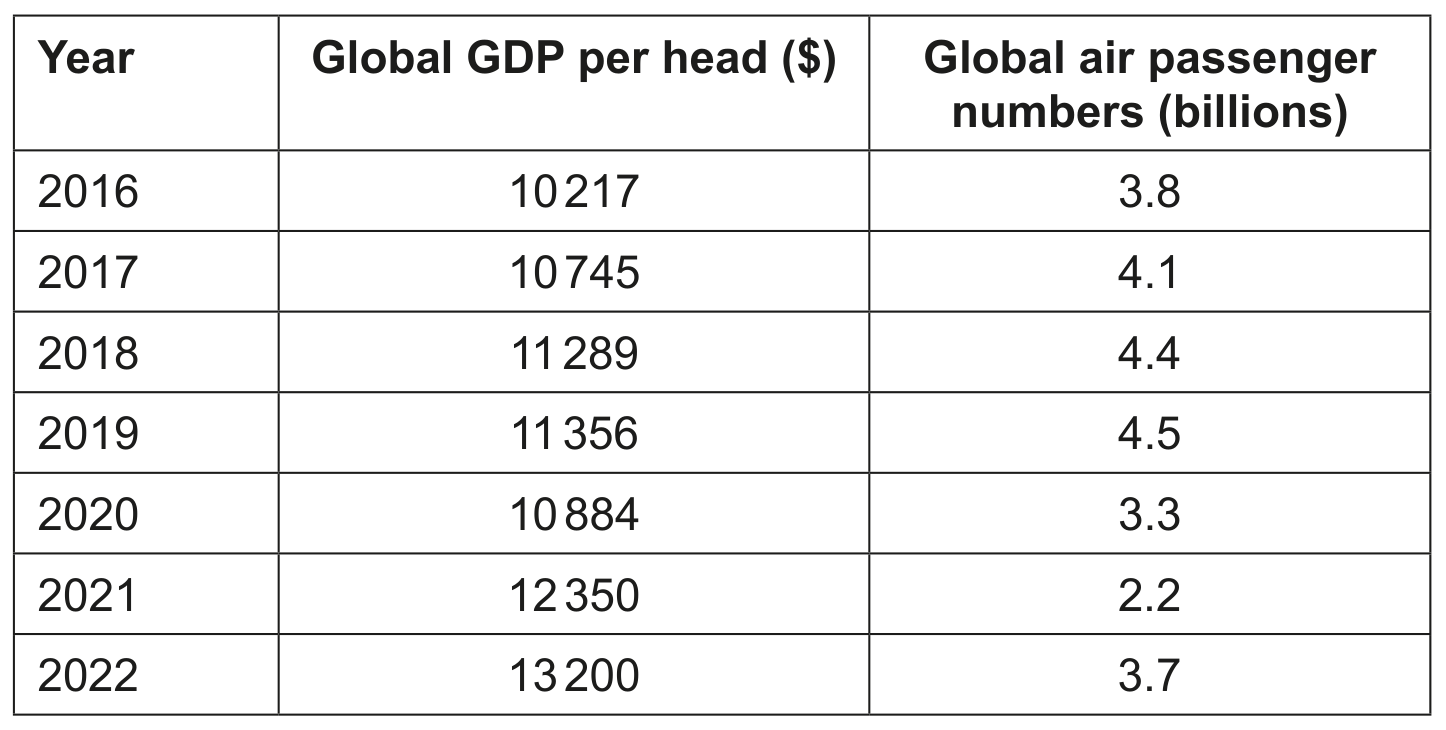
Many Japanese industries are affected by labour shortages and the country's decline in population. For example, the fall in population has affected the quantity of furniture traded. It has also influenced the country's air transport industry. Air travel is the most important method of transport in Japan for foreign travel and long-distance internal travel. Japan's air passenger numbers follow a similar pattern to global air passenger numbers. Table 1.1 shows global GDP per head and global air passenger numbers between 2016 and 2022.

Table 1.1 Global GDP per head and global air passenger numbers 2016-2022

Table 1.1 Global GDP per head and global air passenger numbers 2016-2022

Demand for goods and services, including air travel, is influenced by how much people save. Japanese people save a relatively high proportion of their income. This has affected the country's inflation rate, current account balance of the balance of payments and its economic growth rate.

Japan's macroeconomic performance is also influenced by the mobility of its labour force. There are several reasons why the mobility of Japan's labour force may change in the future. These include its ageing labour force and possible changes in education and training, house prices and the quality and price of transport.

Question 1(e)

(a)

Draw a demand and supply diagram to show the effect of a decrease in population on the market for furniture.

[ 4 ]

Question 1(f)

(b)

Analyse the relationship between global GDP per head and global air passenger numbers.

[ 5 ]

Question 1(f)

[Maximum number: 5]

Read the source material carefully before answering Question 1.

Source material: Changes in Jordan's economy and population

Source material: Changes in Jordan's economy and population

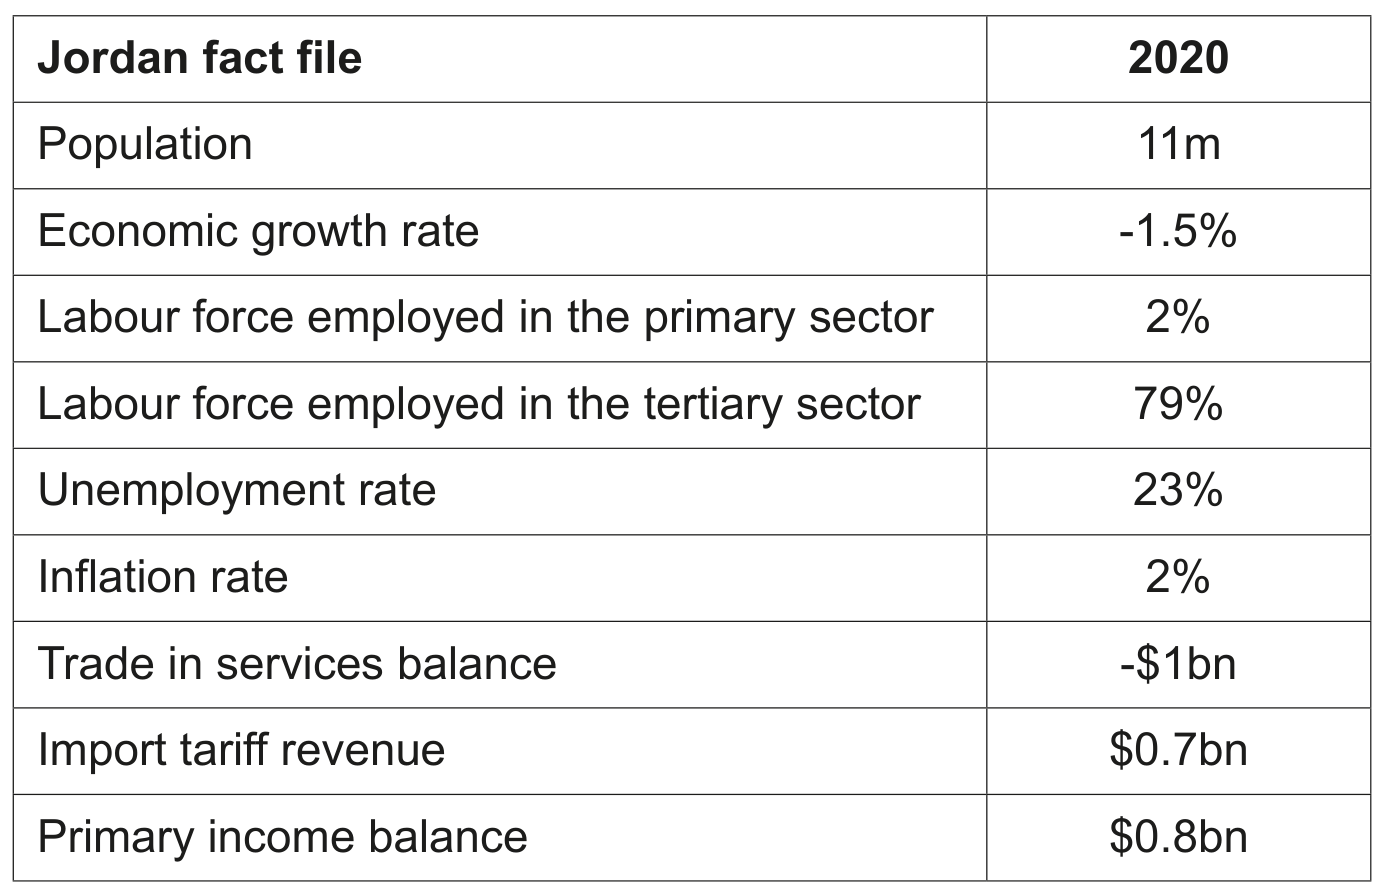
In 2020, Jordan had a deficit on the current account of its balance of payments. This deficit contributed to a decline in Jordan's total demand in that year. This lower total demand was the most important reason why the number of workers was greater than the number of jobs available. Employment fell in most of Jordan's industries.

One of Jordan's main industries is tourism. Recent years have seen mergers between some of Jordan's tourism firms. These mergers reduced the prices of some holidays and raised their quality.

Jordan's population continues to grow. This is mainly because of net immigration, but also because the country's birth rate exceeds its death rate. Table 1.1 shows the birth rate and average age in six countries in 2020.

Content removed due to copyright restrictions.

Changes in the size of a country's population affect the market for a range of products including clothing. An increase in population size also puts pressure on the country's sources of energy. The Jordanian government has several large renewable energy projects, and plans to spend even more on such projects. Greater reliance on renewable energy, including wind and solar power, can reduce environmental damage and can be relatively cheap in the long run. However, most renewable energy generators, including hydroelectric power stations, are expensive to build. Also, wind turbines and solar panels rely on favourable weather conditions.

Some of the spending by the Jordanian government is financed by borrowing. At the start of 2021, the Jordanian central bank was expected to raise the rate of interest. This was because total demand was predicted to increase and there would be a return to positive economic growth. A higher interest rate might affect Jordan's foreign exchange rate and investment.

Analyse, using a demand and supply diagram, how an increase in population size will affect the market for clothing.

0 selected