EduNinja

2.6 Elasticity of supply Topic Practice

2.6 Elasticity of supply Topic Practice
IB Economics syllabusEconomics SL/HLFirst assessment 2025

Students practise applying PES concepts to compare supply responsiveness across markets, calculate elasticities, and interpret diagrams showing price impacts.

Exam points

  • explain why primary commodity supply is less responsive to price changes than manufactured goods
  • calculate PES using %ΔQs ÷ %ΔP from data tables 2022 price change
  • use demand e.g., copper price surges when PNG’s supply cannot expand quickly

Question 1(b)(i)

[Maximum number: 2]

Read the extracts and answer the questions that follow.
Text A - Overview of the economy and government policies in Kenya

(1) Kenya, in East Africa, is achieving high annual economic growth rates, averaging above 5 %. Living standards are improving and employment is increasing in the manufacturing, tourism, construction and education sectors. Kenya's high growth is also changing the distribution of income and affecting the environment. However, climate change and high levels of inequality may reduce future growth rates.

(2) Floods and droughts are severe and frequent. In 2022-2023, droughts caused agricultural output to fall, affecting the employment of 40 % of the population and doubling the number of people with insufficient food. The government took measures to increase food supplies, such as reducing the tariff on imports of rice.

(3) The rising price of food is the main cause of inflation in Kenya. The central bank used a contractionary monetary policy in 2022 and 2023 to reduce inflation and to prevent the depreciation of the country's currency (Kenyan shilling, KES).

(4) The budget deficit as a percentage of gross domestic product (GDP) became smaller in 2023 because government expenditure grew more slowly than GDP. Moreover, economic growth resulted in higher tax revenue from both income tax and a 16 % indirect tax on goods and services. The government is also receiving revenue from the sale of some state-owned enterprises (SOEs). A World Bank programme, aimed at an expansion of "green" energy in Kenya, provides financial and technological support to the Kenya Power and Lighting Company, an SOE that has been making losses.

(5) The currency depreciation in 2022 boosted exports. Services, which are approximately 38 % of total exports and include tourism and financial services, are growing faster than exports of goods. Manufactured goods account for 37 % of total exports and agricultural goods account for 25 %. Revenue from exports of tea, flowers, vegetables, meat, and coffee are volatile and unpredictable. The droughts in 2022-2023 reduced output, which lowered export revenue from vegetables and flowers by almost 20 %.
Text B - Unequal distribution of the benefits of economic growth in Kenya

(1) Although economic growth has reduced absolute poverty, inequality remains a problem, particularly between the formal and informal sectors and between the urban and rural areas. Rural poverty is caused by low agricultural productivity and farmers' limited access to markets, finance, and technology.

(2) However, the level of education has improved significantly, with a literacy rate of over 90 %. Secondary school attendance rates have increased from 13 % in 2003 to 49 % in 2022, despite the costs of attending school. In 2022, the government introduced a fund (the Hustler Fund), partly financed by foreign aid. The fund provides low-interest loans to women, young people, and small firms, for education or investment.
Text C - Reducing and adapting to climate change in Kenya

(1) Global warming is affecting the Kenyan economy. Consequently, agricultural output and tourism, which account for 70 % of employment and most exports, will probably decline. Therefore, GDP could fall by 2 % annually. However, Kenya has relatively low carbon emissions, particularly because renewable resources generate 90 % of electricity, a figure that is planned to rise to 100 % by 2030.

(2) Measures taken by other economies to reduce carbon emissions provide opportunities for Kenya, because the markets for "green" goods are expanding. Kenya is able to sell tradable permits (carbon credits) to high-emitting countries due to its reforestation programmes. However, there are challenges for Kenya. The production of exports, such as coffee, needs to meet strict sustainability regulations imposed by the European Union (EU) on imports.

(3) The International Monetary Fund (IMF) recommends that climate-related considerations should be part of macroeconomic and infrastructure policies. It also recommends that carbon taxes should be imposed to reduce the use of fossil fuels by firms. Rapid urbanization is increasing the need for electric vehicles and improved public transport. Energy efficiency measures, fuel substitution, and switching to rail transport will not only lower transportation costs but also reduce the trade deficit. This is because fossil fuels used for transportation and manufacturing are imported.

(4) Kenya is able to obtain finance and technology for investment in climate-related projects, such as renewable energy and forestry programmes, through foreign aid and partnerships with the private sector. Overall, these policies will reduce environmental disasters and increase economic growth and jobs in the formal sector.

Table 1: Tea production in Kenya
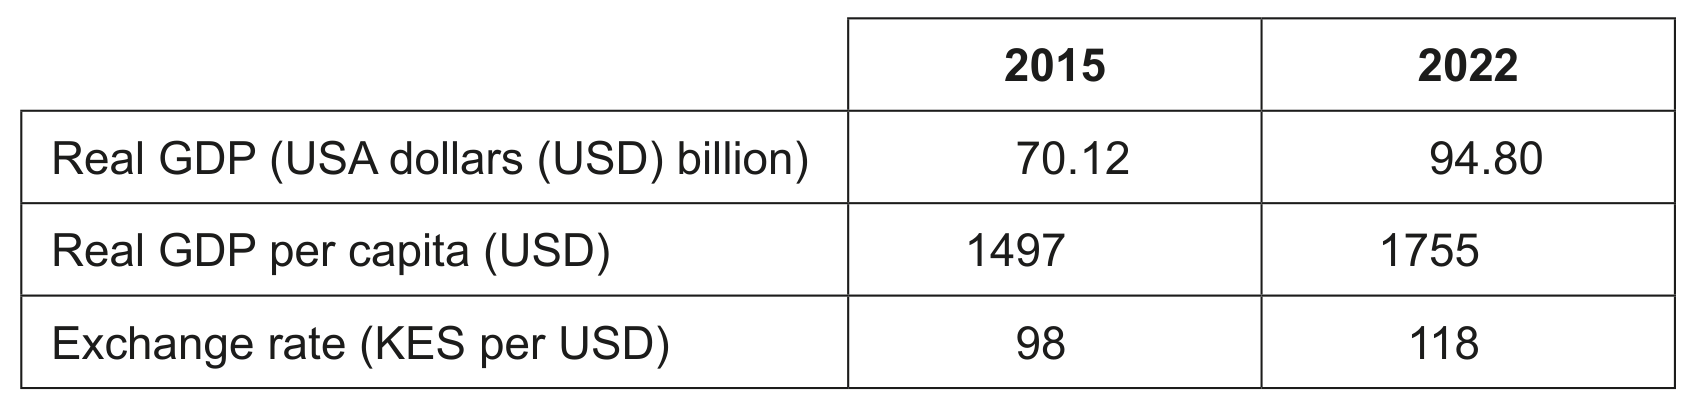
Table 1: Tea production in Kenya

Table 2: Economic data for Kenya
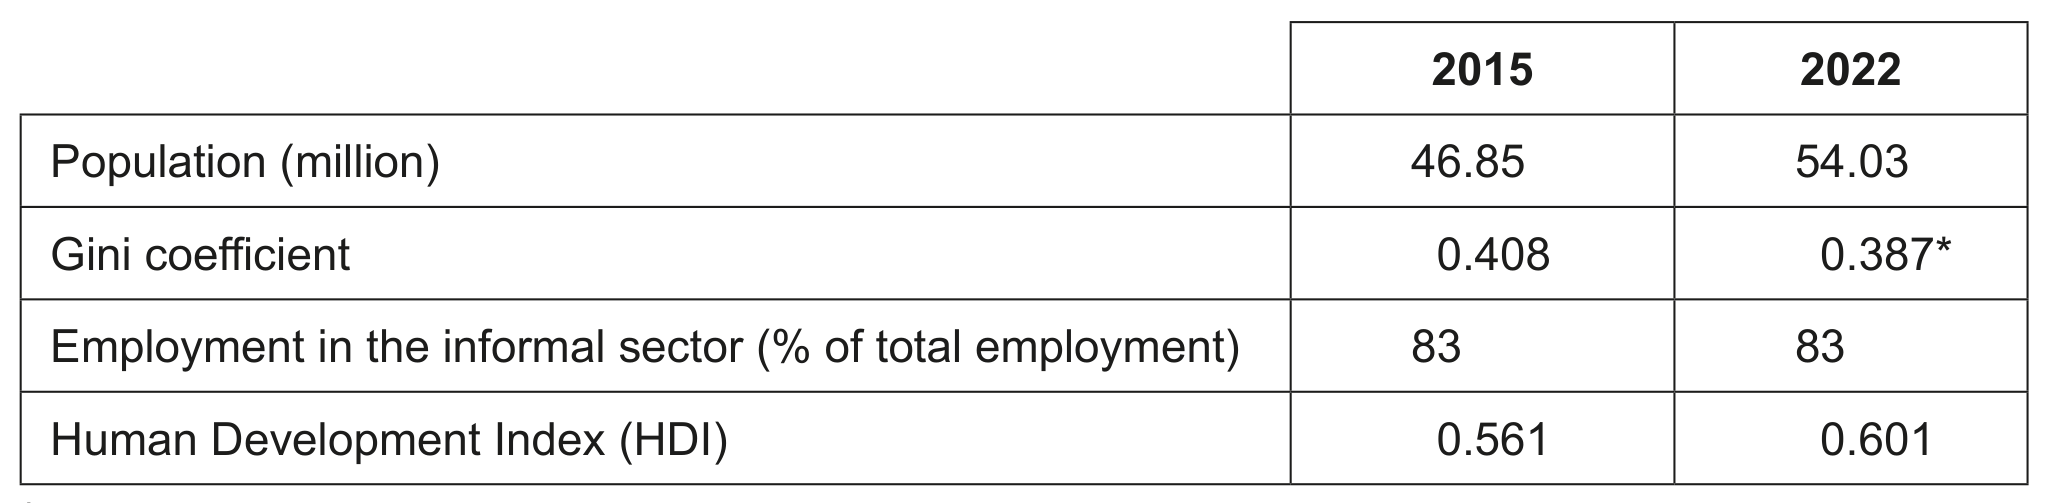
Table 2: Economic data for Kenya

Table 3: Development data for Kenya

Table 3: Development data for Kenya

\footnotetext{
*estimate
}

Using information from Table 1, calculate the price elasticity of supply for tea in Kenya when the price changes from 324 KES per kilogram (kg) in 2021 to 340 KES per kg in 2022.
Question 1(a)

[Maximum number: 10]

Explain why the price elasticity of supply (PES) for primary commodities is generally lower than the PES for manufactured products.

Question 1

[Maximum number: 6]

Note that widgets are an imaginary product.

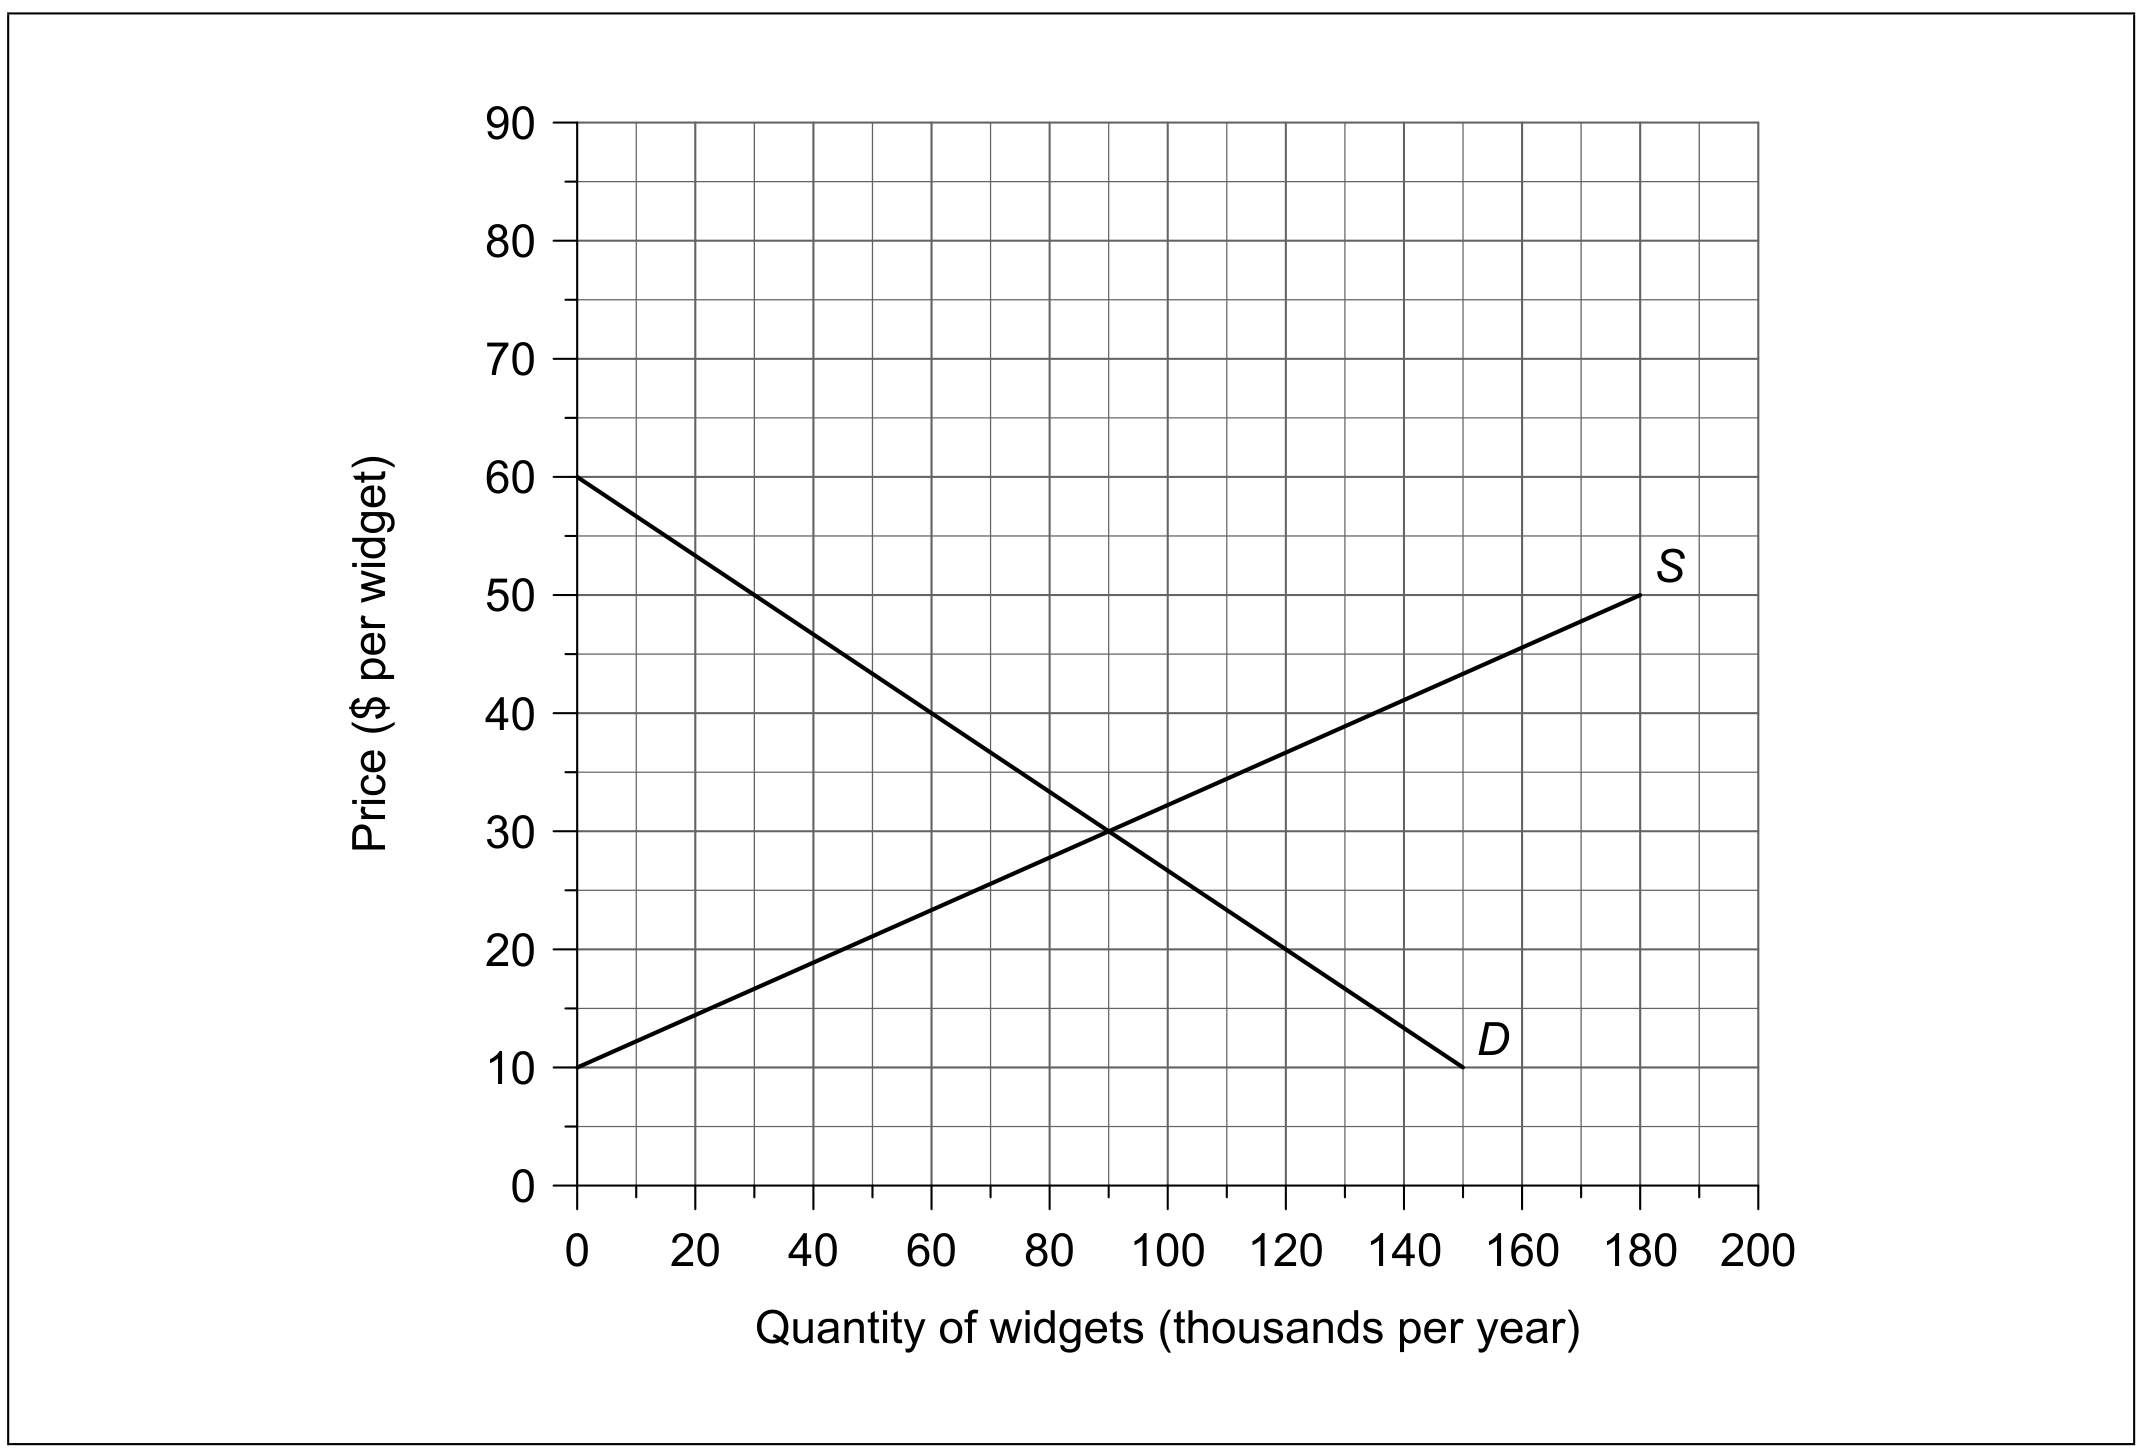
In Country X, the supply and demand for widgets are given by the functions

Qs=45+4.5PQd=1803P\begin{aligned} & Q s=-45+4.5 P \\ & Q d=180-3 P \end{aligned}

where P is the price per widget in dollars ($), Qs is the quantity of widgets supplied (thousands per year) and Q d is the quantity of widgets demanded (thousands per year).

The supply ( S ) and demand ( D ) functions are represented in Figure 1.

Figure 1

Figure 1

Question 1(f)

(a)

Define the term price elasticity of supply.

The time taken to produce goods is an important determinant of the price elasticity of supply.

[ 2 ]

Question 1(g)

(b)

Apart from time, explain two factors which influence the price elasticity of supply.

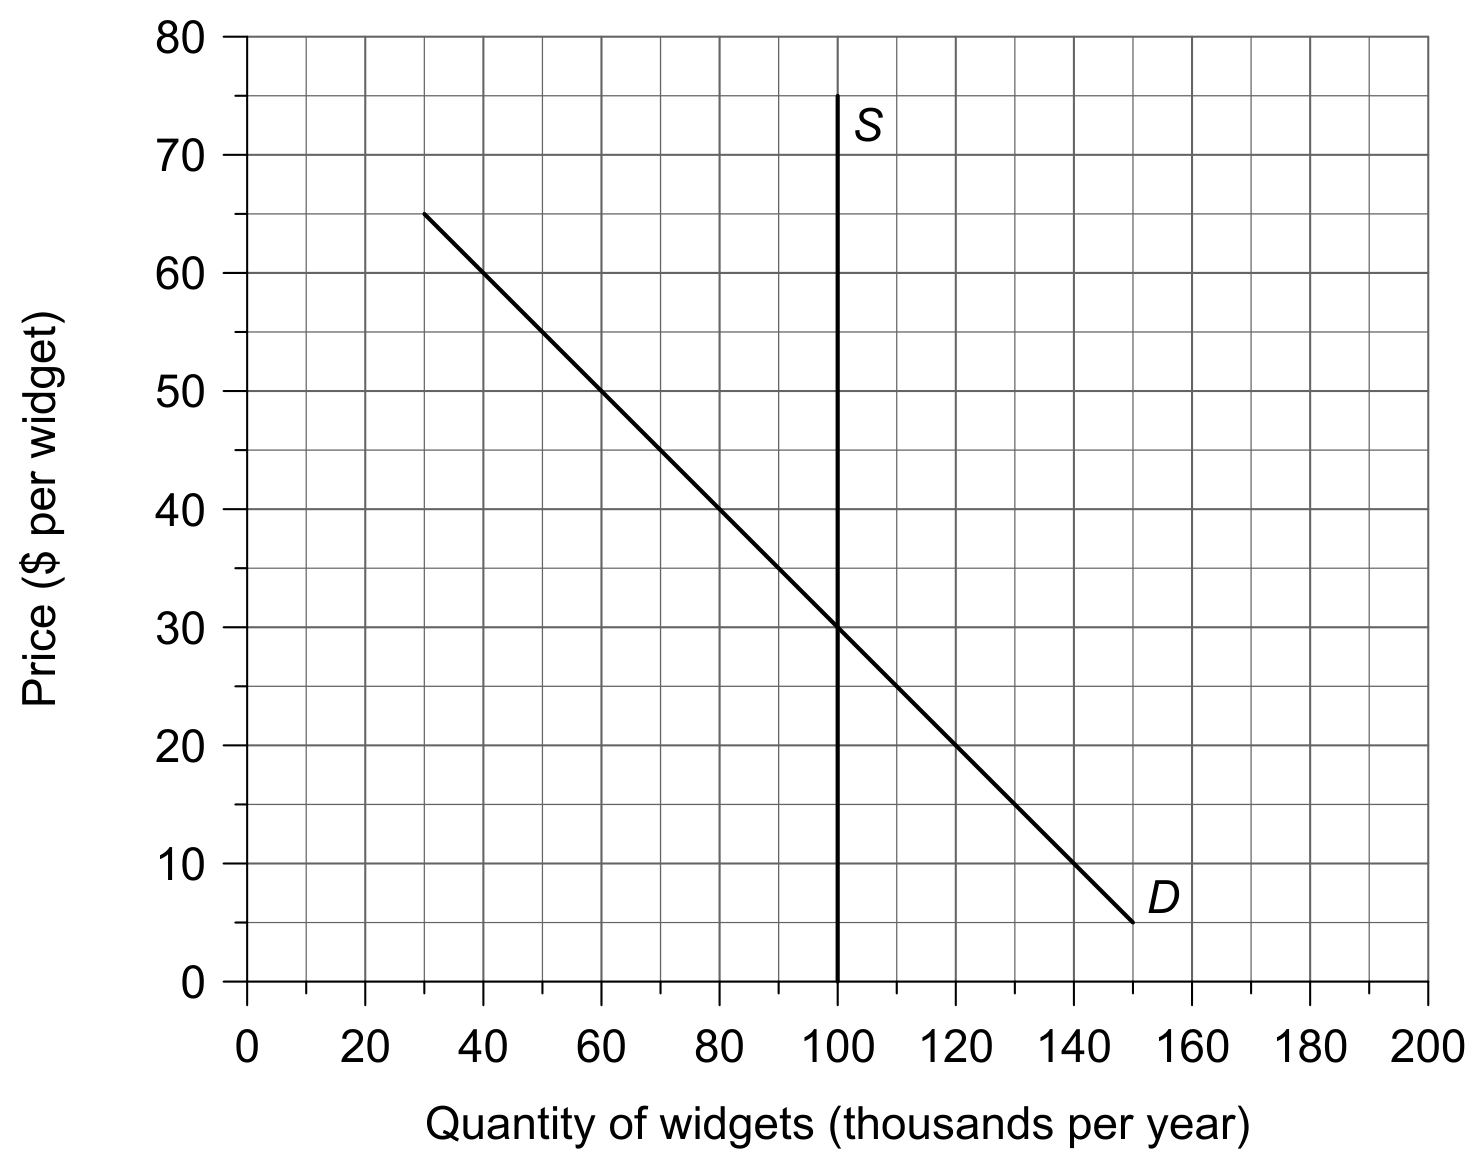
Figure 2 shows the demand for and supply of widgets in Country Y .

Figure 2

Figure 2

The government of Country Y decides to impose an indirect tax of $10 per widget.

[ 4 ]

Question 1

[Maximum number: 2]

Note that widgets and pidgets are imaginary products.

In the country of Burbia, the demand and supply of widgets are given by the functions

Qd=2494PQs=150+14P\begin{aligned} & Q d=249-4 P \\ & Q s=150+14 P \end{aligned}

where Qd is the quantity demanded per month, Qs is the quantity supplied per month and P is the price per widget in dollars ($).

Question 1(i)

(a)

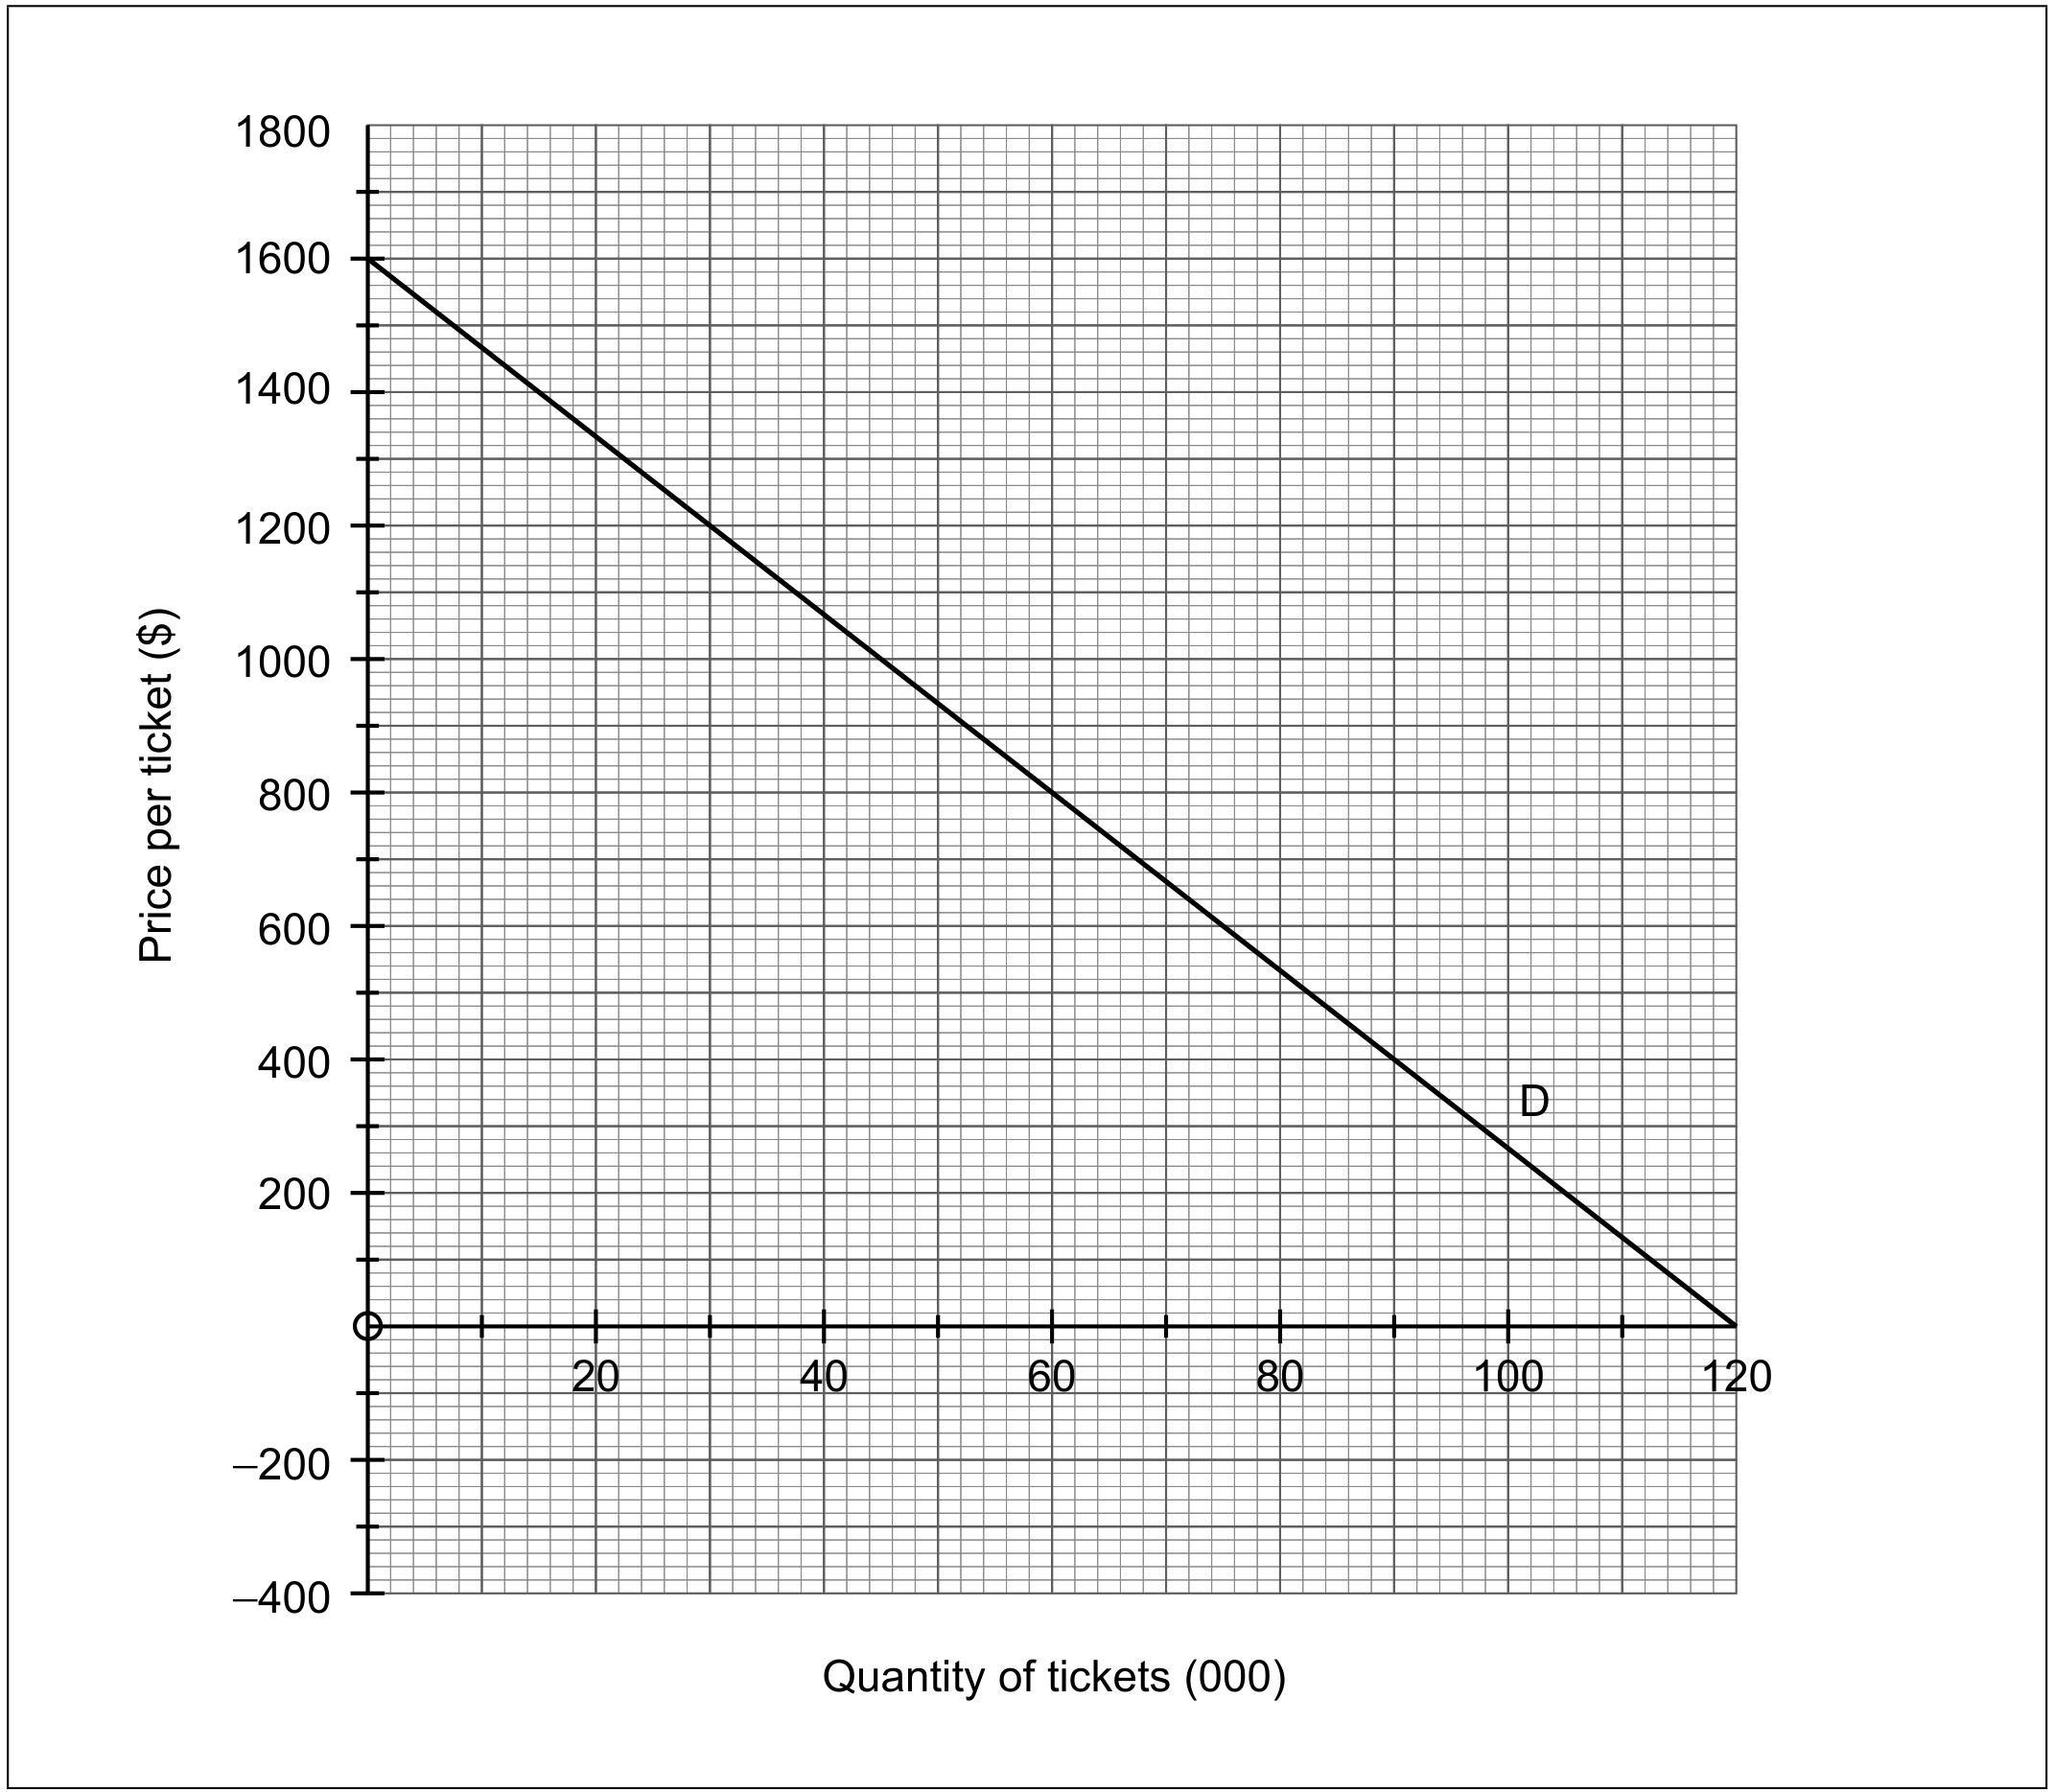
The final of the 2018 Football World Cup is expected to be held in the Luzhniki stadium, Moscow. The capacity of the stadium is 80000 . The expected cost of holding the final is US $ 12 million, which is not dependent on the number of people attending the match. All tickets will be sold for the same price.

Question image

State the value of the price elasticity of supply (PES) for tickets to the 2018 Football World Cup final.

[ 1 ]

Question 1(j)

(b)

In the diagram on page 6 draw and label the supply curve for tickets at the 2018 Football World Cup final.

[ 1 ]

Question 2(a)(v)

[Maximum number: 2]

Traffic congestion is a major problem in India. It is estimated that congestion in four major cities costs the Indian economy approximately US $ 22 billion annually. According to a 2019 survey, India has four of the eight most congested cities in the world. People in these cities pay higher fuel costs, inhale toxic gases, and waste up to 11 days a year stuck in traffic.

In New Delhi, India's capital city, 45 % of workers use cars to travel to work, while 89 % of workers indicate plans to purchase a car in the next five years. However, 80 % of car users say they would change their plans if ridesharing businesses such as Uber could meet their requirements on price, timeliness and availability.

Using Figure 2 and your answer to part (a)(ii), show that in the absence of indirect taxes the supply of petrol in New Delhi would be price inelastic.

Question 2(c)

[Maximum number: 4]

Read the extracts and answer the questions that follow.
Text D - Overview of Papua New Guinea

(1) Papua New Guinea (PNG) consists of hundreds of small islands near Australia. Over 50 % of the labour force is employed in agriculture, forestry and fishing. The extraction sector, which mines non-renewable minerals (gold and copper) and extracts energy products (oil and gas), provides 30 % of the gross domestic product (GDP). The mining operations, usually carried out by foreign-owned firms, sometimes cause environmental damage and disputes over land rights.

(2) The lack of substitutes and the difficulty of extracting gold, copper and gas cause both global demand and supply to be price inelastic. Consequently, changes in global demand result in volatile prices, which lead to macroeconomic instability because the extraction sector in PNG is so large. Fiscal policies have been unable to reduce the business cycle fluctuations. Tax revenue has declined as a percentage of GDP partly due to lower commodity prices and thus business tax revenue. The government could get more revenue from the extraction sector through ownership or part-ownership of the firms. Alternatively, taxes on the use of natural resources or higher business taxes could be imposed. However, such revenues are unpredictable and probably unsustainable.

(3) After the rapid depreciation of the Papua New Guinea kina (PGK), PNG's currency, between 2012 and 2015, the central bank moved away from a floating exchange rate system to a managed exchange rate system. It used reserve assets in the foreign exchange market to prevent excessive currency depreciation, thereby lowering cost-push inflationary pressures. However, this intervention caused the PGK to become an overvalued currency. Therefore, the International Monetary Fund (IMF) recommended less intervention in the foreign exchange market so the PGK would gradually depreciate.

(4) Official development assistance (ODA) is providing funds and technical assistance to improve infrastructure and therefore assist economic growth, which is one of the objectives of aid. The other two objectives are promoting effective governance and improving health and education. The World Bank's aid programme provides advice and funds for investment in human capital, especially for women and children's education. The government provides subsidies for schools, but they are inadequate, and government spending per student has declined due to the growing population. Many women work in the informal sector where they earn lower wages, contributing to rising gender inequality in PNG.

(5) The IMF's aid is in the form of loans at low interest rates. Its programme aims to support growth that also benefits women and minorities, while improving the management of government (national) debt. It sets performance criteria, including reductions in the government's budget deficit.

(6) There is criticism that too much aid is for improving governance and more should be allocated to infrastructure, including transportation networks, water, sanitation and electricity, which is accessible to only 21 % of the population.
Text E - Papua New Guinea's balance of trade

(1) The surplus on PNG's balance of trade in goods is due to the extraction sector, which earns 90 % of its export revenues. Less than 10 % of export revenues come from agriculture, forestry and fishing, although these sectors employ more people. Studies show that PNG exports have a high income elasticity of demand (YED =+3.0 ), but price elasticities of demand are low, particularly for mineral exports such as copper (PED =-0.18 ).

(2) PNG has relatively low tariffs on most imports. However, tariffs on manufactured items, including machinery for palm oil production, were increased in 2019 to protect local manufacturing companies.
Text F - Foreign direct investment and Papua New Guinea

(1) The capital and financial accounts on the balance of payments have large deficits. The outflows are mainly due to the repayment of loans that were used to develop the extraction sector. Most inward foreign direct investment (FDI) has been for mining and energy extraction projects. The FDI inflows fall once the project is completed.

(2) FDI into other sectors is low due to regulations and inadequate infrastructure. The regulations limit certain economic activities and restrict land purchases to PNG citizens and state-owned enterprises. However, increased competition from foreign firms could raise efficiency in some industries.

(3) PNG is setting up special economic zones in certain regions, which provide tax exemptions and eased regulations. The aim is to encourage FDI into tourism and industries that process agricultural and fishing products. Aid agencies recommend using FDI for renewable energy and environmental projects.

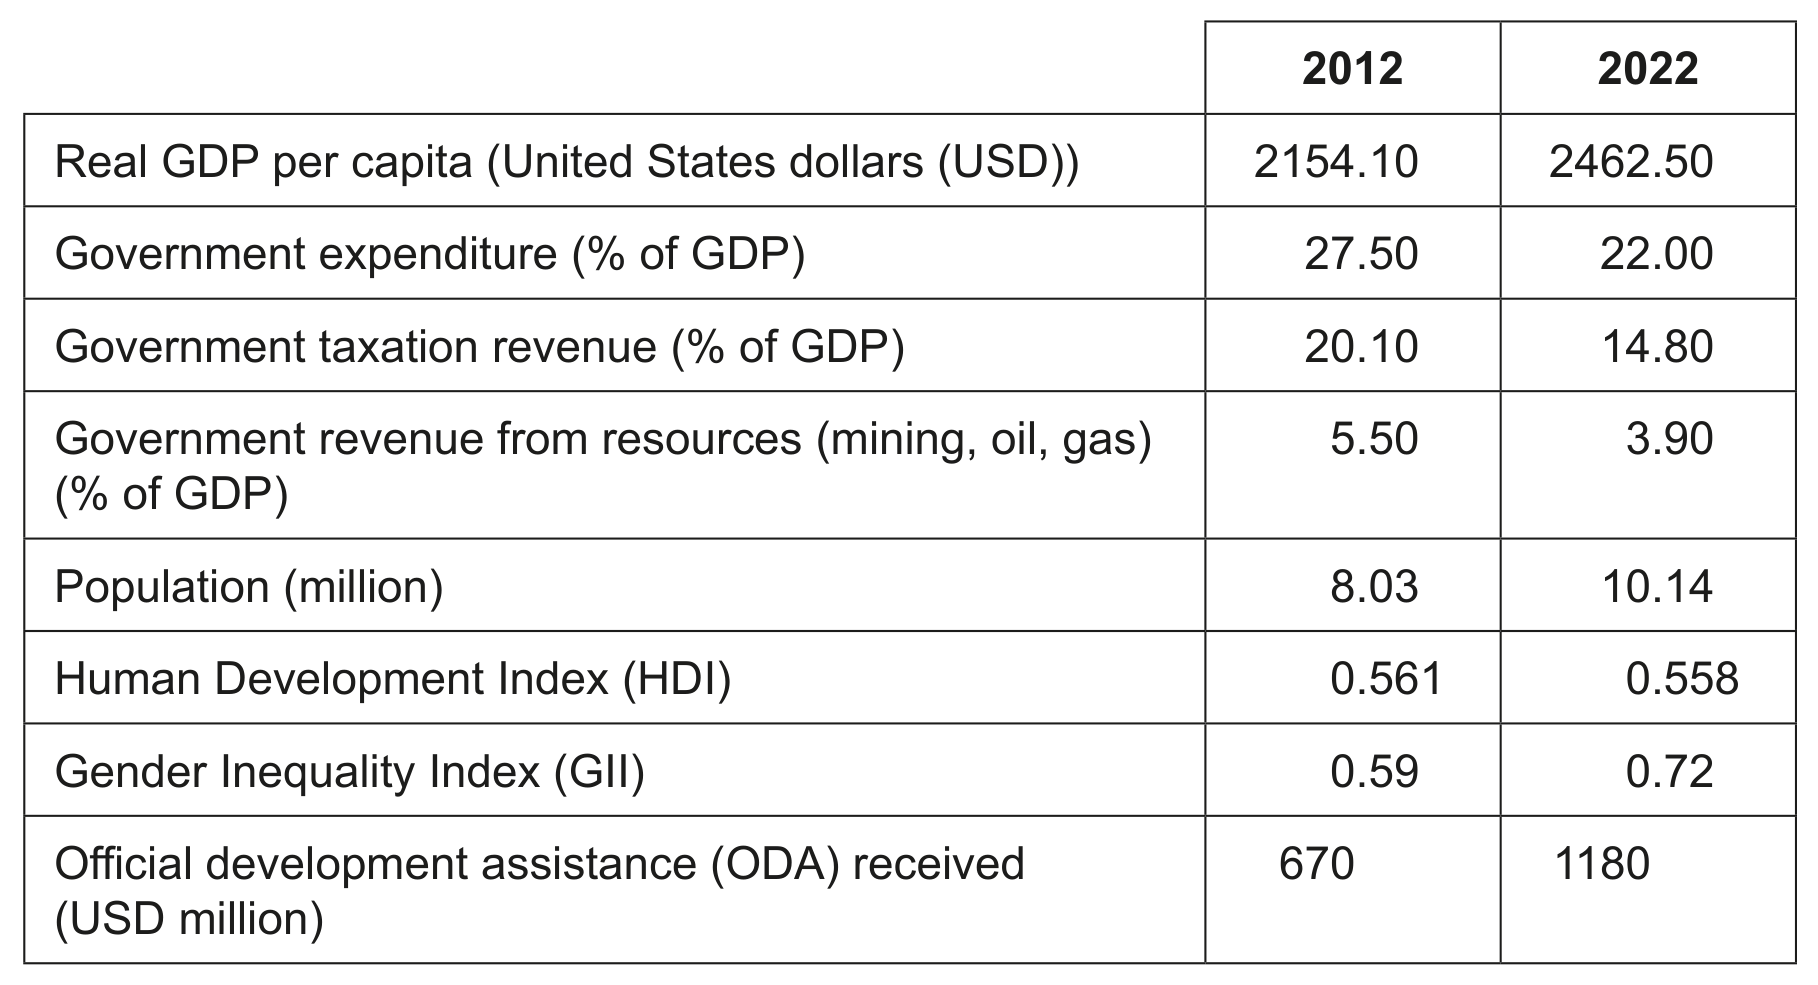
Table 4: Economic and development data for Papua New Guinea

Table 4: Economic and development data for Papua New Guinea

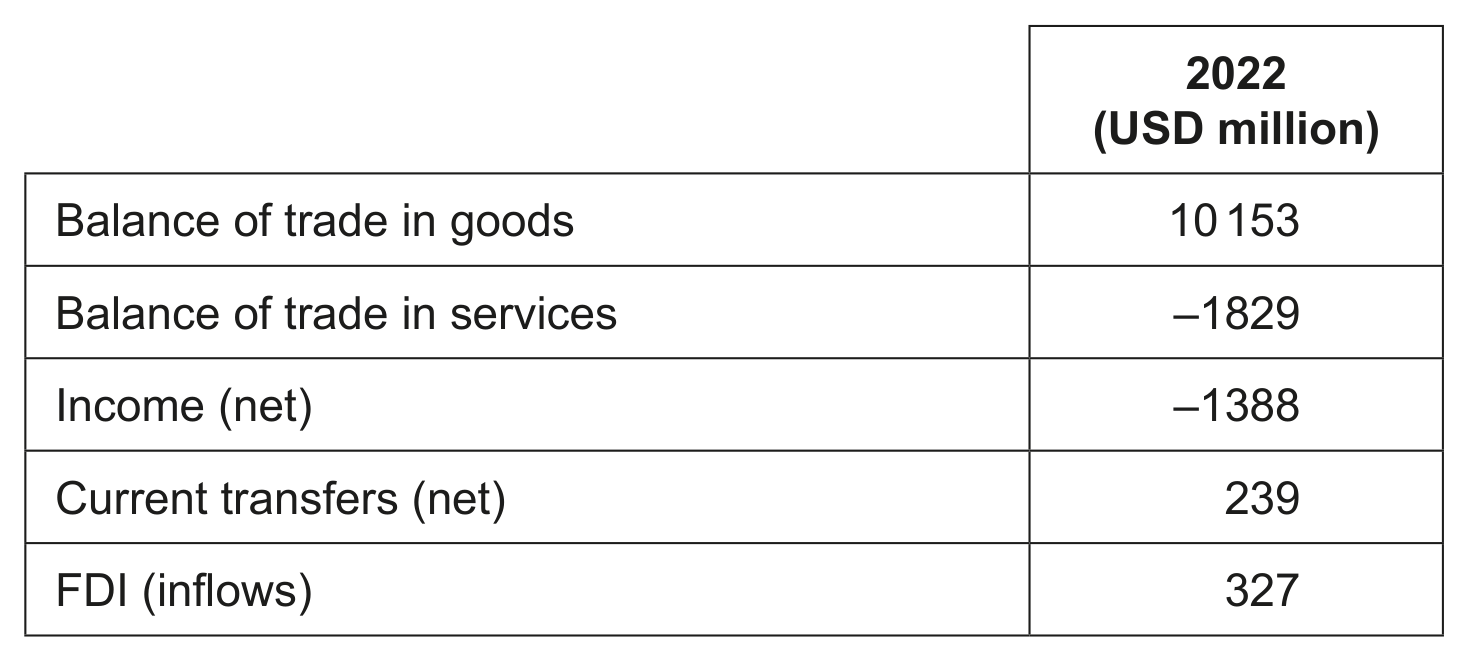
Table 5: Balance of payments data for Papua New Guinea

Table 5: Balance of payments data for Papua New Guinea

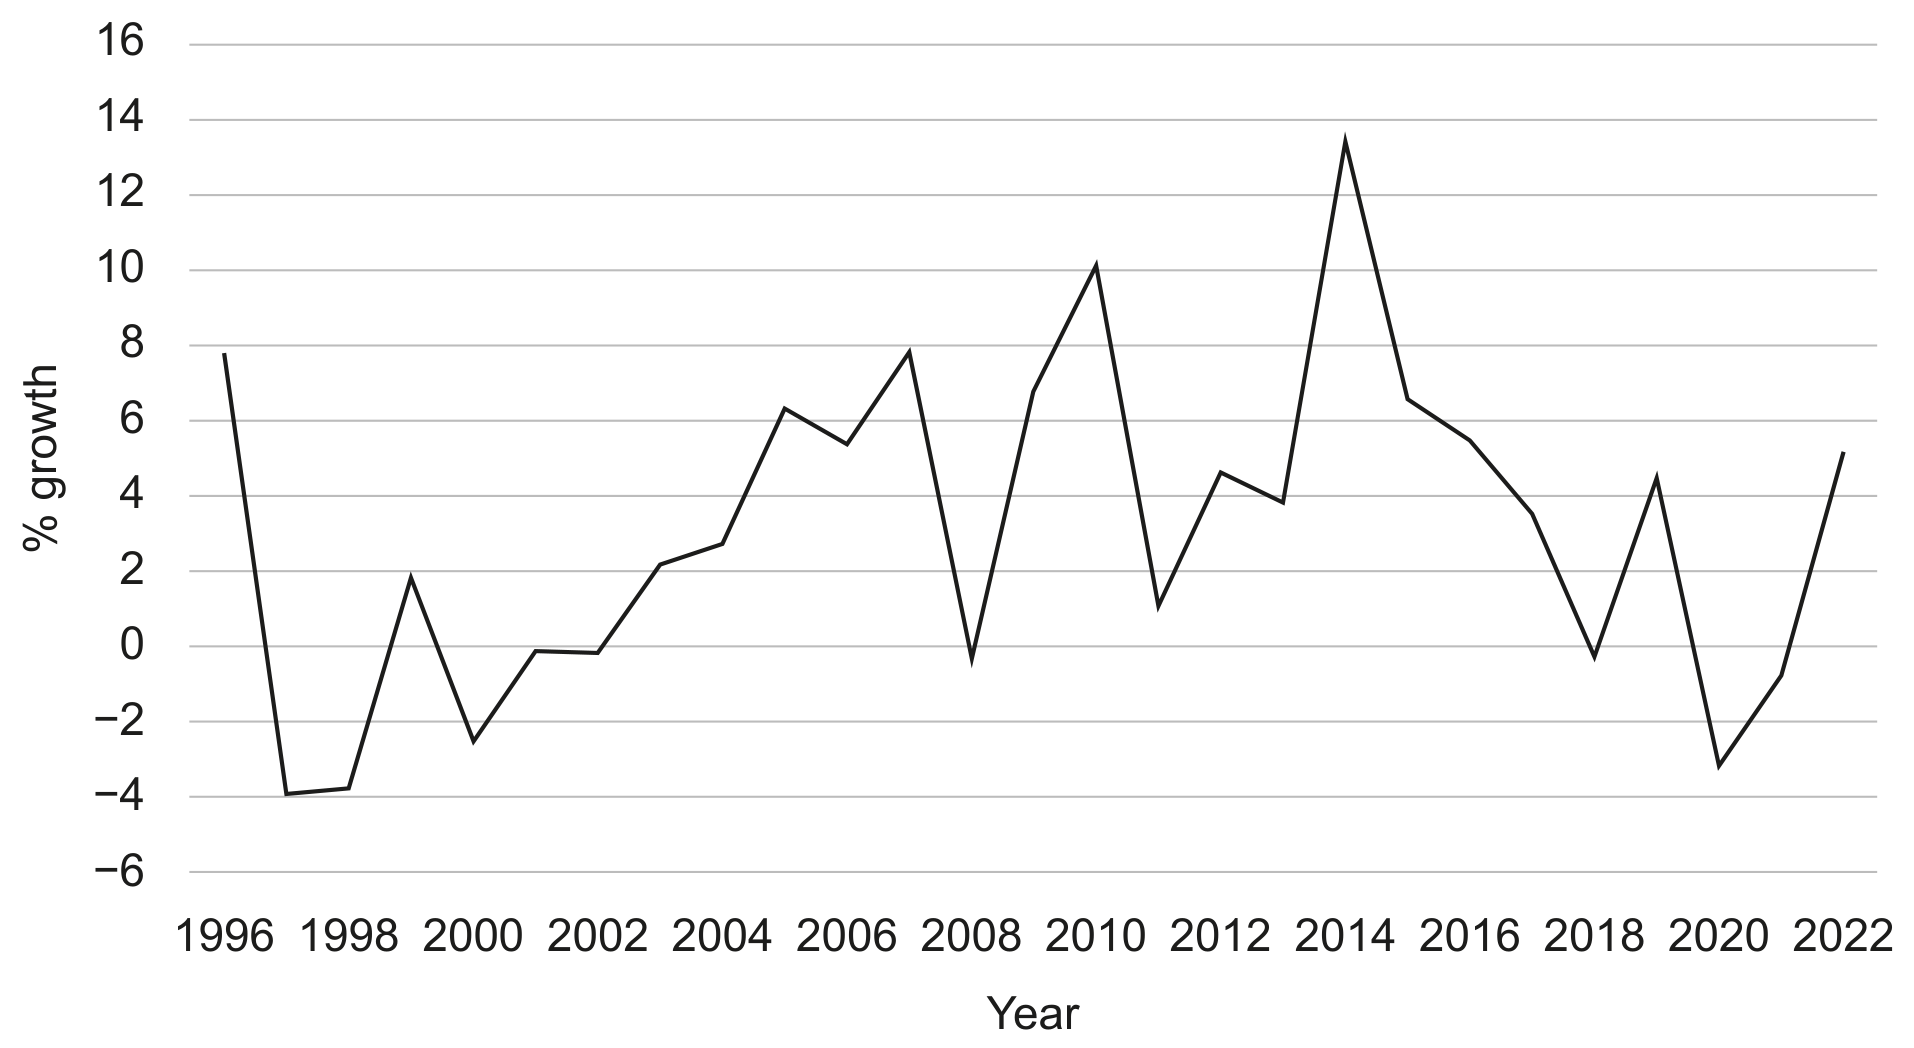
Figure 1: Real GDP annual growth rates in Papua New Guinea between 1996 and 2022

Figure 1: Real GDP annual growth rates in Papua New Guinea between 1996 and 2022

Using a demand and supply diagram, explain why an increase in demand for copper causes a greater change in the price of copper when PNG's supply is price inelastic than when its supply is price elastic (Text D, paragraph 2).

Question 3

Question 3(d)(i)

(a)

Define the term price elasticity of supply (PES).

[ 2 ]

Question 3(d)(ii)

(b)

The increase in demand of 10000 kg per month (see 3.(b)) has led to a new equilibrium price of $ 15 and a new equilibrium quantity of 804000 kg butter.

Calculate the PES for butter between the original and the new market price.

[ 2 ]

Question 3(e)

(c)

Explain two factors that determine the PES of a product.

[ 4 ]
0 selected