IB Chemistry SL Reactivity 2.2 Rate of Chemical Change
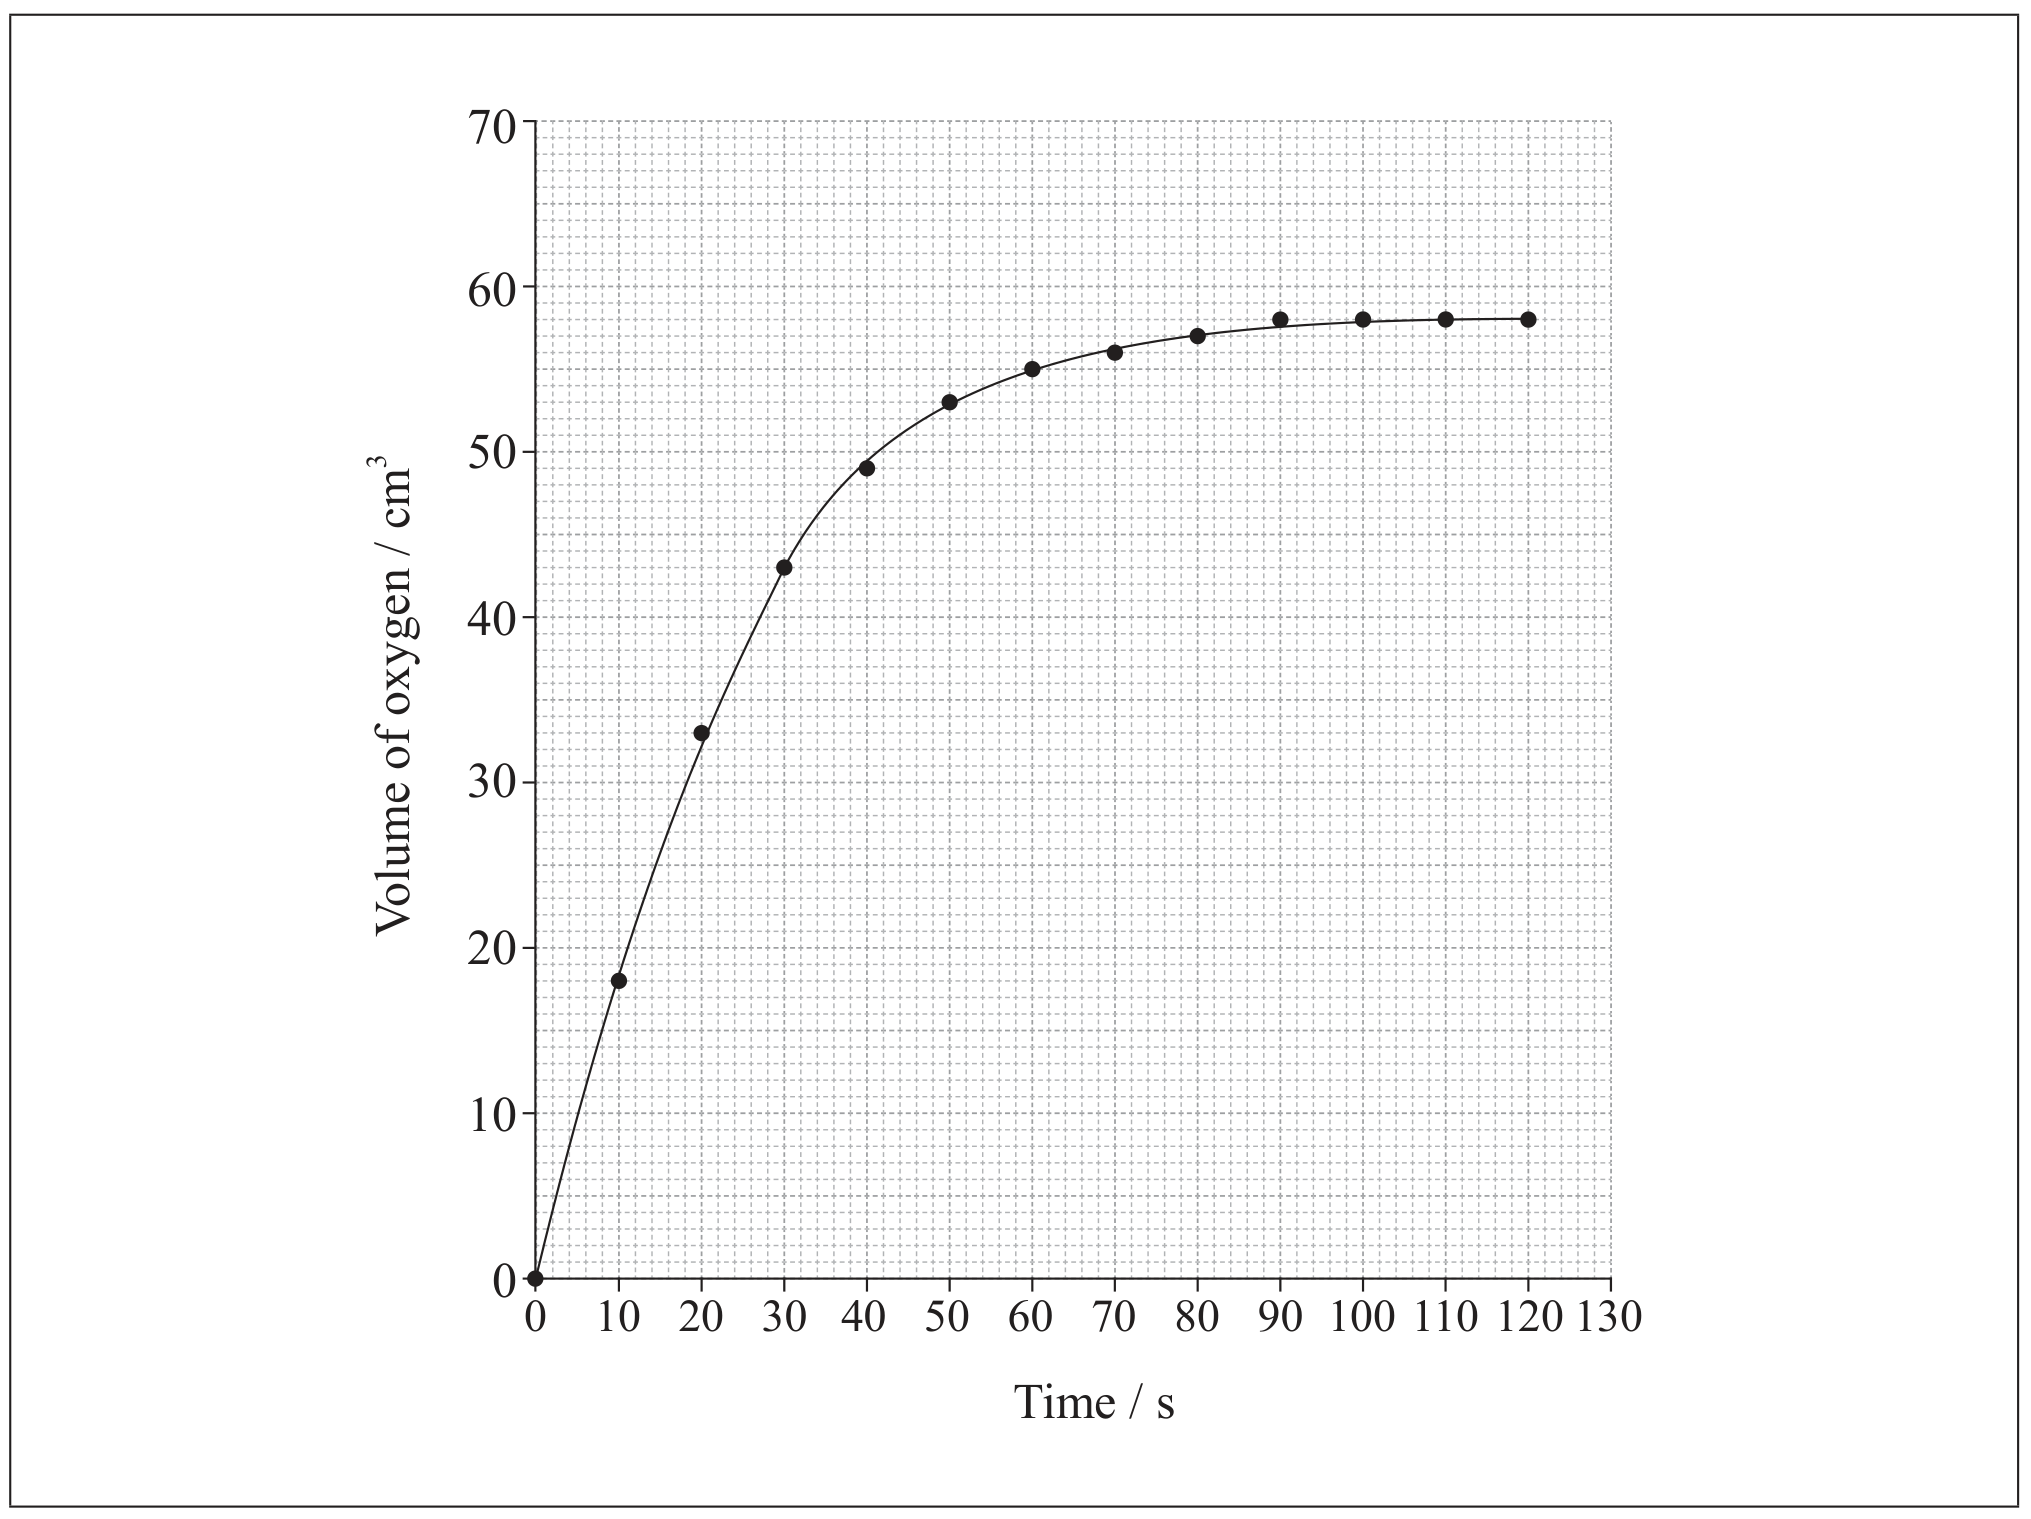
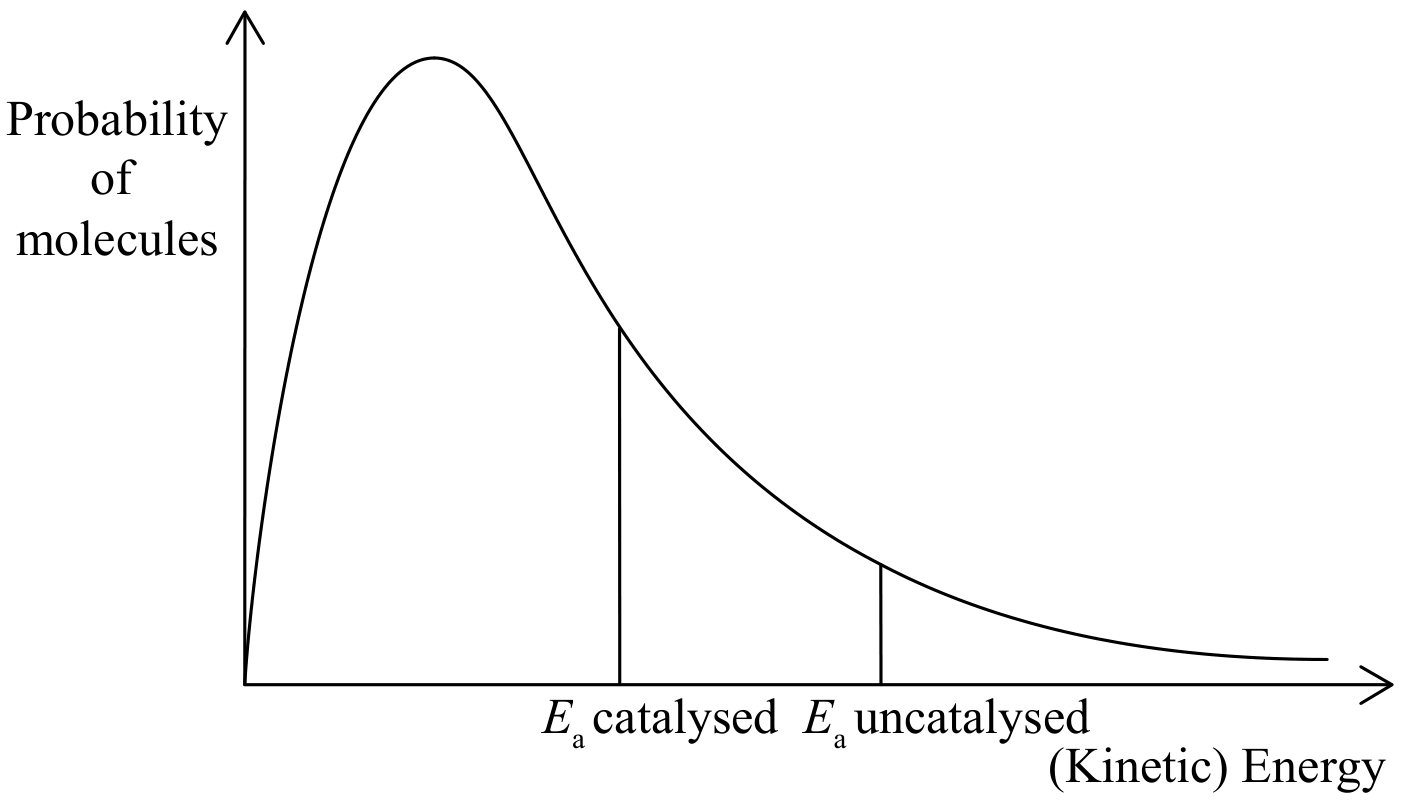
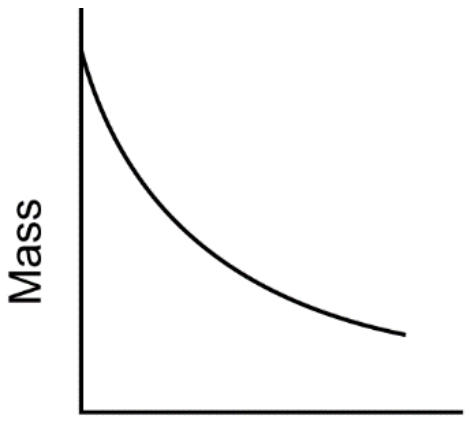
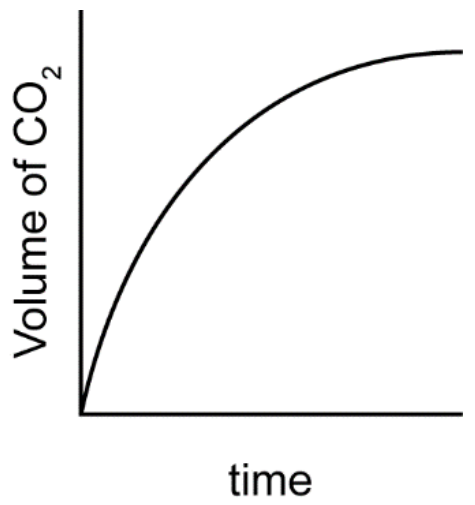
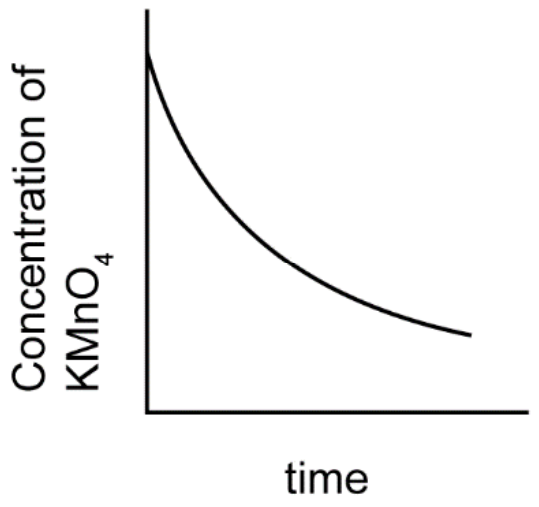
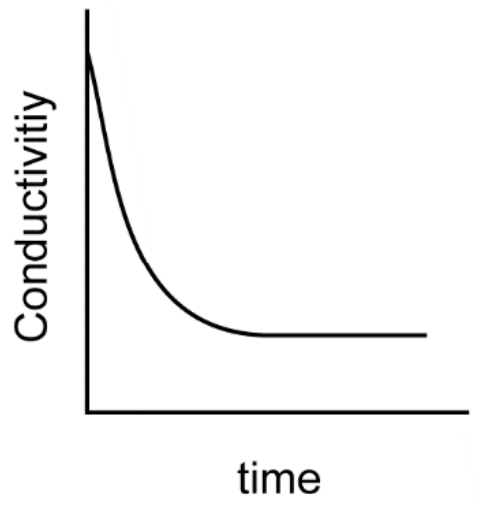
Practise calculating rates from data or graph gradients and explaining concentration, pressure, temperature, surface-area and catalyst effects with collision theory.
- Syllabus
- First assessment 2025
- Topic
- 2.2
- Level
- SL