1.3.2—Hydrogen emission spectrum
- Syllabus
- First assessment 2025
- Objective
- 1.3.2
- Level
- SL
Hydrogen's emission spectrum contains discrete lines because electrons occupy discrete energy levels. Each line corresponds to a downward transition and the emitted photon's energy equals the energy difference between the levels.
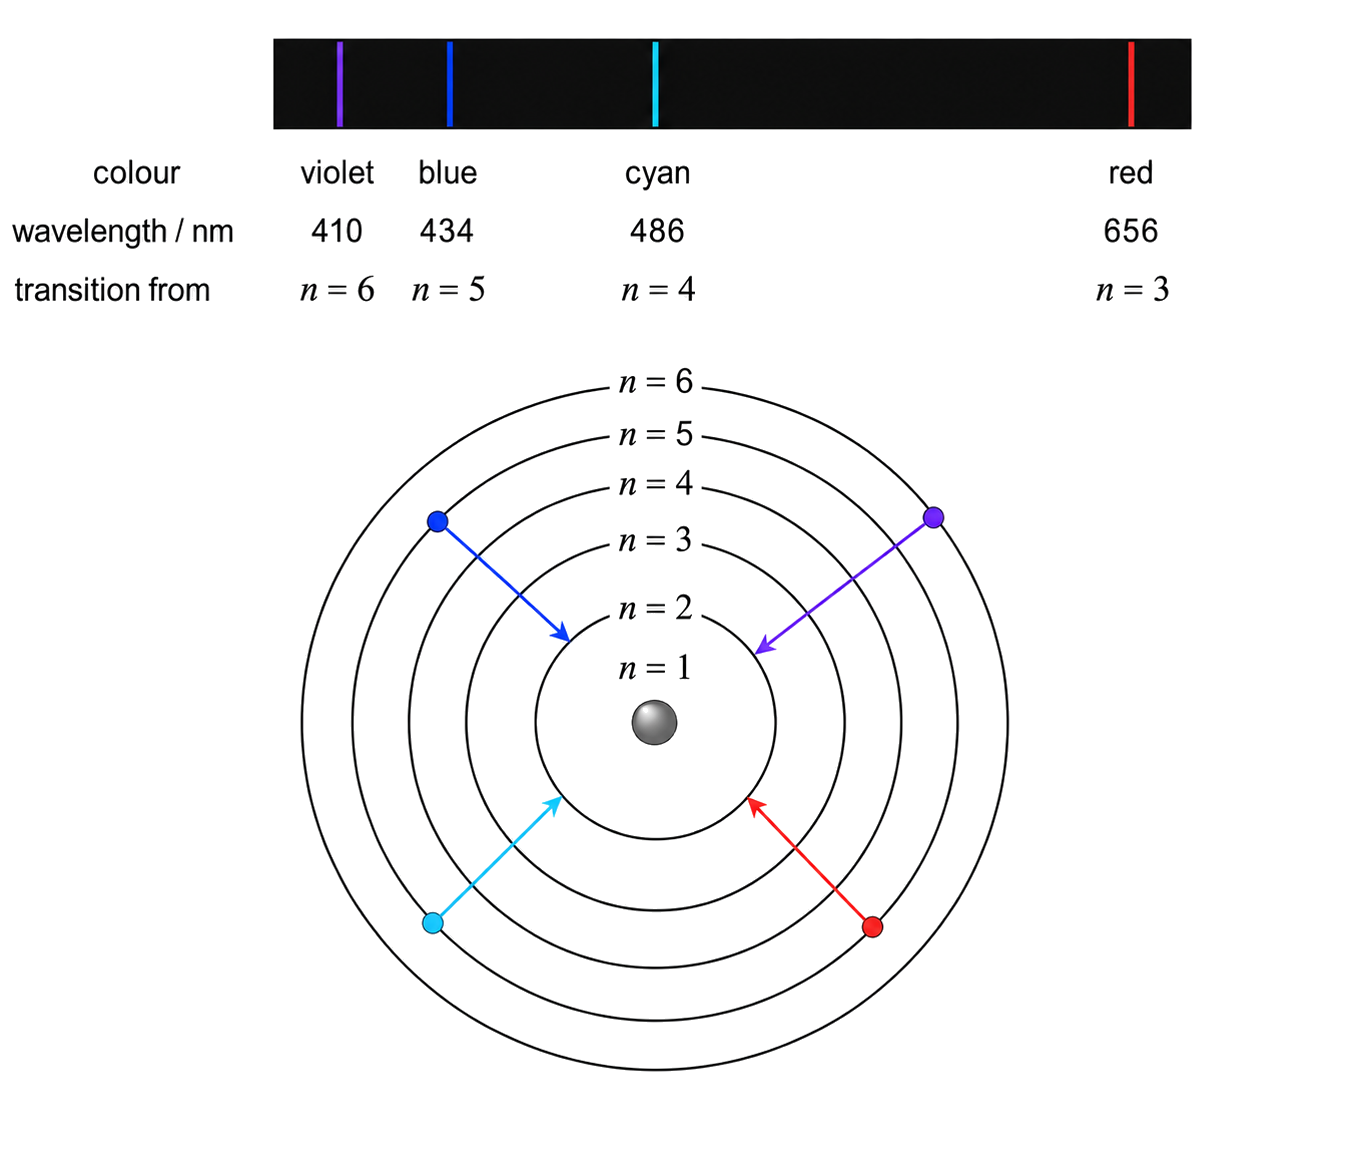
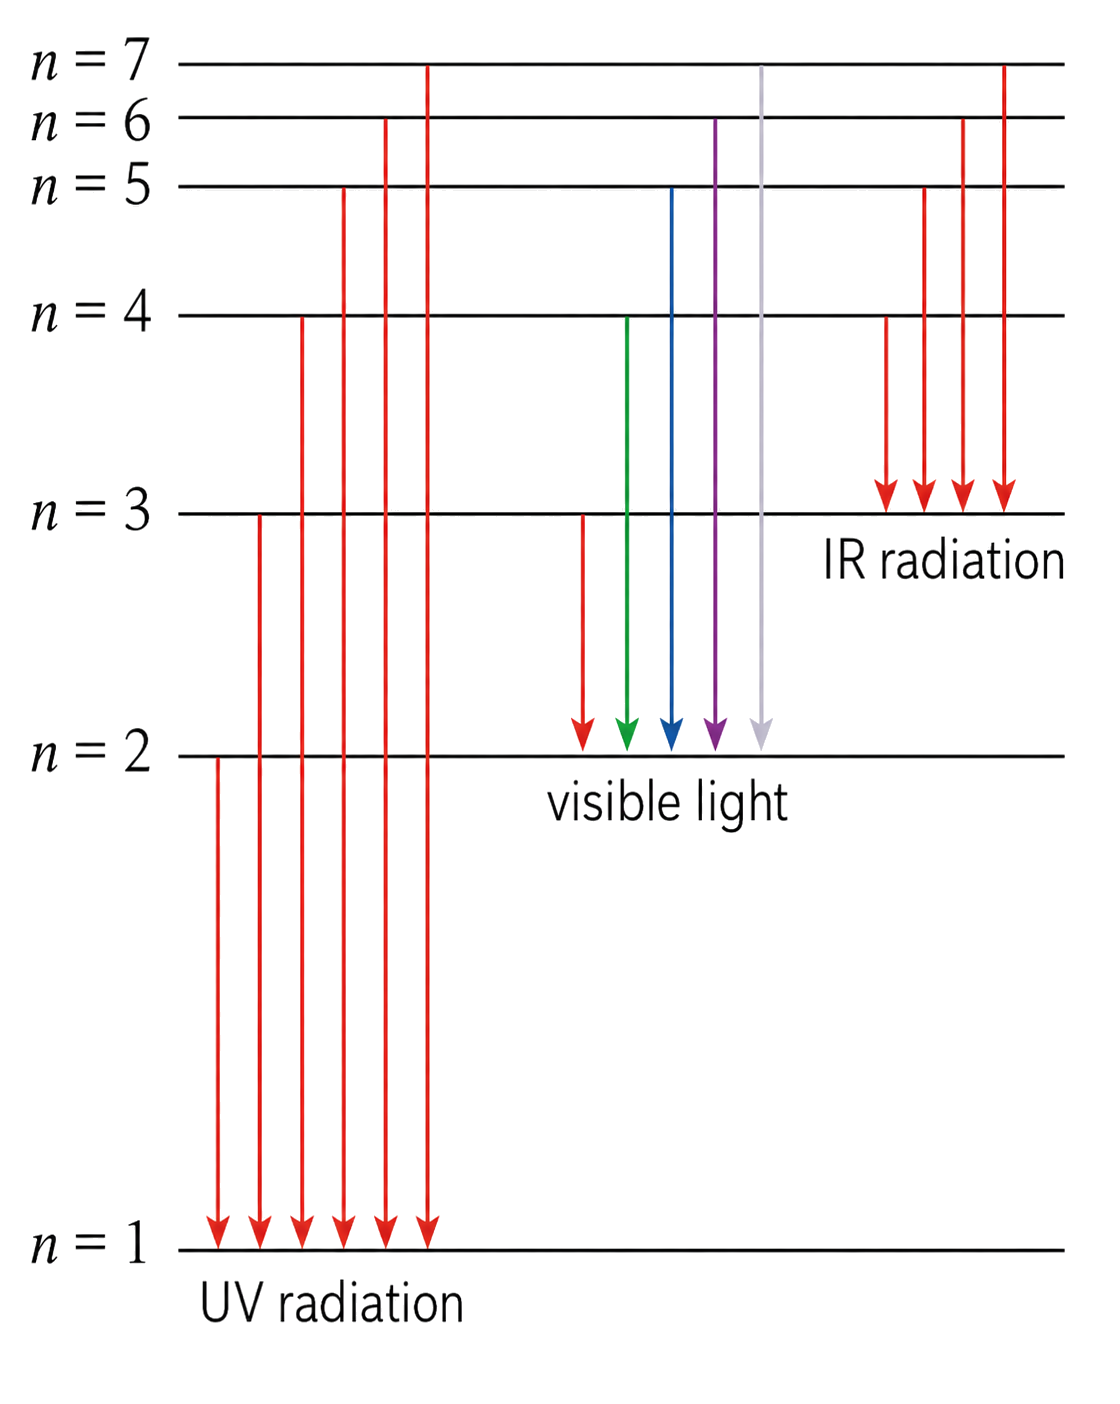
| Transition ending at | Region identified in the study guide |
|---|---|
| n = 1 | ultraviolet |
| n = 2 | visible |
| n = 3 | infrared |
At higher energy, the levels become closer together, so the lines converge. The names of the series are not required.
Use the presence of separate lines as evidence for discrete levels, and use convergence at higher energy or frequency as evidence that the level spacing becomes smaller.
Compare lines by their energy gaps. Transitions ending at n = 2 form the visible series, and lines crowd together as the starting level rises because adjacent high-n levels are closer in energy. The convergence limit represents removal of the electron, not one more bound-state transition.