Structure 1. Models of the particulate nature of matter

Syllabus
First assessment 2025
Section
—
Level
HL

1.1 Introduction to the particulate nature of matter

Syllabus
First assessment 2025
Topic
1.1
Level
HL

Classifying Matter by Composition

Classify matter by asking what particles are present, whether different elements are chemically bonded, and whether the composition is fixed. An element contains one type of atom and cannot be chemically broken down. A compound contains atoms of different elements bonded in a fixed ratio, so it has its own properties. A mixture contains two or more substances in no fixed ratio; the components are not chemically bonded to one another and retain properties that can be used for separation.

Class Particle-level test Composition How components can be obtained
Element One type of atom Fixed identity Cannot be chemically broken into simpler substances
Compound Different elements chemically bonded Fixed ratio Requires a chemical change
Mixture More than one substance without bonding between components Variable ratio Uses a physical-property difference

Formation of a compound creates new properties: sodium and chlorine do not keep their separate properties after forming sodium chloride. Mixing substances does not have that effect. A homogeneous mixture is uniform at the scale observed; a heterogeneous mixture has distinguishable regions. Both remain mixtures.

Choose a separation method in three linked moves: identify a physical-property difference, select the operation that exploits it, then state which component is recovered where. Use magnetism for a magnetic solid; filtration for an insoluble solid suspended in a fluid; crystallization or evaporation to recover a dissolved solid; and simple distillation to recover a solvent or separate liquids with a sufficiently wide boiling-point gap. Use fractional distillation when miscible liquids have closer boiling points. Chromatography separates through different relative attractions to the mobile and stationary phases. A multi-component mixture may require a sequence of methods.

Uniform appearance is not evidence of a compound: air and salt solution are homogeneous mixtures. Also, do not justify filtration by saying only that substances have different solubilities. The separated solid must be insoluble, and the filter works because its particles do not pass through the pores.

Diagnostic check: a particle box containing two unbonded particle types represents a mixture even if it looks uniform. For an unknown mixture, complete three columns—chosen method, physical-property reason, and observable recovered fraction. Reject any proposal that changes the substances chemically or cannot state where each component goes.

Separating Mixtures

[ 4 ]

Suggest a set of experimental steps required to obtain pure samples of each component of the mixture.

Explaining States with Particles

The kinetic molecular theory is a model that explains observable state properties using particle arrangement, movement, spacing, and attractions. Solid particles are closely packed and vibrate about fixed positions. Liquid particles remain close but change neighbours and flow past one another. Gas particles are far apart relative to their size and move freely, so a gas fills its container and is much more compressible.
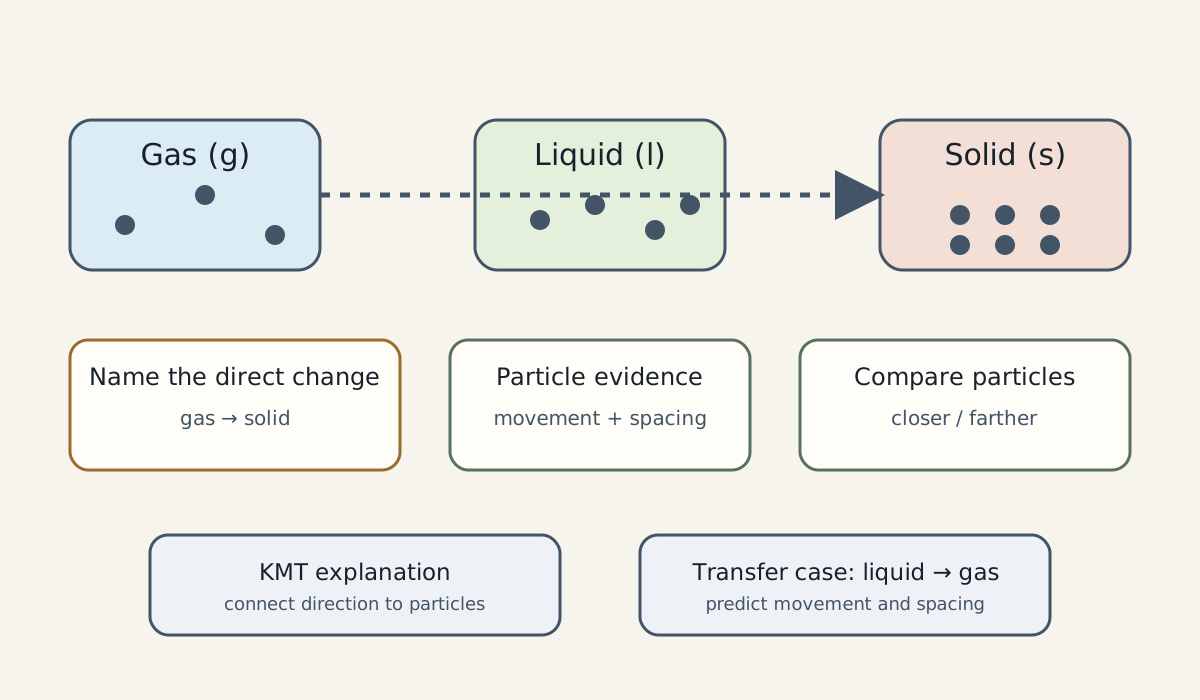
The same particles are closely ordered in a solid, close but mobile in a liquid, and far apart in a gas, with arrows naming each state change.
State Particle model Fixed volume? Fixed shape? Symbol
Solid Close, ordered or fixed positions; vibrate Yes Yes (s)
Liquid Close, disordered; move past neighbours Yes No (l)
Gas Widely spaced; rapid random motion No No (g)

(aq) does not name a fourth state of pure matter. It means the stated species is dissolved in water.

Change Direction Energy transfer for the substance
Melting solid → liquid absorbed
Freezing liquid → solid released
Vaporization liquid → gas absorbed
Condensation gas → liquid released
Sublimation solid → gas absorbed
Deposition gas → solid released

Heating increases particle motion until a transition begins. During the transition, supplied energy changes the extent of intermolecular attraction and particle arrangement; the chemical identity remains the same. Evaporation can occur at a liquid surface below the boiling point, whereas boiling occurs throughout a liquid when its vapour pressure matches the external pressure.

Do not say that particles themselves melt, expand, or become a different substance. In a physical state change, the same particles adopt different motion and arrangement. For molecular substances, the energy change is associated with intermolecular attractions; it does not generally break the covalent bonds inside each molecule.

State Change Reasoning

Practice only · progress is not saved

Temperature and Average Kinetic Energy

Temperature on the Kelvin scale is proportional to the average translational kinetic energy of particles. At the same Kelvin temperature, samples of different gases have the same average kinetic energy, although lighter particles have a higher typical speed than heavier particles. Use absolute temperature, not degrees Celsius, when comparing kinetic energies or temperature ratios.
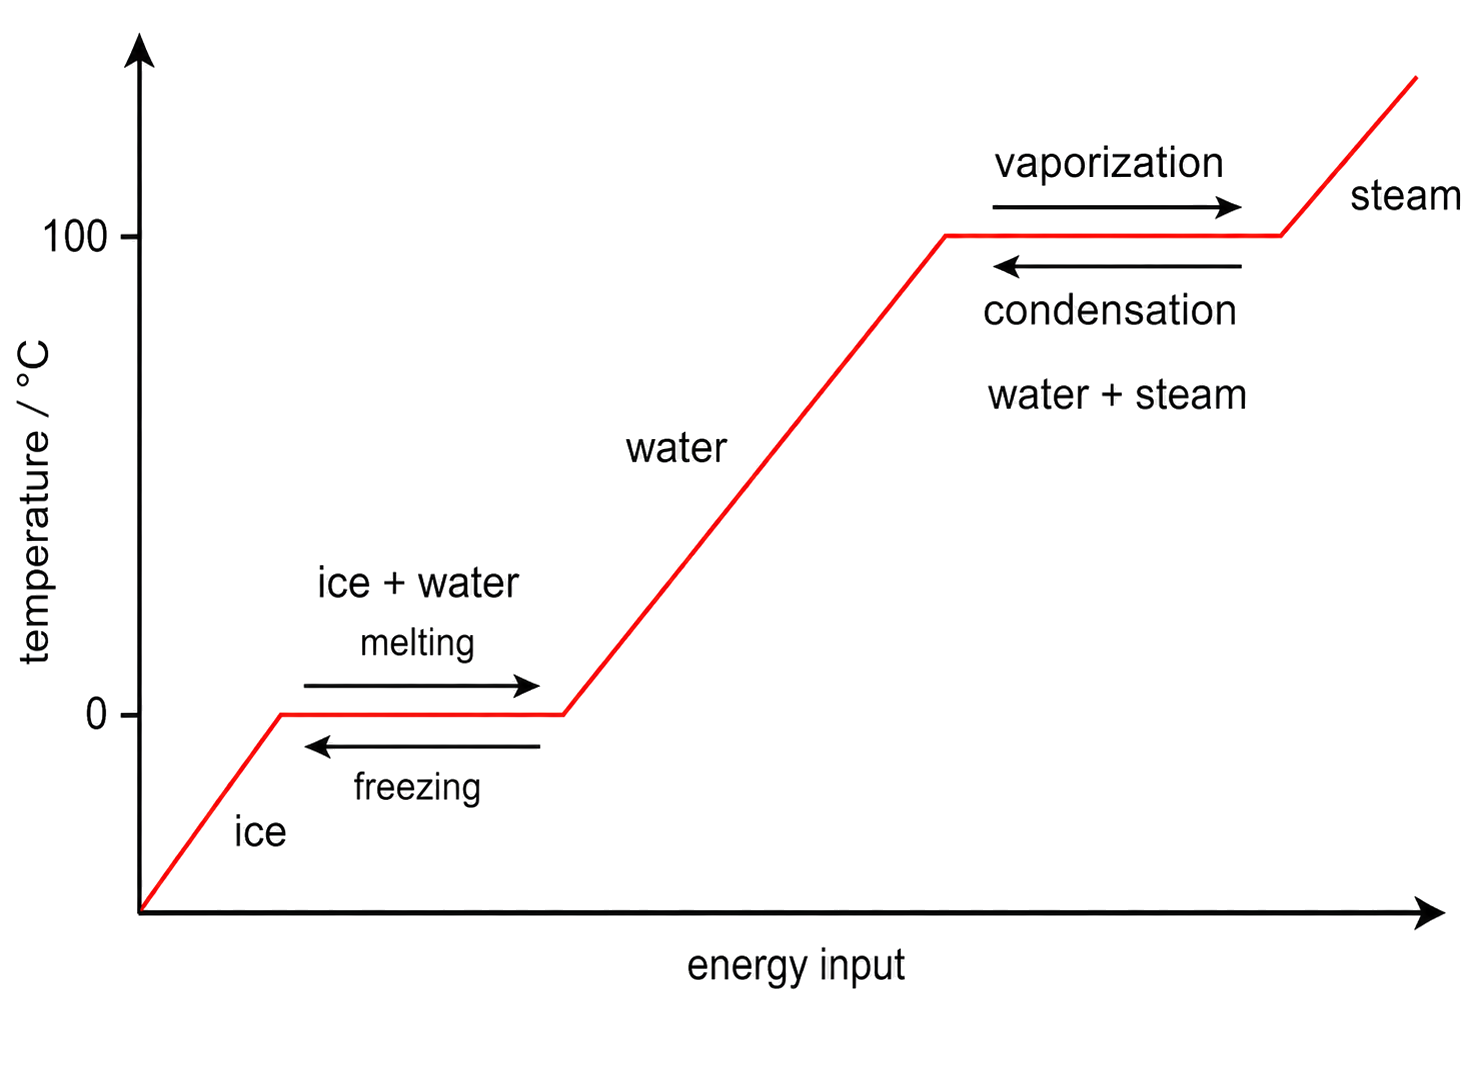
A heating curve rises within each state and stays flat during melting and boiling while added energy changes particle arrangement.

T/K=T/°C+273.15T / K = T / °C + 273.15

Worked example — convert before interpreting

For 25.0 ∘C25.0\,^\circ\mathrm{C}, substitute into the conversion: T=25.0+273.15=298.15 KT=25.0+273.15=298.15\,\mathrm{K}, reported as 298.2 K298.2\,\mathrm{K} to one decimal place. The Kelvin value is the absolute temperature used for kinetic-energy comparisons; a rise of 10 K10\,\mathrm{K} is the same temperature interval as a rise of 10 ∘C10\,^\circ\mathrm{C}.

Read a heating curve by first deciding whether the substance is within one state or changing state. On a sloping section, supplied energy increases average kinetic energy, so temperature rises. On a horizontal phase-change section at constant pressure, energy is still absorbed, but it is used to overcome intermolecular attractions and change particle arrangement; temperature and average kinetic energy stay constant until that change is complete. Cooling reverses the energy flow.

A 20 K temperature interval has the same size as a 20 °C interval, but 20 °C is not an absolute temperature of 20 K. Do not infer that heavier gas particles have greater average kinetic energy at the same temperature, and do not interpret a heating-curve plateau as a period when no energy is transferred.

Temperature Calculations

[ 1 ]

What happens to the average kinetic energy, KE , of the particles in a gas when the absolute temperature is doubled?
KE=12mv2\mathrm{KE}=\frac{1}{2} \mathrm{mv}^{2}

Particulate Matter Summary

Retrieve the progression: classify matter as an element, compound, or mixture; use particle movement and spacing to explain states and state changes; then connect absolute temperature in kelvin with average kinetic energy.

When checking an answer, ask three questions: Is the composition fixed or separable physically? Which direction do the state symbols show? Am I using kelvin when the claim concerns average kinetic energy?

1.2 The nuclear atom

Syllabus
First assessment 2025
Topic
1.2
Level
HL

Reading Atomic Structure

An atom has a dense, positively charged nucleus containing protons and neutrons. Negatively charged electrons occupy the space outside the nucleus. Protons and neutrons are nucleons.

Quantity Meaning Rule
Atomic number, Z Number of protons p = Z
Mass number, A Protons plus neutrons n = A − Z
Ion charge Proton charge compared with electron charge charge = p − e

For a neutral atom, electrons equal protons. For an ion, use the stated charge to determine the electron count.

Read Z first to obtain protons, subtract Z from A to obtain neutrons, then use the ion charge to check or calculate electrons.

Apply the symbols in a fixed order. For ³⁵₁₇Cl⁻, Z = 17 gives 17 protons, A − Z gives 18 neutrons, and the 1− charge means one more electron than protons, so there are 18 electrons. The ion charge changes electron count, never the element identity.

Particle Location Relative charge Approximate relative mass
Proton nucleus +1 1
Neutron nucleus 0 1
Electron outside nucleus −1 about 1/1836

Most atomic mass is concentrated in the nucleus. Atomic number identifies the element through proton count; ion formation changes electron count, not proton count.

Atomic and Ionic Particle Counts

[ 2 ]

Calculate the number of protons, neutrons and electrons in the 26Mg+{ }^{26} \mathrm{Mg}^{+}ion.

Protons:
Neutrons:
Electrons:

Isotopes and Relative Atomic Mass

Isotopes are atoms of the same element with the same number of protons but different numbers of neutrons. They have the same electron arrangement and therefore the same chemical properties, while their different masses can give different physical properties.

Ar=∑(isotopemass×fractionalabundance)A_r = ∑(isotope mass × fractional abundance)

Convert percentage abundances to fractions, multiply each isotope mass by its fractional abundance, then add the contributions. The result is a weighted mean, not an unweighted average.

For a two-isotope sample containing 75% mass 35 and 25% mass 37, the weighted mean is (35 × 0.75) + (37 × 0.25) = 35.5. An answer between the isotope masses is a useful check; simply averaging 35 and 37 would ignore abundance.

Read isotope identity from the pair of nuclear symbols: ³⁵₁₇Cl and ³⁷₁₇Cl are both chlorine because Z = 17 in each, but they contain 18 and 20 neutrons respectively because A differs. Mass number belongs to one nuclide; relative atomic mass is the abundance-weighted mean for a sample.

Applying Isotope Abundance

[ 2 ]

Calculate the relative atomic mass of bromine from the sample, giving your answer to two decimal places.

Reading a Mass Spectrum

HL only

In a mass spectrum, peak position identifies an isotope's mass-to-charge value and relative peak height represents its abundance in the sample. Use those two pieces of evidence together to identify isotopes and determine relative atomic mass.
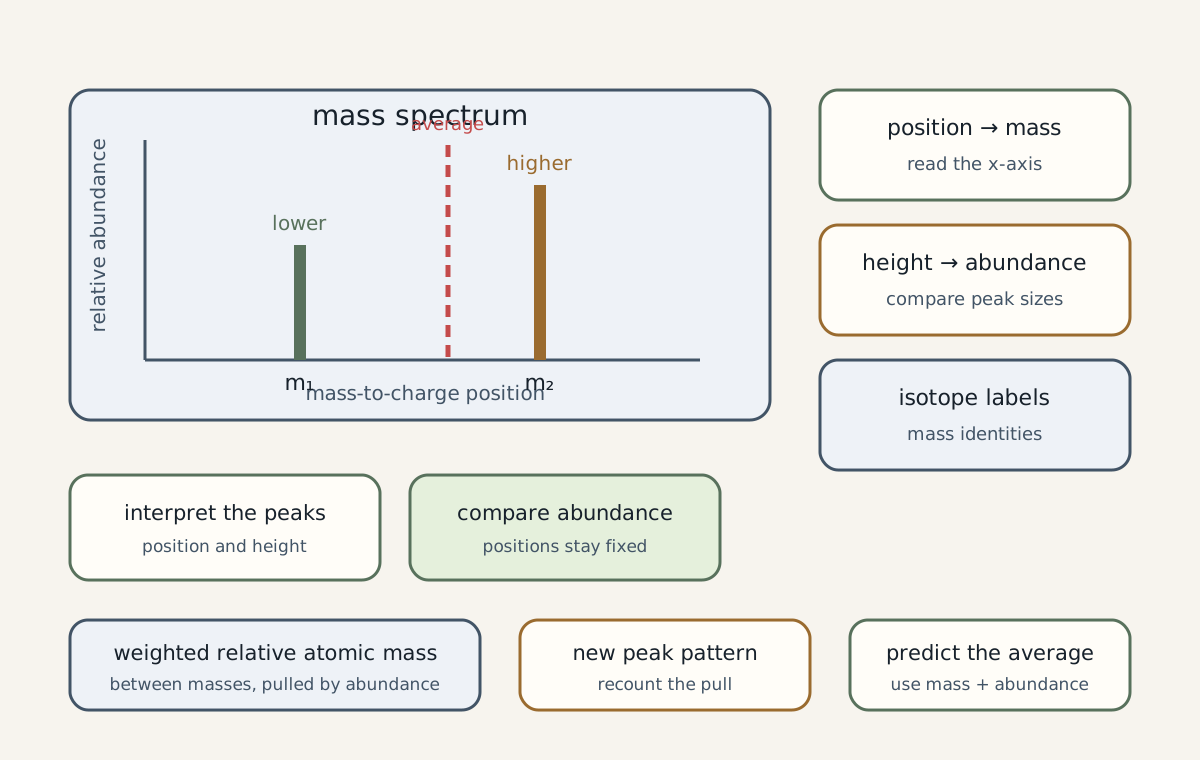
A mass spectrum has peaks at m/z 35 and 37 in a three-to-one height ratio, representing fractional abundances 0.75 and 0.25.
Read Infer Use
Peak position Isotope mass Label the isotope
Relative peak height Relative abundance Weight that isotope's contribution
All peaks together Isotopic composition Calculate the weighted relative atomic mass

The syllabus assesses interpretation of mass spectra, not operational details of how the spectrometer works.

Ar=(m1×f1)+(m2×f2)+…A_r = (m_1×f_1) + (m_2×f_2) + …

If singly charged isotope peaks occur at m/z 35 and 37 in a 3:1 height ratio, use fractional abundances 0.75 and 0.25 to obtain Aᵣ = 35.5. First confirm the charge state: m/z is a ratio, so a multiply charged ion cannot be read as mass alone.

The Nuclear Atom Summary

Retrieve the sequence: use nuclear notation to count particles, distinguish isotopes by neutron number, then read mass-spectrum positions and heights as isotope mass and abundance evidence.

When checking an answer, ask: Did I separate A, Z, and charge? Did I explain isotope properties through electron arrangement? Did I weight each isotope by its abundance?

1.3 Electron configurations

Syllabus
First assessment 2025
Topic
1.3
Level
HL

Emission Spectra

An emission photon is released when an electron falls from a higher energy state to a lower energy state. Absorption moves an electron upward and requires photon energy.
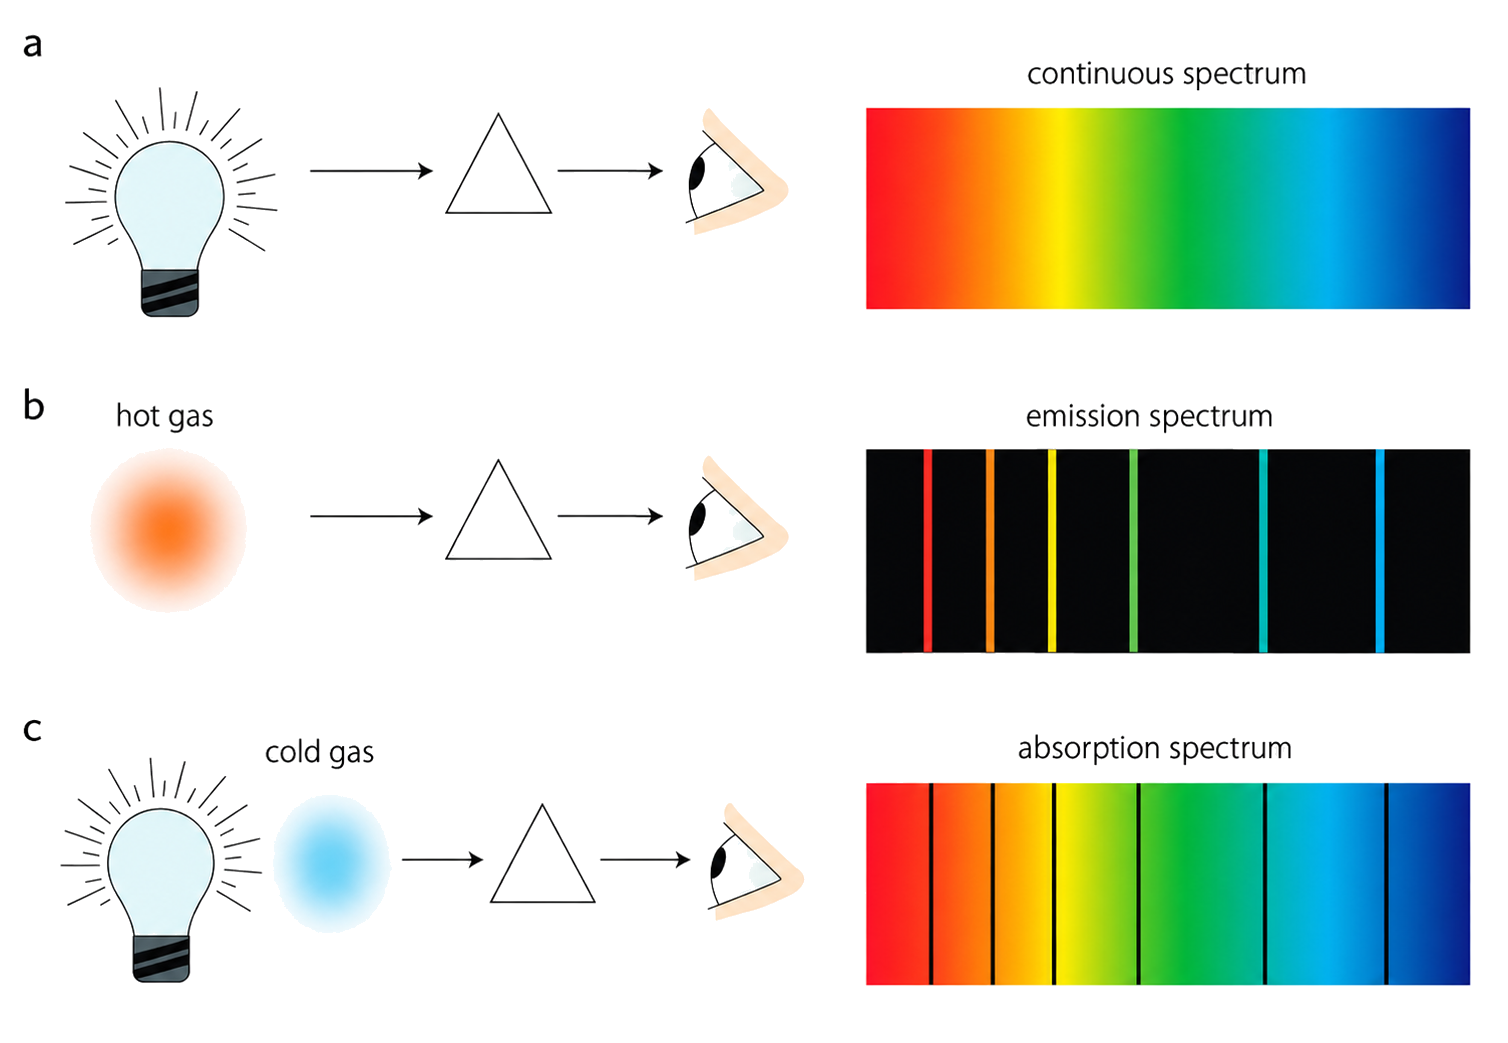
Electron drops between discrete energy levels emit specific photons, producing separate lines rather than a continuous spectrum.
Spectrum What it contains Why
Line spectrum Specific wavelengths, frequencies, energies, or colours Electrons occupy discrete energy levels, so only particular transitions occur
Continuous spectrum A continuous range across the relevant values The radiation spans the range rather than appearing as separated lines

Across electromagnetic radiation, shorter wavelength means higher frequency, and higher frequency means higher photon energy. Explain the electron direction and photon exchange when distinguishing absorption from emission.

Read every spectral transition in two directions: absorption raises an electron by ΔE, while a downward transition emits a photon with ΔE = hf = hc/λ. A shorter-wavelength line therefore represents a larger energy gap, not a higher line intensity.

Orient the spectrum before comparing lines: radio → microwave → infrared → visible → ultraviolet → X-ray → gamma is increasing frequency and photon energy, and decreasing wavelength. Within visible light, red has longer wavelength and lower photon energy than violet.

Explaining Absorption and Emission

[ 2 ]

Distinguish between the processes within the atom that give rise to absorption and emission spectra.

Absorption spectra:

Emission spectra:

Hydrogen's Line Spectrum

Hydrogen's emission spectrum contains discrete lines because electrons occupy discrete energy levels. Each line corresponds to a downward transition and the emitted photon's energy equals the energy difference between the levels.
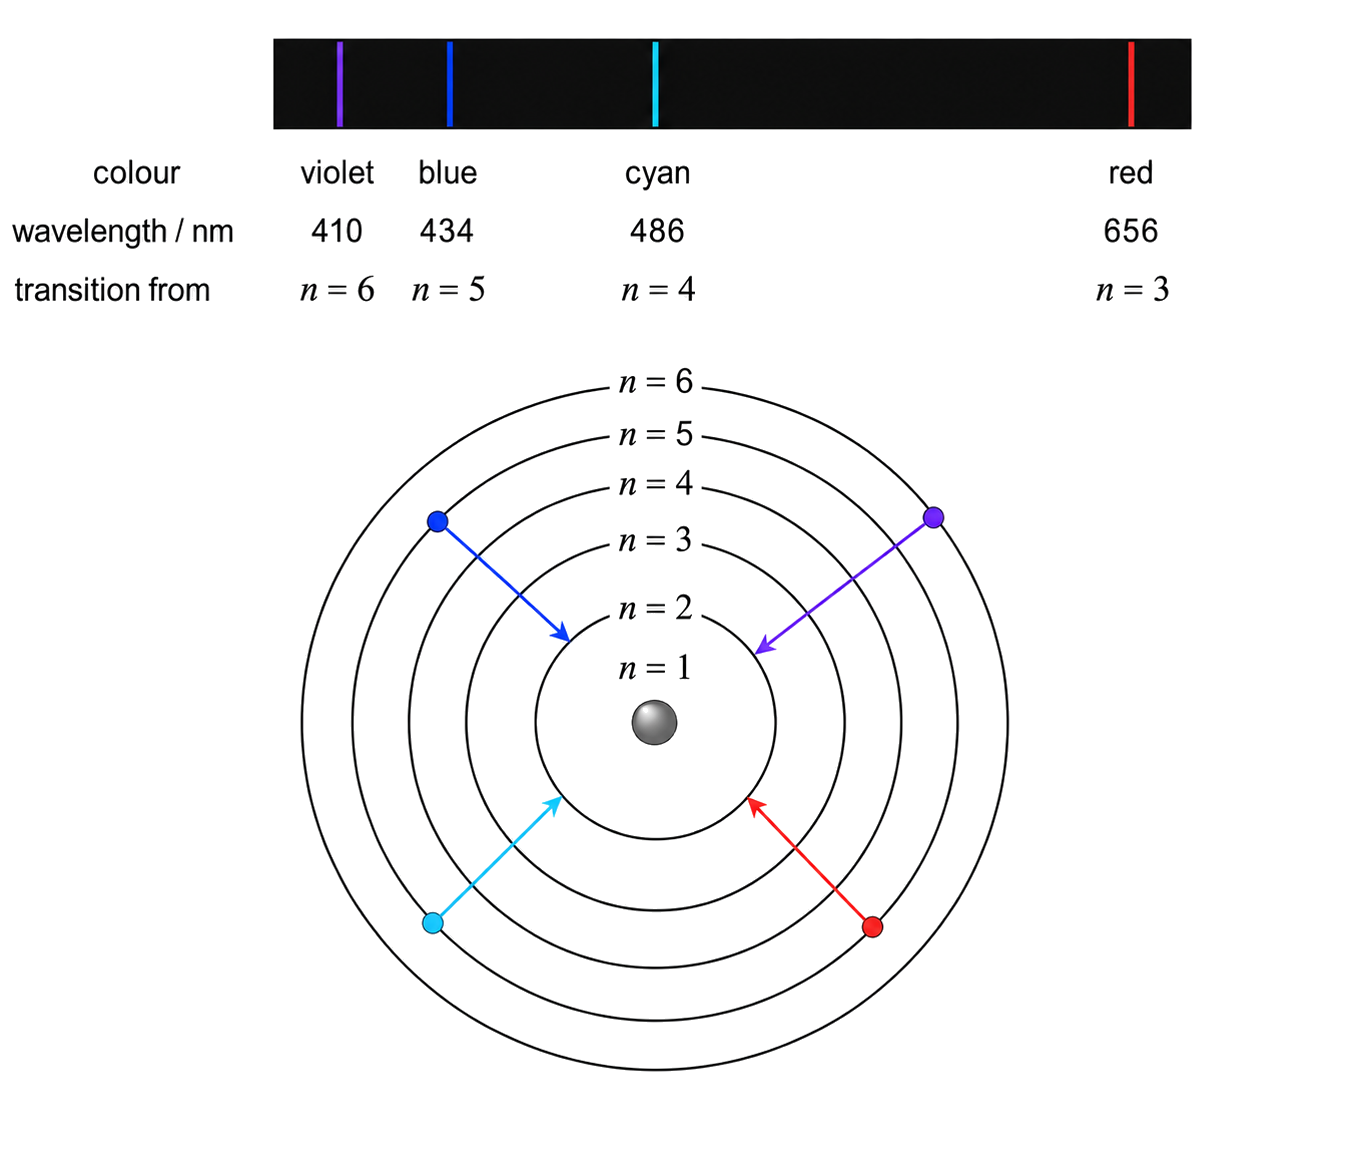
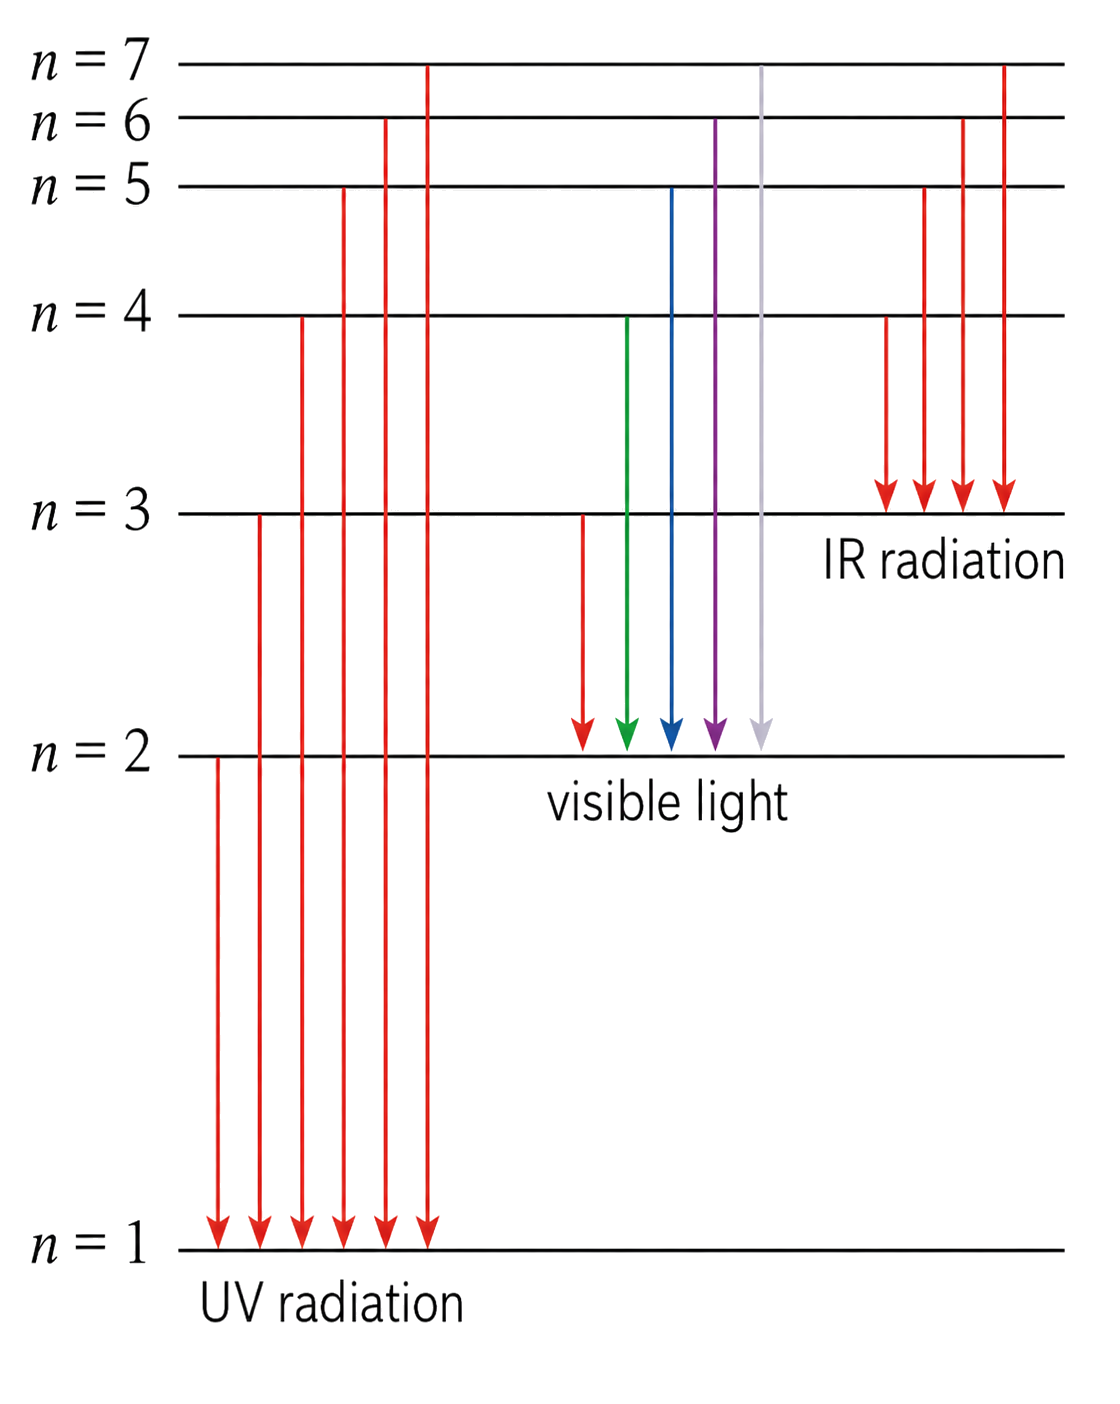
Hydrogen transitions end at n equals 1, 2, or 3, and the resulting spectral lines crowd together toward the high-energy convergence limit.
Transition ending at Region identified in the study guide
n = 1 ultraviolet
n = 2 visible
n = 3 infrared

At higher energy, the levels become closer together, so the lines converge. The names of the series are not required.

Use the presence of separate lines as evidence for discrete levels, and use convergence at higher energy or frequency as evidence that the level spacing becomes smaller.

Compare lines by their energy gaps. Transitions ending at n = 2 form the visible series, and lines crowd together as the starting level rises because adjacent high-n levels are closer in energy. The convergence limit represents removal of the electron, not one more bound-state transition.

Interpreting Hydrogen Emission Lines

[ 3 ]

Explain how this spectrum is related to the electron energy levels in a hydrogen atom.

Main Energy-Level Capacity

A main energy level, or shell, is identified by the principal quantum number n = 1, 2, 3, and so on.

maximumelectrons=2n2maximum electrons = 2n²

n Maximum electrons
1 2
2 8
3 18
4 32

Substitute the stated n value into 2n²; do not confuse the shell number with the capacity.

For n = 3, the theoretical capacity is 2(3²) = 18 electrons. This is a capacity, not a claim that every third shell is full: the actual occupancy depends on the atom and the relative energies of available sublevels.

Calculating Shell Capacity

[ 1 ]

What is the maximum number of electrons that can occupy the n=3 main energy level?

Sublevels, Orbitals, and Blocks

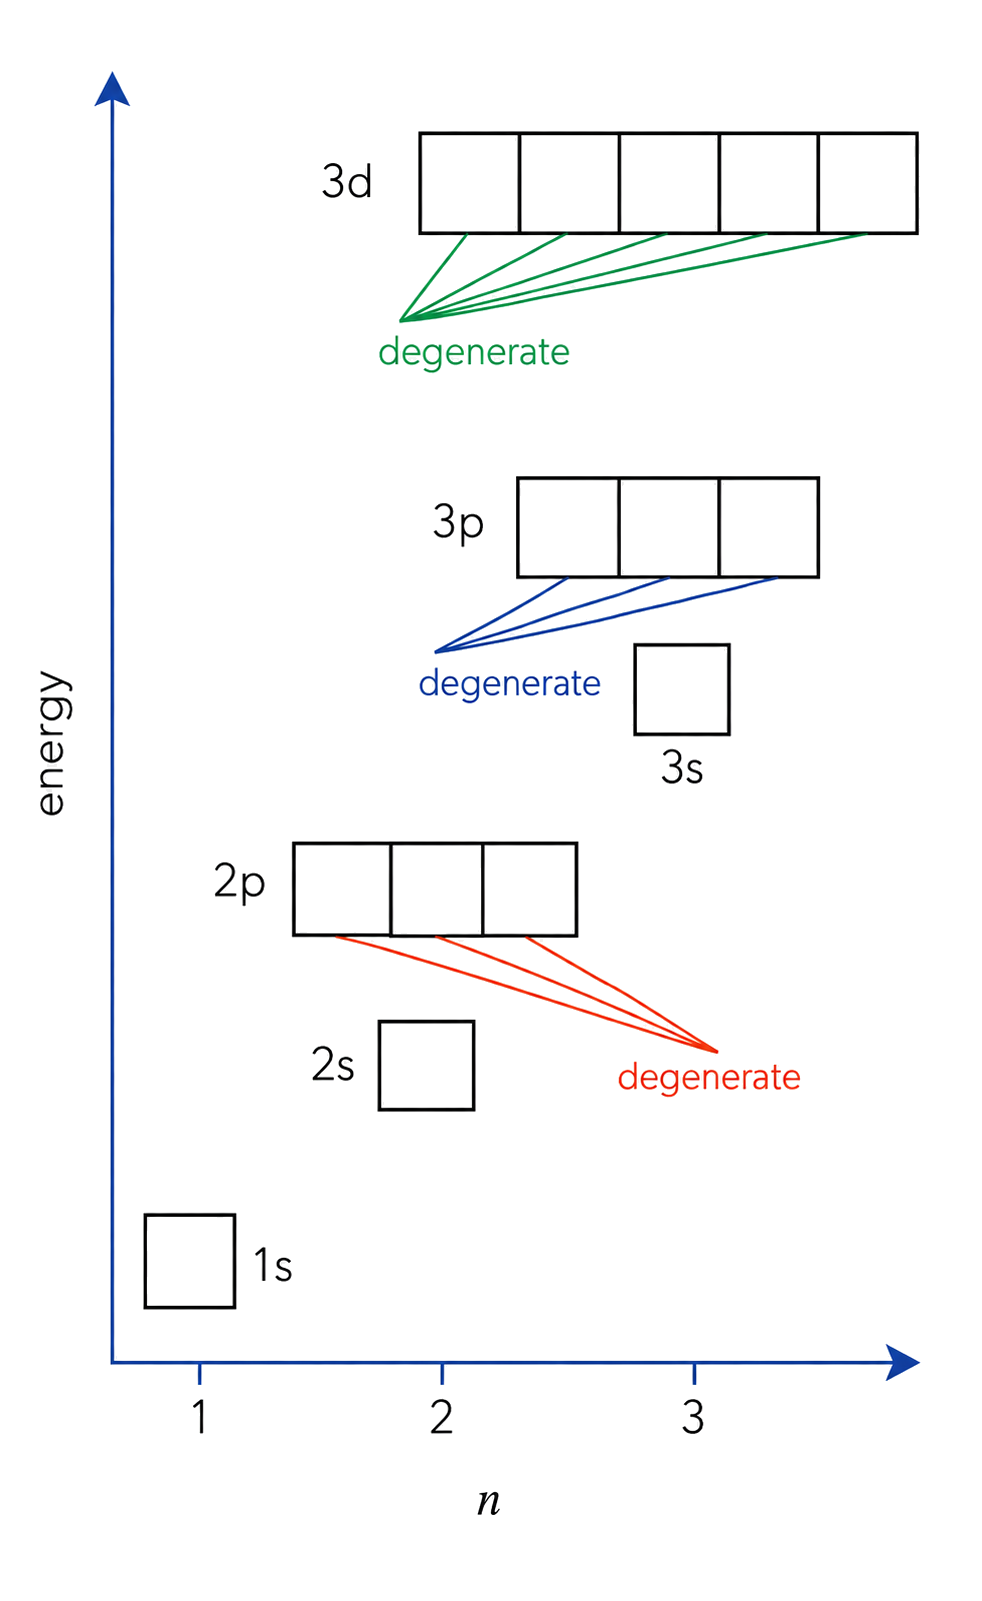
A main energy level contains only the sublevels allowed by its principal quantum number: n = 1 has s; n = 2 has s and p; n = 3 has s, p and d; and n = 4 can include s, p, d and f. Within one main level the sublevels rise in energy s < p < d < f, while the filling order across different levels can interleave, as the next card makes explicit. Each sublevel contains a fixed number of orbitals.
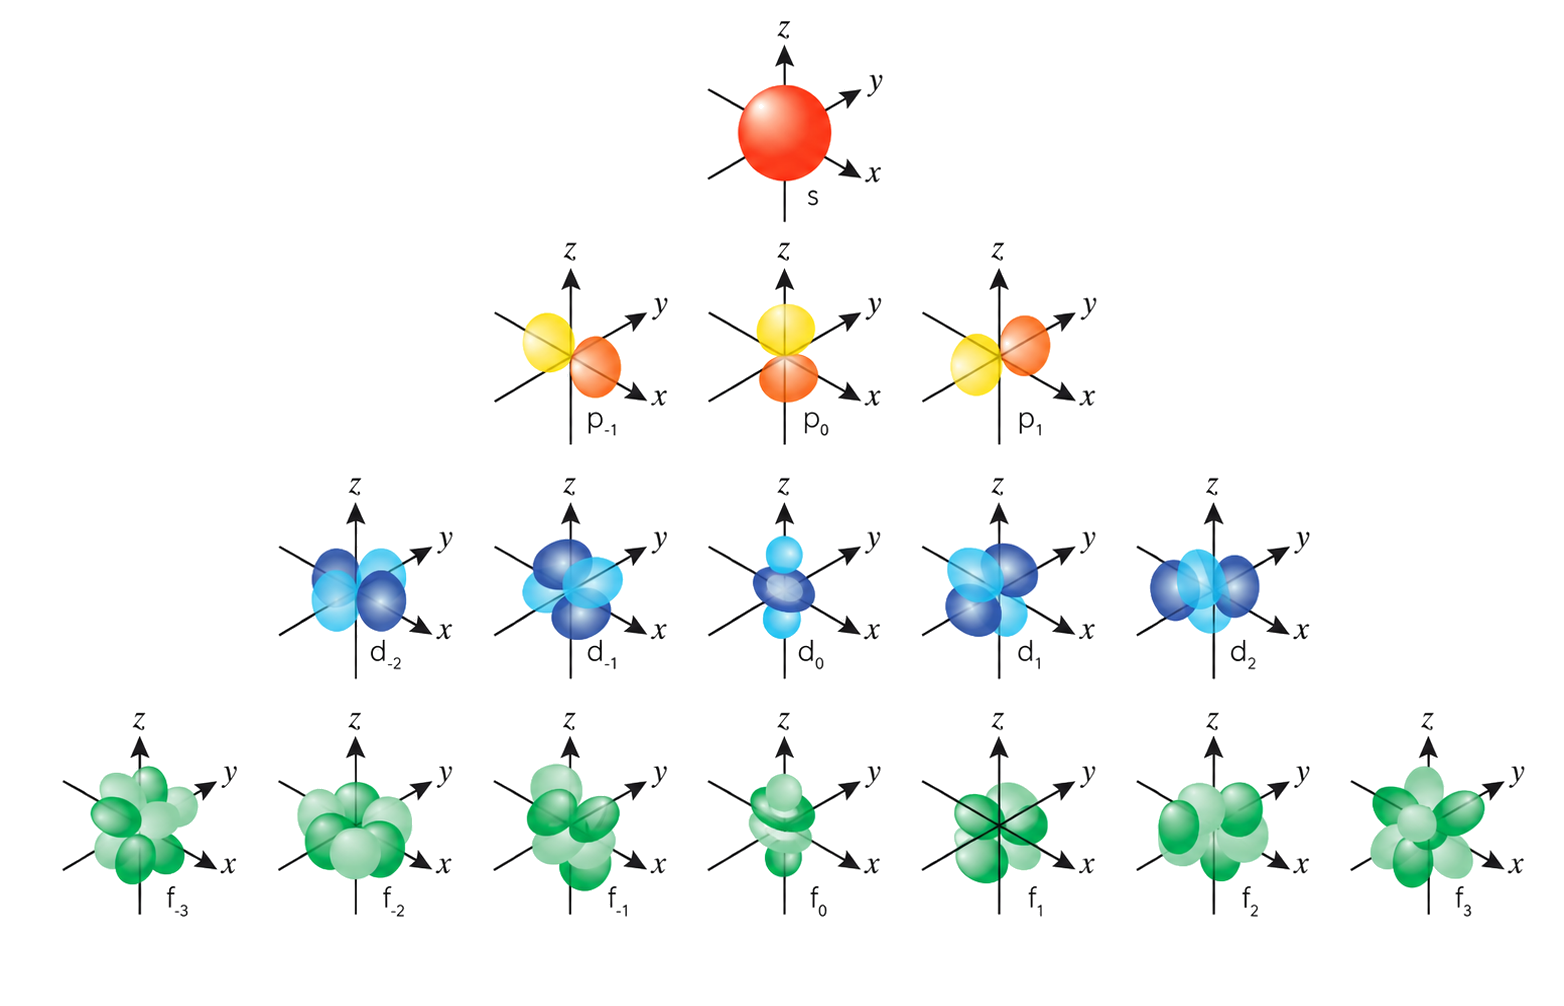
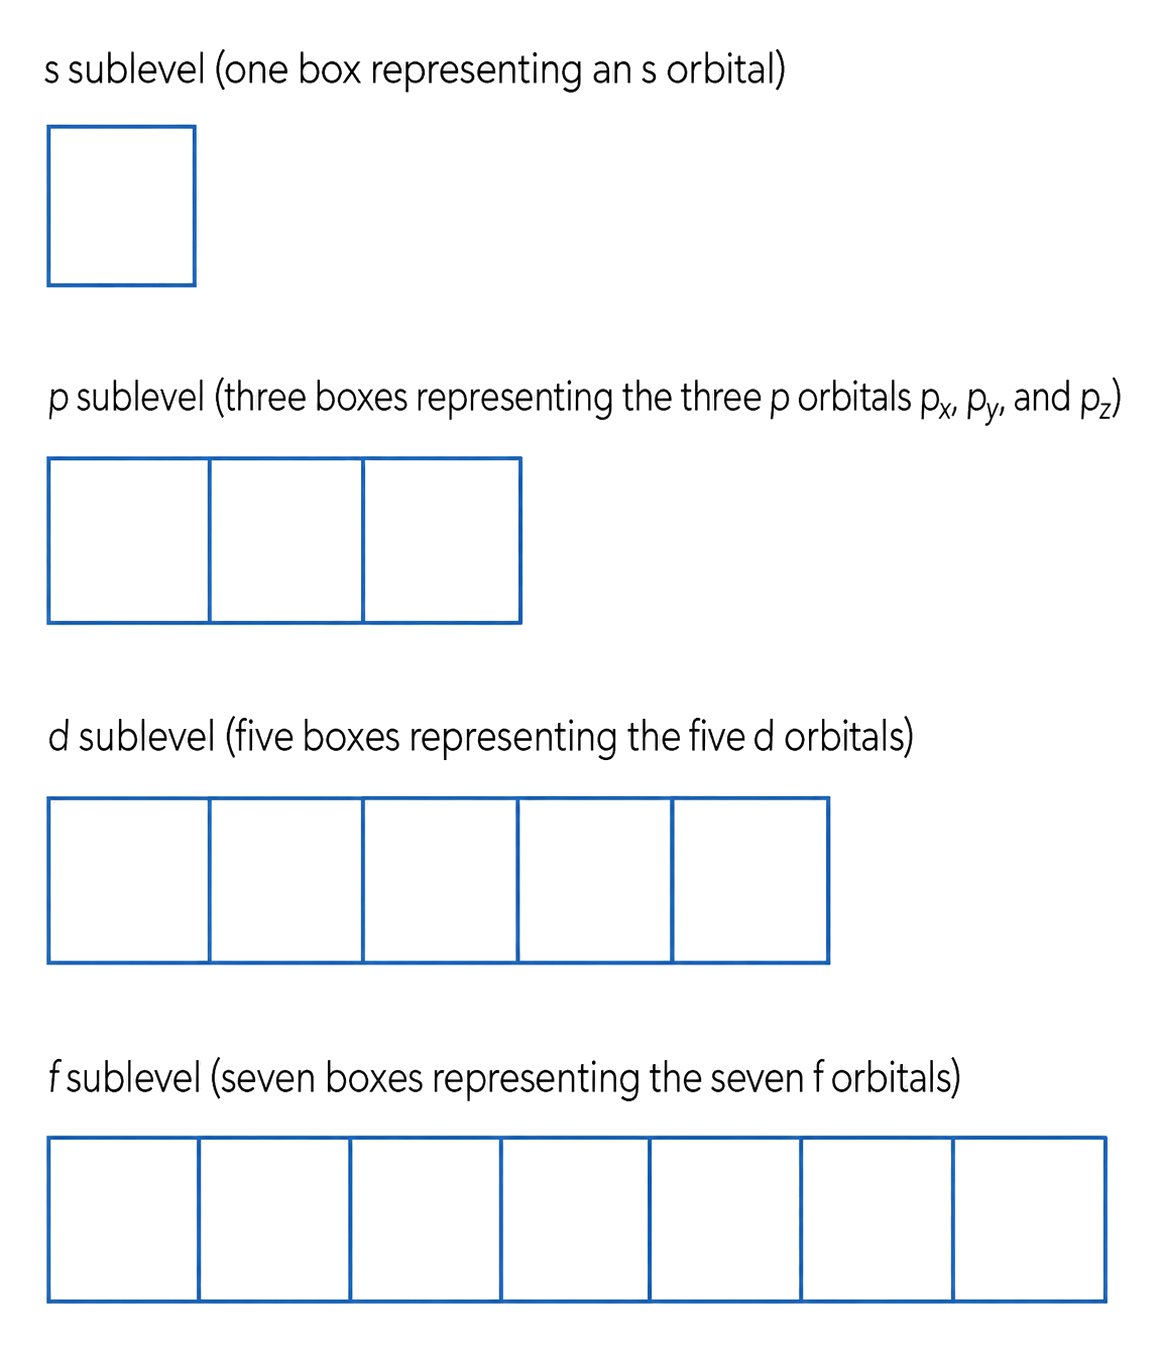
A spherical s orbital and three perpendicular dumbbell-shaped p orbitals are linked to the orbital hierarchy and periodic-table blocks.
Sublevel Number of orbitals Maximum electrons Assessed shape evidence Periodic-table block
s 1 2 spherical s block
p 3 6 three dumbbell orbitals with different orientations p block
d 5 10 shape detail not required here d block
f 7 14 shape detail not required here f block

The block is identified by the subshell being filled; sublevel capacity is not the same as actual occupancy.

For recognition questions, keep the hierarchy clear: main energy level → sublevel → orbital. The s and p shapes are the explicitly required shape evidence here.

Use the hierarchy as a classification test: a p sublevel contains three orbitals, and each orbital can hold two electrons. An orbital describes a probability region with a characteristic shape; it is not a circular route travelled by an electron.

Recognising Orbital Shapes

[ 2 ]

Sketch the shapes of two different orbital types in the second energy level and label each orbital.

Drawing canvas

Electron Configurations and Spin

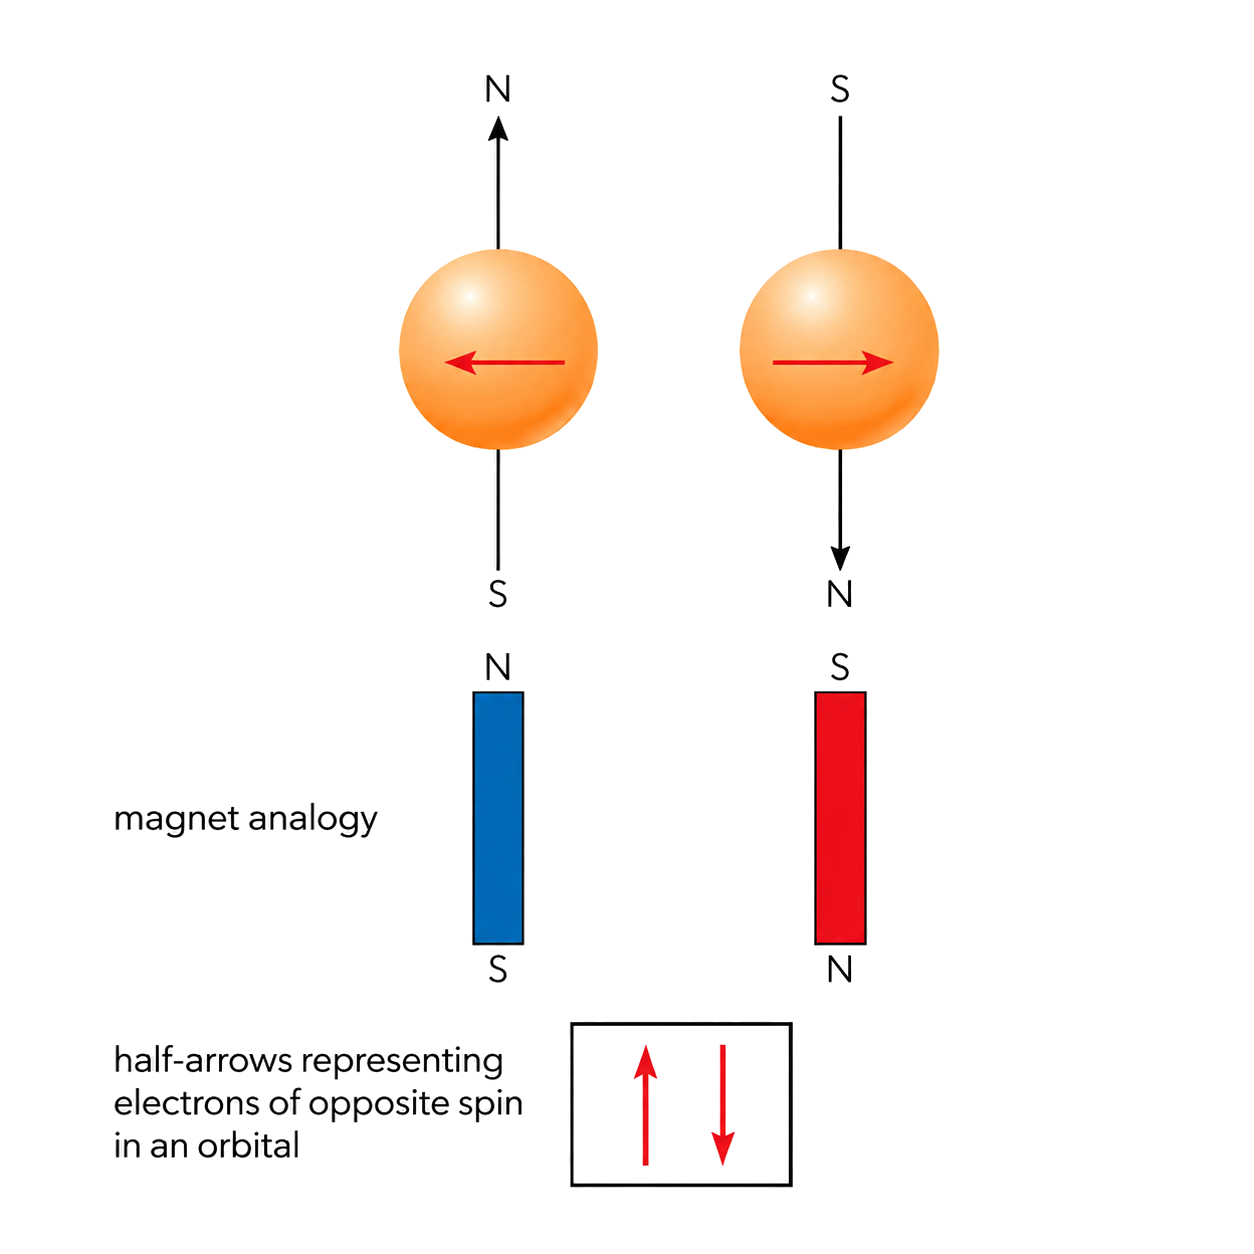
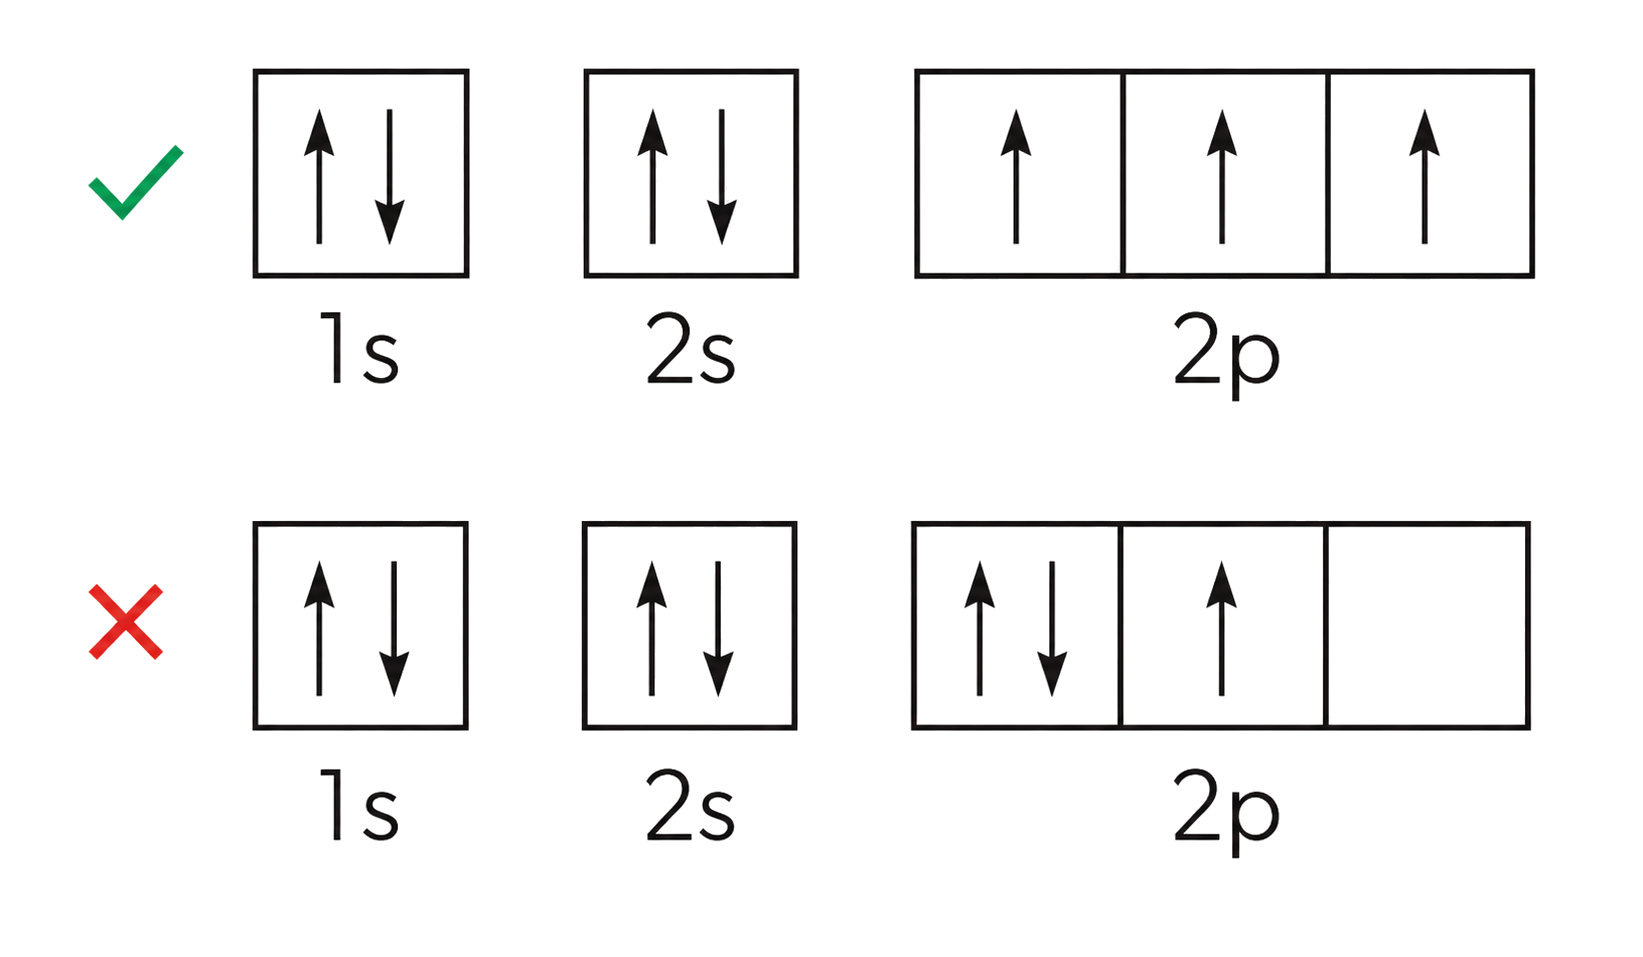
Aufbau fills lower-energy orbitals first. Pauli limits an orbital to two electrons with opposite spins. Hund's rule places electrons singly in degenerate orbitals before pairing.
A spherical s orbital and three perpendicular dumbbell-shaped p orbitals are linked to the orbital hierarchy and periodic-table blocks.
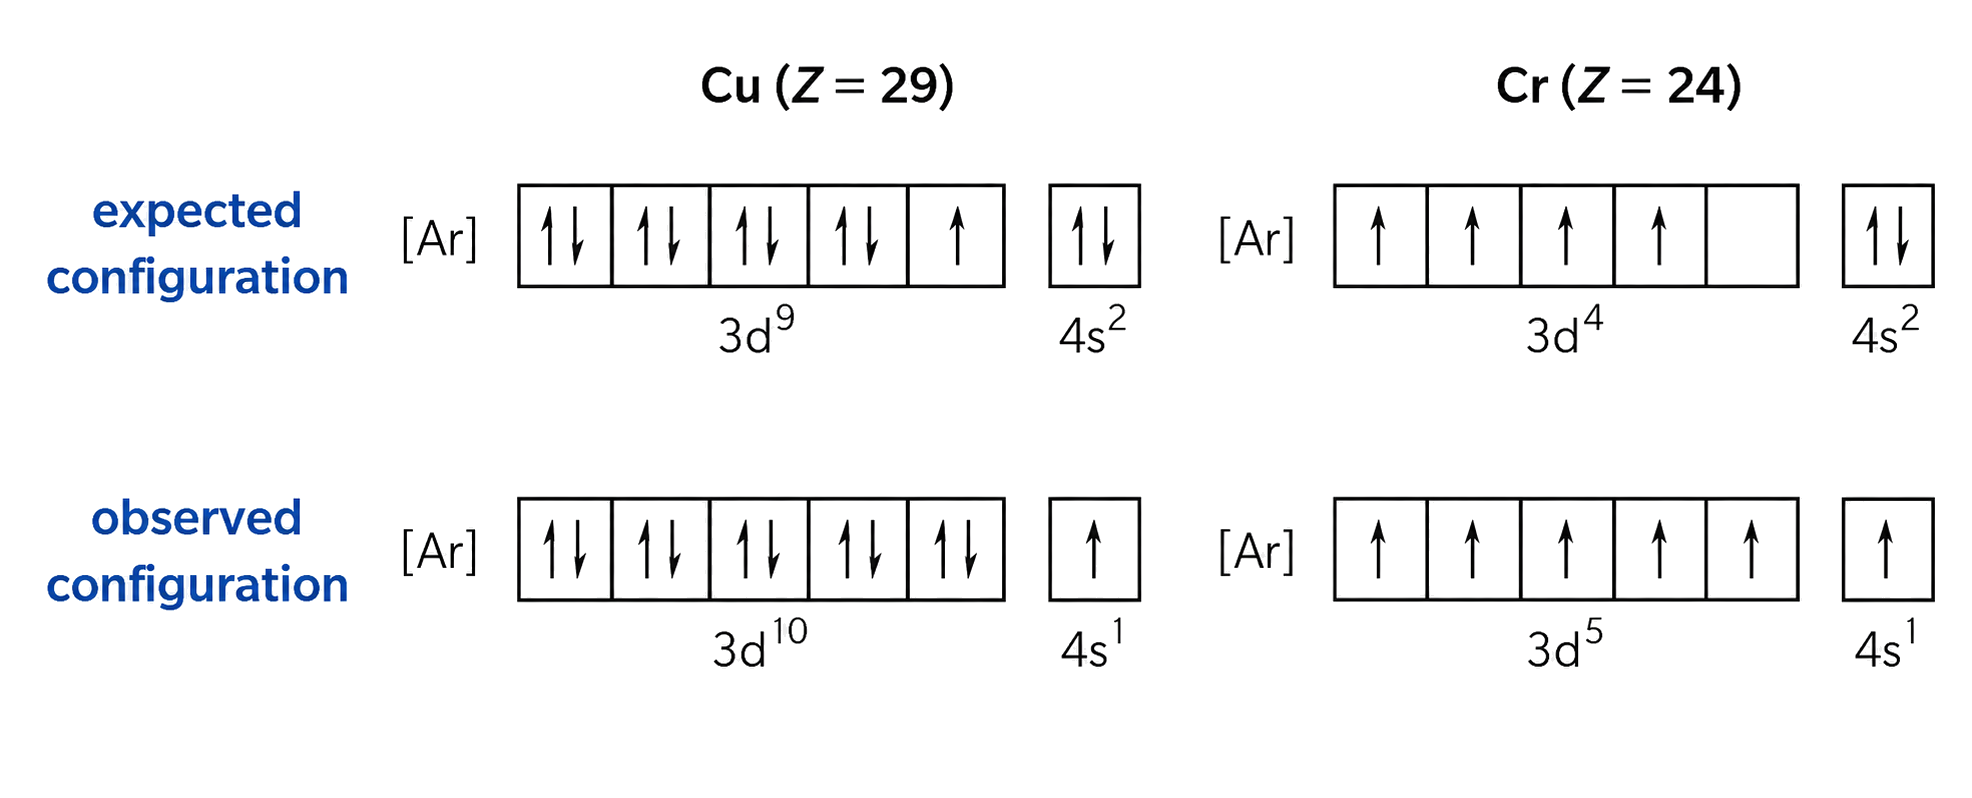
Orbital boxes fill from lower to higher energy, singly before pairing and with opposite paired spins, with separate corrected rows for chromium and copper.
Representation Use
Full configuration Show the complete filling sequence
Condensed configuration Replace the inner electrons with a noble-gas core
Orbital-box diagram Show orbital occupancy and opposite-spin pairing

For ions, remove 4s electrons before 3d electrons. The exceptions in scope are Cr: [Ar] 4s1 3d5 and Cu: [Ar] 4s1 3d10.

Check total electrons, obey the filling order, apply Hund and Pauli in each sublevel, and treat the Cr/Cu exceptions explicitly rather than forcing the naive pattern.

Build an orbital diagram by checking electron total, energy order, single occupation of equal-energy orbitals, then opposite-spin pairing. For transition-metal ions remove 4s electrons before 3d, and verify Cr and Cu against the stated exceptions rather than forcing the simple filling pattern.

Worked ion check: Fe has 26 electrons and condensed configuration [Ar] 4s² 3d⁶. To form Fe³⁺, remove the two electrons from the highest principal level, 4s, before removing one 3d electron, giving [Ar] 3d⁵. The final superscripts total 23 electrons, matching 26 − 3.

Constructing Electron Configurations

[ 2 ]

Draw the orbital diagram of the phosphorus atom in the ground state by adding, filling and labelling the orbitals. Use section 7 of the data booklet.

2s

1s

Drawing canvas

First Ionization Energy

HL only

First ionization energy is the energy required to remove one mole of electrons from one mole of gaseous atoms. The convergence limit in an emission spectrum corresponds to ionization.
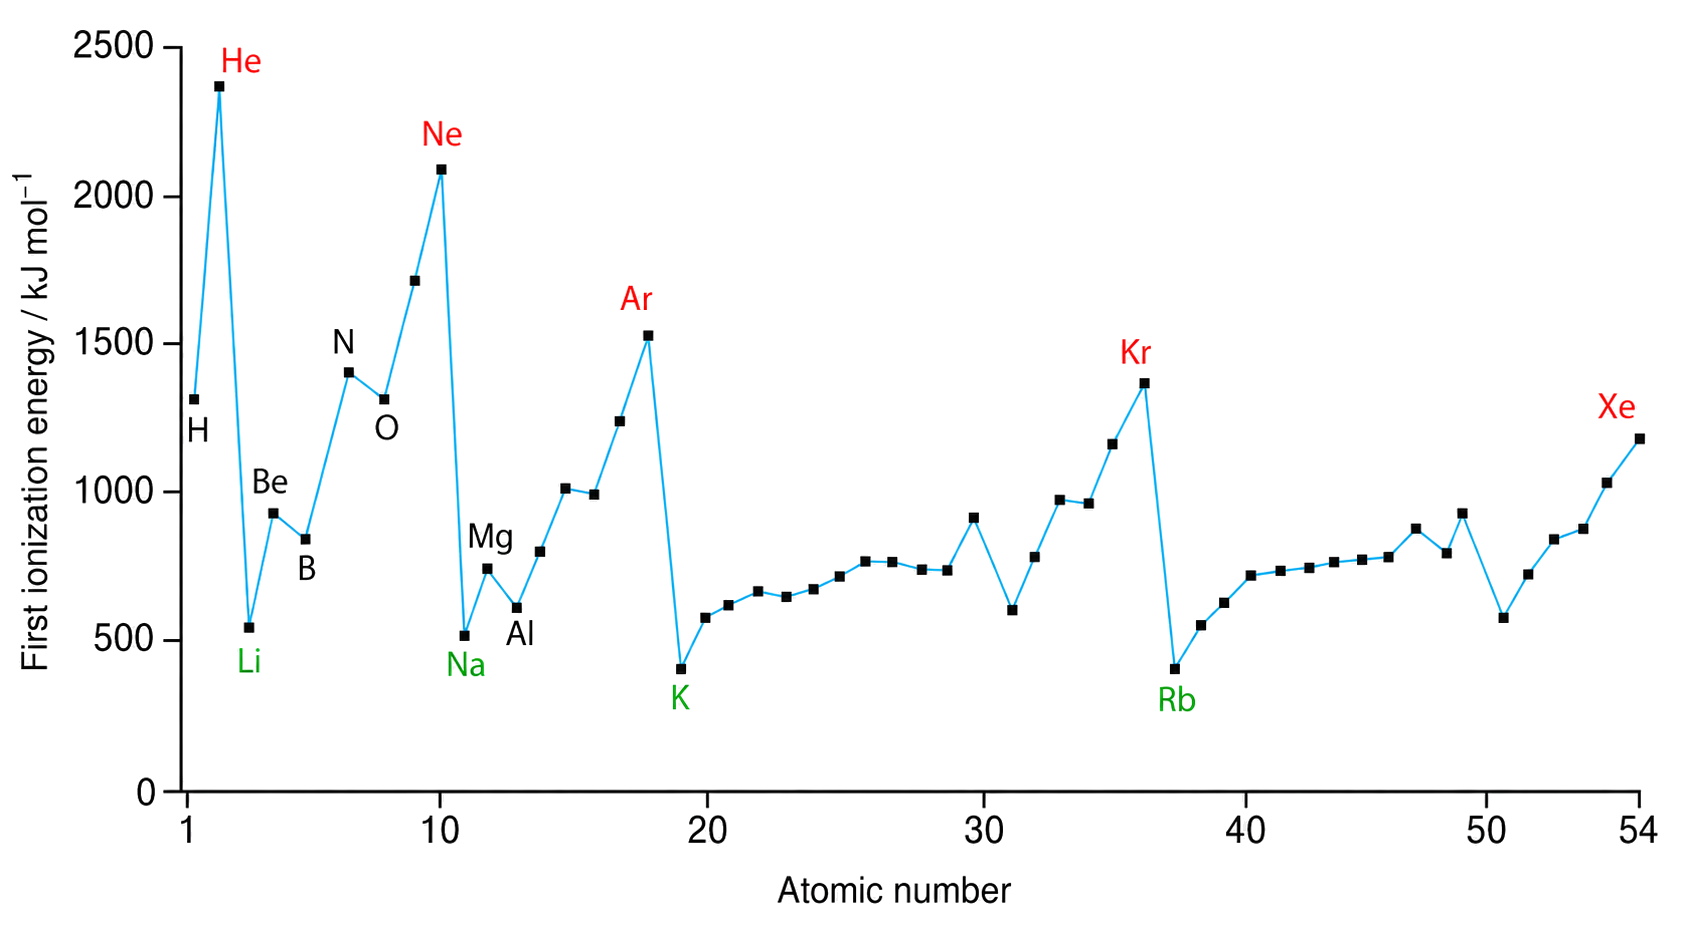
noble-gas maxima occur at He, Ne, Ar, Kr, and Xe; post-noble-gas minima occur at Li, Na, K, and Rb; highlighted element labels and atomic-number positions match the source; major within-period discontinuities are preserved.
Trend Explanation
Across a period Generally increases as effective nuclear charge increases
Down a group Generally decreases because the outer electron occupies a higher shell
Be → B dip The electron removed from B is in a higher-energy p subshell
N → O dip Pairing in a p orbital makes one electron easier to remove

E=hfandc=λfE = hf and c = λf

Worked example — hydrogen convergence limit

The local course book gives λ=9.12×10⁻⁸ m\lambda=9.12\times10^{-8}\,\mathrm{m}. First, f=c/λ=(3.00×108 m s−1)/(9.12×10−8 m)=3.29×10¹⁵ s−1f=c/\lambda=(3.00\times10^8\,\mathrm{m\,s^{-1}})/(9.12\times10^{-8}\,\mathrm{m})=3.29\times10^{15}\,\mathrm{s^{-1}}. Then Ephoton=hf=(6.63×10⁻³⁴ J s)(3.29×10¹⁵ s−1)=2.18×10⁻¹⁸ JE_{\text{photon}}=hf=(6.63\times10^{-34}\,\mathrm{J\,s})(3.29\times10^{15}\,\mathrm{s^{-1}})=2.18\times10^{-18}\,\mathrm{J}. Convert one-photon energy to one mole and joules to kilojoules: IE=(2.18×10⁻¹⁸)(6.02×10²³)/1000=1.31×103 kJ mol−1IE=(2.18\times10^{-18})(6.02\times10^{23})/1000=1.31\times10^3\,\mathrm{kJ\,mol^{-1}}. This is the molar energy for the first ionization process H(g)→H+(g)+e−\mathrm{H(g)\rightarrow H^+(g)+e^-}.

At the convergence limit, convert wavelength or frequency to energy per photon with E = hf, then multiply by the Avogadro constant and convert J mol⁻¹ to kJ mol⁻¹. Across-period trends are general patterns; subshell energy and electron pairing explain the named dips.

X(g)→X+(g)+e−firstionizationenergyinkJmol−1X(g) → X⁺(g) + e⁻ first ionization energy in kJ mol⁻¹

Explaining and Calculating Ionization Energy

HL only

[ 2 ]

Determine the frequency of electromagnetic radiation, in s−1\mathrm{s}^{-1}, equivalent to the first ionization energy of phosphorus. Use sections 1, 2 and 9 of the data booklet.

Successive Ionization Energies

HL only

Successive ionization energies rise as electrons are removed. A very large increase occurs when removal crosses from the outer shell into a lower, more tightly held shell.
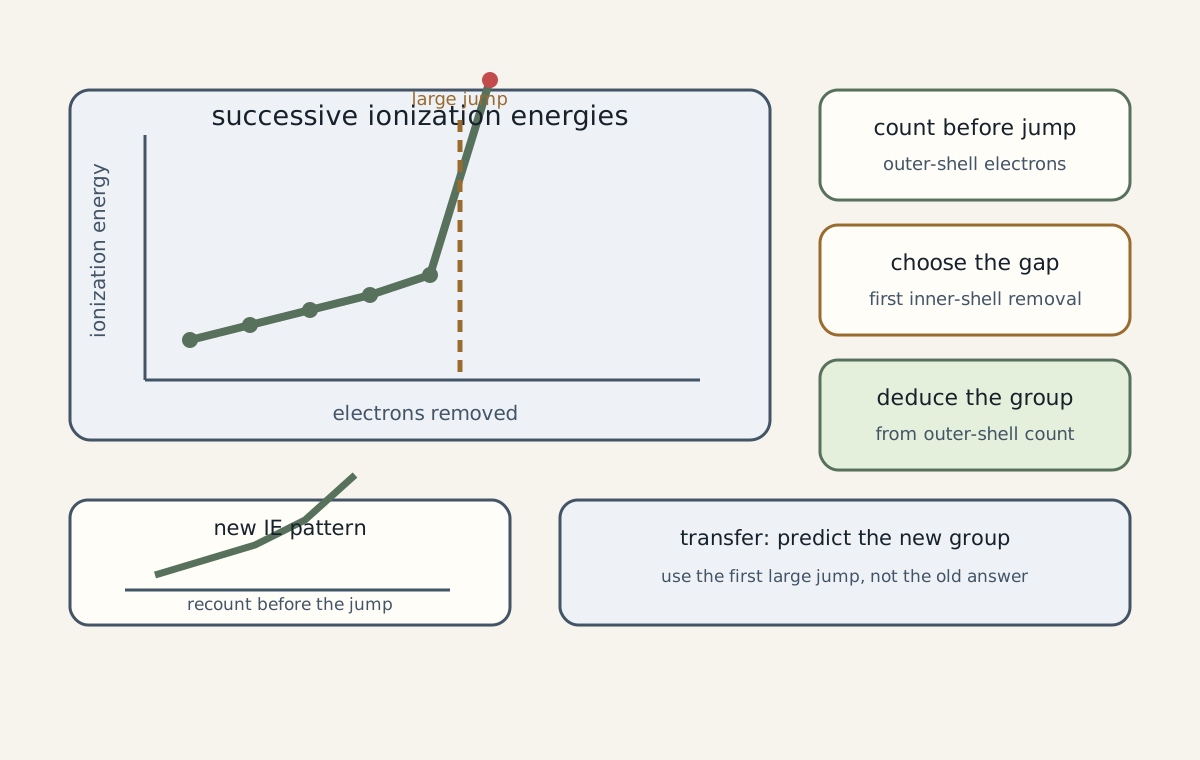
Successive ionization energies rise modestly until a large jump marks removal of the first core electron, revealing the number of valence electrons.
Observation Deduction
Small increases before the large jump Electrons are being removed from the same outer shell
Large jump The next electron is from an inner shell
Number removed before the jump Outer-electron count and group pattern

Use the position of the first large jump, not its numerical size alone, to infer the group.

A jump after three outer-electron removals is the pattern used in the study guide for a group 13 element. The same count-before-the-jump method applies to new data.

Locate the first order-of-magnitude jump before naming the group. A large jump after the second electron is removed shows two outer-shell electrons; the third electron would come from a lower shell, supporting a group 2 assignment.

Electron Configurations Summary

Retrieve the chain: emission lines reveal discrete levels; capacities, sublevels, orbitals, and spin rules build configurations; first and successive ionization energies then reveal how electrons are held and arranged.

When checking an answer, ask: Did I link a line to a transition? Did I use 2n² and the filling rules? Did I explain an ionization trend or count electrons before a successive-IE jump?

1.4 The mole

Syllabus
First assessment 2025
Topic
1.4
Level
HL

The Mole and Particle Number

The mole is the SI unit for amount of substance. One mole contains the Avogadro constant number of specified entities, such as atoms, molecules, ions, or electrons.

N=nNawhereNa=6.022×10²³mol−1N = nNₐ where Nₐ = 6.022 × 10²³ mol⁻¹

Identify which entity the question asks for, then multiply the amount in moles by Avogadro's constant and by the number of those entities in each formula unit or molecule when needed.

Specify the entity before calculating. One mole of H₂O contains one mole of molecules, two moles of H atoms and one mole of O atoms; multiplying by Nₐ without the formula-unit multiplier answers a different particle question.

Converting Moles to Entities

[ 1 ]

How many ions are present in 0.20 mol of (NH4)2SO4\left(\mathrm{NH}_{4}\right)_{2} \mathrm{SO}_{4} ?

Relative Atomic and Formula Mass

Relative atomic mass is a weighted mean relative to one twelfth of the mass of a carbon-12 atom. Relative formula mass is the sum of the relative atomic masses represented in the formula.

Mr=Σ(Ar×subscript)M_r = Σ(A_r × subscript)

Relative atomic mass and relative formula mass are ratios on the carbon-12 scale, so they have no units. Apply every subscript, including waters of crystallization or repeated ions.

For Ca(OH)₂, include both bracketed groups: Mᵣ = Aᵣ(Ca) + 2[Aᵣ(O) + Aᵣ(H)]. Keep Mᵣ dimensionless; attach g mol⁻¹ only when the same numerical total is used as a molar mass.

Applying Relative Masses

[ 1 ]

Define the term relative atomic mass (Ar)\left(A_{\mathrm{r}}\right).

Molar Mass Conversions

Molar mass is the mass of one mole of a substance, measured in g mol⁻¹. It connects mass, amount, and particle number in a conversion chain.

n=m/Mandm=nMn = m/M and m = nM

To reach particles from mass, divide mass by molar mass to obtain moles, then use the Avogadro conversion and count the requested entities if the formula contains more than one.

Use units to choose the direction: 9.0 g of H₂O divided by 18.0 g mol⁻¹ gives 0.50 mol. To find molecules, continue from moles to nNₐ; do not multiply mass directly by the Avogadro constant.

Solving Molar-Mass Problems

[ 2 ]

Calculate the number of hydrogen atoms in 1.00 g of propan-2-ol.

Empirical and Molecular Formulae

An empirical formula gives the simplest whole-number ratio of atoms. A molecular formula gives the actual number of each atom in a molecule.

Step Operation
1 Convert each composition value to moles
2 Divide all mole values by the smallest
3 Multiply to reach the simplest whole-number ratio
4 Write the empirical formula
5 Divide molecular molar mass by empirical-formula mass and multiply every subscript by that integer

Keep the empirical ratio simplest, and make sure the molecular-formula multiplier is a whole number consistent with the given molar mass.

A composition of 40.0% C, 6.7% H and 53.3% O gives the simplest ratio CH₂O after division by atomic masses. If the molar mass is 180 g mol⁻¹, compare it with the empirical-formula mass 30 to obtain the multiplier 6 and molecular formula C₆H₁₂O₆.

Do not round a ratio such as 1 : 1.50 : 1 to 1 : 2 : 1. Preserve the calculated values and multiply every ratio by the same small integer: ×2 converts halves, while ×3 can resolve values close to thirds such as 1.33 or 1.67. Round only after the common multiplier produces values consistent with the data precision.

Deriving Chemical Formulae

[ 3 ]

4.32 g of the compound was combusted completely in oxygen and produced 9.49 g of CO2\mathrm{CO}_{2} and 5.18 g of H2O\mathrm{H}_{2} \mathrm{O}.
Determine the empirical formula of the compound, using sections 1 and 7 of the data booklet.

Molar Concentration

Molar concentration is the amount of solute in moles per cubic decimetre of solution. Square brackets can denote molar concentration.

n=VCthereforeC=n/Vn = VC therefore C = n/V

Use V in dm³ when calculating C in mol dm⁻³. Rearrange the same relationship to find amount or volume, and keep the solution volume distinct from the solute mass.

Convert volume before substitution: 500 cm³ = 0.500 dm³, so 0.250 mol in that solution gives C = 0.500 mol dm⁻³. The denominator is the final solution volume, not the volume or mass of solute alone.

Fordilutionwithnosolutelossorreaction:nbefore=nafter,soc1V1=c2V2For dilution with no solute loss or reaction: n_before = n_after, so c₁V₁ = c₂V₂

Adding solvent increases the final solution volume while the amount of solute stays constant, so concentration decreases. Use the final solution volume—not the solvent volume added—and do not apply c₁V₁ = c₂V₂ when solute reacts or is removed.

Calculating Concentration

[ 2 ]

Calculate the molar concentration of the resulting solution of lithium hydroxide.

Avogadro's Law and Gas Volumes

At the same temperature and pressure, equal volumes of gases contain equal numbers of molecules. Under the same conditions, gas-volume ratios follow mole ratios.

Vgas=nVmV_gas = nV_m

Balance the equation, identify the limiting gas amount when needed, apply the coefficient ratio to gas volumes at the same temperature and pressure, then convert to the requested volume units.

For N₂ + 3H₂ → 2NH₃ at one temperature and pressure, one gas volume of N₂ requires three equal gas volumes of H₂ and forms two of NH₃. This direct volume ratio works because the gases share conditions; otherwise convert through moles.

Using Gas-Volume Ratios

[ 2 ]

140.0 cm3140.0 \mathrm{~cm}^{3} of ethyne are reacted with 160.0 cm3160.0 \mathrm{~cm}^{3} of hydrogen in a container at 420 K and 1.00×10⁵ Pa1.00 \times 10^{5} \mathrm{~Pa}. Ethane is the only product.

Determine the maximum possible volume of ethane formed under these conditions of temperature and pressure.

The Mole Summary

Retrieve the quantitative chain: count entities with mN_A, sum relative masses from formulae, convert mass with n=m/M, derive formula ratios, use n=VC for solutions, and apply gas-volume ratios at the same temperature and pressure.

Before finalising, check the requested entity, formula subscripts, units, dm³ conversion, balanced-equation coefficients, and any limiting reactant.

1.5 Ideal gases

Syllabus
First assessment 2025
Topic
1.5
Level
HL

The Ideal Gas Model

Assumption Ideal-gas statement
Particle motion Particles move continuously
Particle volume Particle volume is negligible compared with the gas volume
Intermolecular forces Forces between particles are negligible
Collisions Collisions are elastic

An ideal gas is a simplified particle model. Use its assumptions as a checklist before deciding whether PV=nRT is a suitable description of a real sample.

Use the assumptions to make predictions: compressing a gas until particle volume is no longer negligible weakens the model, while raising temperature usually reduces the relative importance of attractions. Ideal particles still move and collide; only the collisions are treated as elastic.

Gas pressure arises from particle collisions with the container walls and the associated momentum transfer. At a higher Kelvin temperature, the greater average kinetic energy established in Structure 1.1.3 changes the collision behaviour; this does not replace the separate assumptions that particle volume and intermolecular attractions are negligible.

When Real Gases Deviate

Real gases deviate most from ideal behaviour at low temperature and high pressure. Low temperature reduces particle kinetic energy, while high pressure brings particles close together.
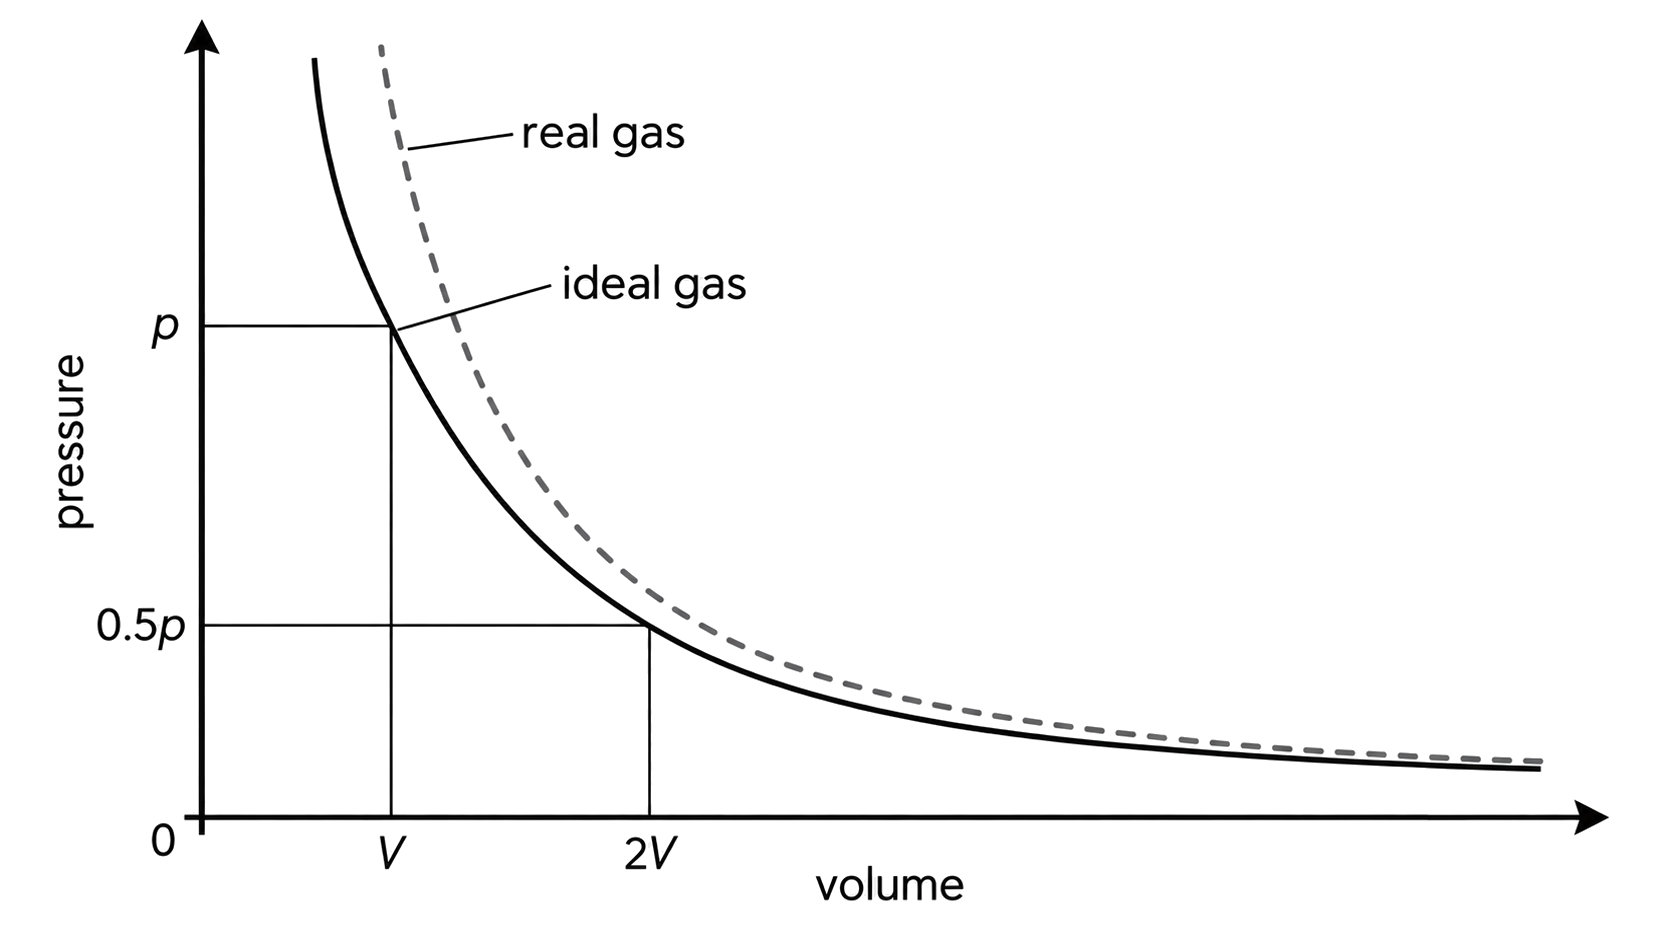
pressure is vertical and volume is horizontal; the ideal-gas curve passes through (V,p) and (2V,0.5p); the real-gas curve deviates from the inverse ideal relationship; solid and dashed curve labels are unambiguous.
Ideal assumption that fails Real-gas consequence
Intermolecular forces are negligible Attractions matter when particles have low kinetic energy and are close
Particle volume is negligible Finite molecular volume matters at very high pressure

A strong explanation names the condition, identifies the failed ideal assumption, and links it to the observed deviation.

Diagnose the cause from the condition. Cooling makes attractive forces more important because particle kinetic energy is lower; strong compression exposes both attractions and finite particle volume. Name the failed ideal assumption rather than stating only that the gas is 'non-ideal'.

Explaining Real-Gas Behaviour

[ 2 ]

Outline why the volume occupied by propane(g) at very high pressure is higher than the value calculated using PV=nRT.

Molar Volume and Gas Relationships

Molar volume is the volume occupied by one mole of gas at a specified temperature and pressure. At STP as used by the current IB data context (273.15 K and 100 kPa), Vₘ is approximately 22.7 dm³ mol⁻¹; a different condition requires its own value.

Forfixedamountandtemperature:P∝1/VFor fixed amount and temperature: P ∝ 1/V

Read pressure–volume graphs as an inverse relationship, not simply as one quantity increasing while the other decreases. At STP, use the stated molar volume with the balanced-equation mole ratio.

Attach conditions to every molar volume. Once Vₘ is valid for the stated temperature and pressure, convert gas volume to moles, apply the balanced-equation ratio, then convert back if needed. Do not carry one tabulated Vₘ into a different set of conditions.

Fixed amount of gas; held constant Relationship Graph/interpretation check
temperature P ∝ 1/V P–V is inverse, not a straight decreasing line
pressure V ∝ T V–T is linear only with T in kelvin
volume P ∝ T P–T is linear only with T in kelvin

State the fixed variable and use absolute temperature before interpreting a gas graph.

Applying Molar Volume

[ 1 ]

Deduce the relationship between the pressure and volume of the sample of carbon dioxide gas.

Using the Ideal Gas Equation

PV=nRTPV = nRT

P1V1/T1=P2V2/T2P₁V₁/T₁ = P₂V₂/T₂

Worked example — amount and molar mass from gas data

The local course book gives P=101.3 kPaP=101.3\,\mathrm{kPa}, V=1.91 dm3V=1.91\,\mathrm{dm^3}, m=3.30 gm=3.30\,\mathrm{g} and T=150 ∘C=423.15 KT=150\,^\circ\mathrm{C}=423.15\,\mathrm{K}. Because kPa dm3=J\mathrm{kPa\,dm^3=J}, use R=8.31 J mol−1 K−1R=8.31\,\mathrm{J\,mol^{-1}\,K^{-1}}: n=PV/(RT)=(101.3×1.91)/(8.31×423.15)=0.0550 moln=PV/(RT)=(101.3\times1.91)/(8.31\times423.15)=0.0550\,\mathrm{mol}. Then M=m/n=3.30 g/0.0550 mol=60.0 g mol−1M=m/n=3.30\,\mathrm{g}/0.0550\,\mathrm{mol}=60.0\,\mathrm{g\,mol^{-1}}. The final value is the mass of one mole of the vaporized compound under the stated ideal-gas model.

Convert Celsius to kelvin before substitution, and make pressure and volume units consistent with the chosen gas constant. Rearrange the equation only after the known quantities and units are identified.

Before solving, write a unit line beside P, V and T. With R = 8.31 J mol⁻¹ K⁻¹, use pressure in Pa, volume in m³ and temperature in K; using kPa with dm³ is also consistent because kPa·dm³ equals J. Judge model suitability before trusting the numerical result.

Solving Ideal-Gas Problems

[ 2 ]

0.108 g of the vaporized compound was found to have a volume of 55.7 cm355.7 \mathrm{~cm}^{3} at 100∘C100^{\circ} \mathrm{C} and a pressure of 1.00×10⁵ Pa1.00 \times 10^{5} \mathrm{~Pa}.
Calculate the amount, in moles, of the compound. Use sections 1, 2 and 4 of the data booklet.

Ideal Gases Summary

Retrieve the model: ideal particles have negligible volume and forces with elastic collisions; low temperature and high pressure expose real-gas limits; molar volume and PV=nRT then connect amount, pressure, volume, and temperature.

Before calculating, check whether the question uses STP molar volume or PV=nRT, identify the fixed conditions, convert temperature to kelvin, and align pressure and volume units.