IB Maths AI SL Statistics: Data, Models, and Interpretation
Revise IB Maths AI SL statistics through averages, spread, correlation, regression, probability, and interpretation that earns method marks.
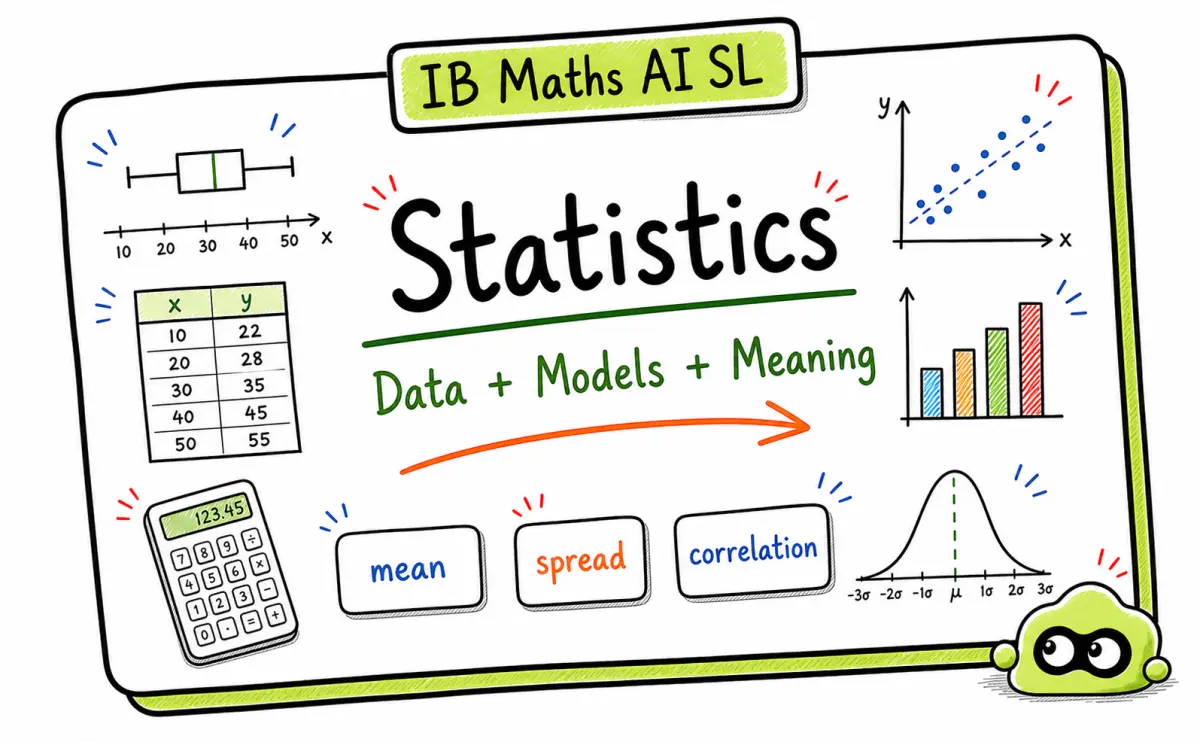
Statistics marks in Maths AI rarely come from the number alone. The calculator can give you a mean, standard deviation, correlation coefficient, regression equation, or probability. The mark often sits in the sentence after the calculation.
That sentence has to explain what the number means in the context of the data. If the data are about reaction time, school attendance, sales, height, rainfall, or test scores, your answer must return to that context. Otherwise it reads like a calculator display, not an exam answer.
Use these EduNinja pages as your base:
Open one topic first. Do not turn revision into tab collecting. Read the note, answer a question, then write down the phrase your answer was missing.
Quick answer
For IB Maths AI SL statistics, the safest rule is simple: calculate, then interpret.
- Mean and median describe centre, but they react differently to outliers.
- Standard deviation and IQR describe spread, but they answer different comparison questions.
- Correlation describes association, not causation.
- Regression predictions need a range check before you trust them.
- Probability answers need units, conditions, and context.
If your final line could apply to any data set, it is probably too vague.
Statistics topics covered in Maths AI SL
| Area | What students need to do | Common mark loss |
|---|---|---|
| Measures of centre | Choose and interpret mean, median, and mode. | Saying "average" without explaining what it means in context. |
| Measures of spread | Compare range, IQR, variance, or standard deviation. | Comparing spread without saying which data set is more consistent. |
| Scatter diagrams | Describe direction, form, and strength. | Saying "positive correlation" and stopping there. |
| Regression | Use a model for prediction and interpret the slope or intercept. | Extrapolating beyond the data range without caution. |
| Probability | Work with conditional language, expected values, and tree or table setups. | Ignoring the condition or sample space. |
| Box plots and cumulative frequency | Read quartiles, median, IQR, percentiles, and compare distributions. | Comparing only medians without discussing spread. |
| Normal distribution | Use mean, standard deviation, and probabilities from the model. | Treating every data set as normal without checking the context. |
| Technology/GDC output | Use calculator results and explain them in context. | Copying calculator output without interpretation. |
The statistics habit that gets marks
Statistics is not just choosing the right formula. The exam wants to know whether you understand what the statistic says about the situation.
Before writing the final answer, ask:
- What does this number measure?
- What are the units?
- Which group or variable does it describe?
- Is the data skewed or affected by outliers?
- Is the model being used inside the data range?
- Does the question ask for a comparison or a decision?
Those checks stop you from writing a technically correct number with a weak interpretation.
| Idea | What it means | How it earns marks |
|---|---|---|
| Mean | A balance point for the data | Useful when outliers do not distort the result too much. |
| Median | The middle value | Often better for skewed data or data with extreme values. |
| Standard deviation | Spread around the mean | Helps compare consistency. |
| IQR | Spread of the middle 50 percent | Useful when outliers affect the range or standard deviation. |
| Correlation coefficient | Direction and strength of linear association | Needs a causation warning. |
| Regression line | A model for estimating one variable from another | Needs a range and reliability check. |
GDC output is not the answer
In Maths AI statistics, the calculator often gives the value quickly. That does not mean the answer is finished.
If your GDC gives a mean, standard deviation, regression equation, correlation coefficient, or probability, write one more sentence that explains the output in context.
For example, do not stop at:
r = 0.82mean = 56.4y = 4.2x + 15
Add what the value means:
r = 0.82shows a strong positive linear association between revision time and test score.- A mean of
56.4means the average score for this group was about56.4marks. - The model predicts that each extra hour of practice is associated with about
4.2more marks.
The GDC gives the value. You still have to give the meaning.
Mean vs median: do not just choose the one you like
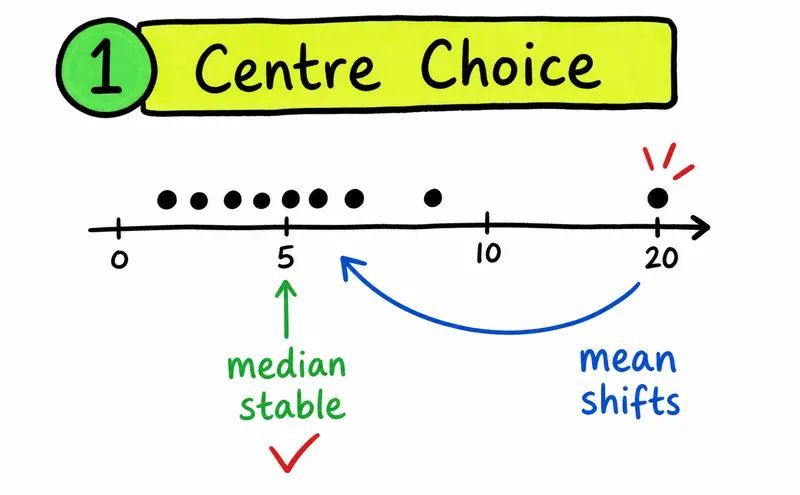
Students often write "median is better because of outliers" as if it works for every question. It does not. You need to check the shape of the data.
Use the mean when the data are reasonably balanced and you want to use every value. Use the median when the data are skewed or include an extreme value that would pull the mean away from the typical result.
Weak:
- Median is better because it is more accurate.
Better:
- The median is better because the high outlier would increase the mean and make the typical value look larger than it is.
That last phrase is where the mark usually sits.
Standard deviation and IQR: what spread means
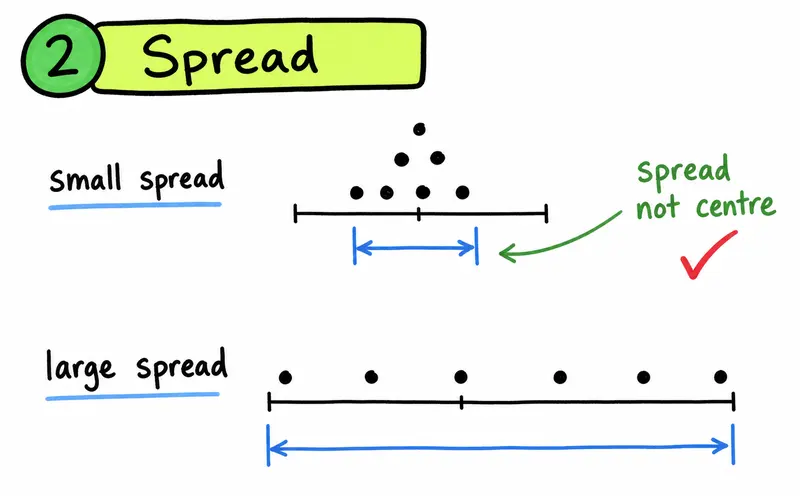
Spread tells you how consistent the data are.
A lower standard deviation means the values are closer to the mean, assuming the comparison is sensible. A smaller IQR means the middle half of the data is more tightly grouped.
When comparing two data sets, do not only compare the averages. Pair centre with spread.
For example:
- Group A has a higher mean score, but Group B has a smaller standard deviation.
- That means Group A did better on average, while Group B was more consistent.
This is stronger than saying one group is simply "better."
Box plots and cumulative frequency: compare more than the median
Box plots and cumulative frequency questions often test whether you can compare distributions, not just read one value.
When comparing two distributions, mention:
- median for centre
- IQR or range for spread
- outliers if they are shown
- context from the question
Weak:
- Group A is higher.
Better:
- Group A has a higher median, so its typical value is higher. Group B has a smaller IQR, so its middle 50 percent is more consistent.
For cumulative frequency graphs, read values carefully from the axes. Quartiles and percentiles are estimates from the graph, so do not overstate their precision.
Correlation: association is not causation
A correlation coefficient near 1 means a strong positive linear association. A value near -1 means a strong negative linear association. A value near 0 means little or no linear association.
It does not prove causation.
If the question asks you to interpret correlation, include three parts:
- strength
- direction
- context
Example:
- There is a strong positive linear association between revision time and test score. Students who revised for longer tended to score higher, but the correlation alone does not prove that revision time caused the higher score.
That answer is longer than "strong positive correlation," but it earns more.
Regression: check the range before predicting
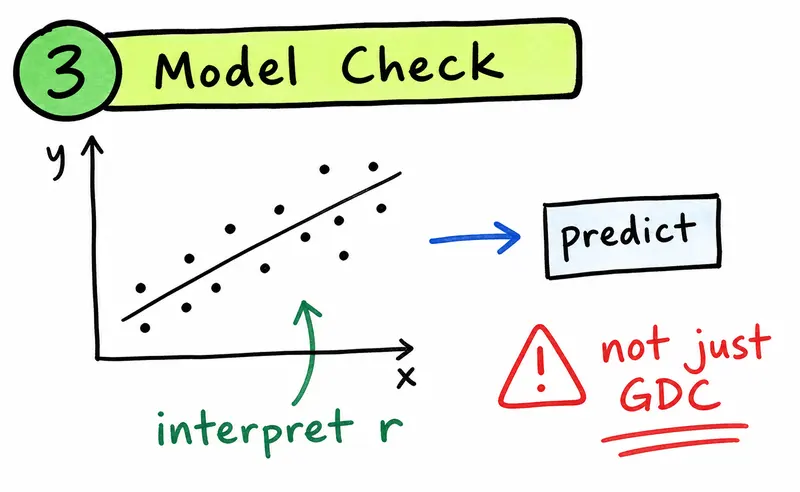
Regression questions often test whether you trust the model too much.
Before using a regression line, check:
- Is the relationship roughly linear?
- Is the prediction inside the data range?
- Is the correlation strong enough to make the model useful?
- Does the context make the prediction sensible?
Interpolation means predicting inside the data range. That is usually safer. Extrapolation means predicting outside the data range. That needs a warning.
Weak:
- The predicted value is 72.
Better:
- The model predicts a score of 72. This is reasonable if the input value is within the data range and the scatter plot shows a clear linear pattern.
Normal distribution: model first, probability second
For normal distribution questions, identify the mean, standard deviation, and the value or probability being asked for. The model only makes sense if the context can reasonably be treated as approximately normal.
A good answer should say what the probability refers to.
Weak:
- The probability is
0.23.
Better:
- The probability is
0.23, so about 23 percent of students are expected to score below this mark, assuming the scores follow the normal model.
If the question asks whether the model is suitable, do not only calculate. Comment on the shape, outliers, or whether the context makes a normal model reasonable.
Worked example 1: interpreting correlation
Question: A data set comparing revision time and test score has a correlation coefficient of 0.82. Interpret this value.
Answer:
There is a strong positive linear association between revision time and test score. Students who revised for longer tended to have higher test scores. This does not prove that revision caused the higher score.
Why this scores:
The answer gives strength, direction, context, and a causation warning.
Worked example 2: choosing median over mean
Question: A small data set includes one very large outlier. Why might the median be a better measure of centre than the mean?
Answer:
The outlier would pull the mean upwards, so the mean may not represent a typical value. The median is less affected by the extreme value, so it gives a better indication of the centre of this skewed data set.
Why this scores:
The answer does not just name the median. It explains why the outlier changes the choice.
Worked example 3: comparing standard deviation
Question: Two classes have similar mean test scores. Class A has a standard deviation of 3.1, and Class B has a standard deviation of 8.4. Compare the results.
Answer:
The classes performed similarly on average because their means are close. Class A was more consistent because its standard deviation is smaller, so its scores were closer to the mean.
Why this scores:
The answer compares centre and spread. It does not treat the mean as the whole story.
Worked example 4: using a regression model
Question: A regression line predicts y = 4.2x + 15. What does the gradient mean if x is hours of practice and y is score?
Answer:
The gradient is 4.2, so the model predicts that each extra hour of practice is associated with an increase of about 4.2 marks in score.
Why this scores:
The answer interprets the gradient in context. It says "associated with" rather than claiming proof of causation.
Worked example 5: probability in context
Question: The probability that a student is late is 0.18. In a group of 50 students, estimate how many students are expected to be late.
Answer:
Expected number = 0.18 x 50 = 9
About 9 students are expected to be late.
Why this scores:
The answer uses the probability as a proportion of the group and returns to the student context.
Worked example 6: conditional probability
Question: In a class, 18 students study Biology, 12 study Chemistry, and 7 study both. If a student is chosen from those who study Biology, find the probability that the student also studies Chemistry.
Answer:
The condition is that the student studies Biology, so the denominator is 18.
P(Chemistry | Biology) = 7 / 18 = 0.389
The probability is about 0.389, or 38.9%.
Why this scores:
The answer uses the correct condition. It does not divide by the whole class unless the question asks for a probability from the whole class.
Question-type breakdown
| Question type | First move | What to avoid |
|---|---|---|
| Define or state | Give the exact term first | Writing a long explanation that blurs the definition. |
| Calculate | Show the statistic or formula used | Leaving the answer as a bare number. |
| Interpret | Translate the number into the data context | Saying "high," "low," or "good" without a comparison. |
| Compare | Pair centre and spread | Describing only the mean. |
| Evaluate a model | Check linearity, range, and reliability | Trusting the regression line automatically. |
| Probability | Identify the event and sample space | Ignoring the condition in the question. |
Why the final sentence matters
In Maths AI statistics, the last sentence often decides whether the answer sounds mathematical or useful.
Bare answer:
r = 0.82
Better answer:
- The value
r = 0.82shows a strong positive linear association between revision time and test score.
Best answer:
- The value
r = 0.82shows a strong positive linear association between revision time and test score. Students who revised longer tended to score higher, but this does not prove revision was the only cause.
The final version does more work. It names the statistic, interprets it, and protects the conclusion.
A short revision route for statistics
Use this when you have 30 minutes.
- Pick one skill: centre, spread, correlation, regression, or probability.
- Write the key rule from memory.
- Answer one exam-style question.
- Add the missing context sentence.
- Mark whether your answer included units, comparison, and limitations.
- Turn one missing phrase into a flashcard.
Keep the correction small. "Mention units" is useful. Rewriting the whole chapter is not.
Common mistakes that cost marks
- Saying correlation proves causation.
- Using a regression line outside the data range without warning.
- Comparing means without comparing spread.
- Saying a data set is "better" without naming the context.
- Forgetting units in a prediction or expected value.
- Calling a relationship strong without referring to the correlation coefficient or scatter plot.
- Ignoring skew or outliers when choosing mean or median.
- Forgetting that probability depends on the defined event or condition.
Exam-ready mini checklist
Before you finish a statistics answer, ask:
- Did I say what the statistic measures?
- Did I use the context from the question?
- Did I include units where needed?
- Did I compare centre and spread if there are two data sets?
- Did I avoid claiming causation from correlation?
- Did I check whether a prediction is inside the data range?
- Did I state a limitation if the model is weak?
If one answer is missing two of these, fix the interpretation before doing another question.
How EduNinja helps
Use EduNinja as a practice loop, not as another reading folder.
Start with IB Mathematics Notes to rebuild the method. Then use the IB Mathematics Question Bank to test whether you can explain the result. When you mark your answer, write the missing interpretation sentence.
For Maths AI statistics, a good study block is small:
- one statistic
- one question set
- one correction sentence
That is enough for one session. The next day, test the same skill with different data.
Teacher check: context is not optional
Do not leave the answer as a number.
A correlation coefficient, mean, standard deviation, probability, or regression prediction should be translated into the context of the data. If you compare two groups, mention both average and variation. If you use a model, say whether the prediction is reasonable inside the data range. If the scatter is weak or non-linear, say that instead of pretending the model is reliable.
Related Study Links
FAQ
How should I revise IB Maths AI SL statistics quickly?
Pick one narrow skill, such as standard deviation or correlation. Write the rule from memory, answer one short question, then add the interpretation sentence in context.
Are notes enough for statistics?
Notes help you remember the method, but they do not prove that you can interpret the result. Statistics questions usually need context, units, comparison, and limitations.
Why do I lose marks when my calculation is correct?
Your final sentence may be too vague. A correct number still needs context. Say what the number means for the data set, group, variable, or model in the question.
What is the biggest mistake in correlation questions?
Claiming causation. Correlation describes association. It does not prove that one variable causes the other.
When should I use median instead of mean?
Use the median when the data are skewed or include an outlier that would pull the mean away from a typical value.
How do I know if a regression prediction is reliable?
Check that the scatter plot is roughly linear, the correlation is strong enough, and the prediction is inside the data range. Be careful with extrapolation.
Do I need to show working if I use a GDC?
Usually, yes. You should show the statistic or model you used and then interpret the result in context. The calculator output alone may not show enough reasoning for the markscheme.
What is the difference between interpolation and extrapolation?
Interpolation means predicting inside the range of the data. Extrapolation means predicting outside the range of the data, so it is usually less reliable and needs a warning.
Related study links
- IB Mathematics Notes
- IB Mathematics Question Bank
- IB Mathematics Study Library
- EduNinja Blog
Closing
Statistics becomes easier when every answer ends in the data context. Calculate the number, then explain what it says about the group, variable, model, or prediction. That is the difference between using statistics and just reporting calculator output.
Put exam skill back into your full IB Maths AI SL study plan.
Return to the complete course overview, or move directly into the most relevant study tool.
Related articles
More course notes, updates and study resources from the EduNinja blog.
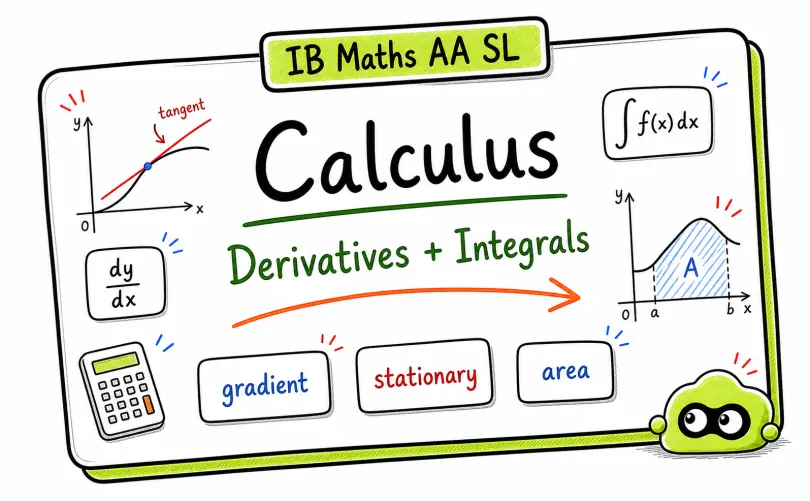
IB Maths AA SL Calculus: Differentiation and Integration Guide
Revise IB Maths AA SL calculus with derivative meaning, tangents, optimisation, integration, area, and calculator-safe exam routines.
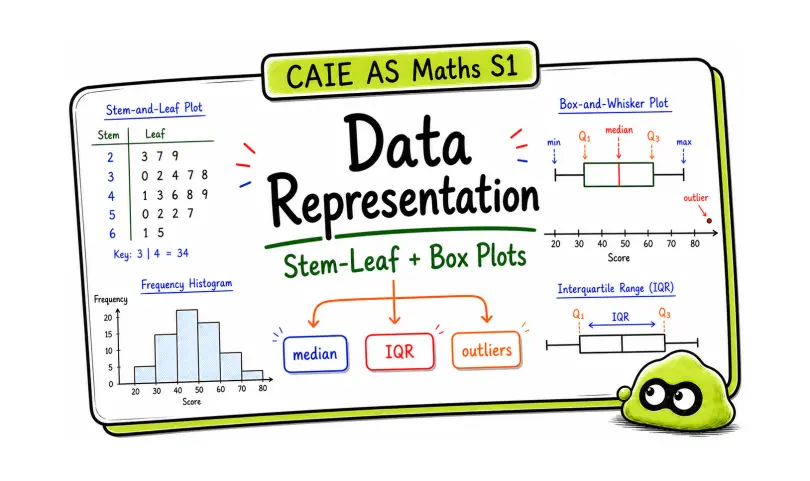
CAIE AS Maths Statistics 1: Data Representation, Stem-and-Leaf, and Box Plots
A source-backed CAIE Mathematics guide for CAIE AS Maths Statistics 1 data representation, using EduNinja PDF notes, worked examples, and markscheme-style answers.
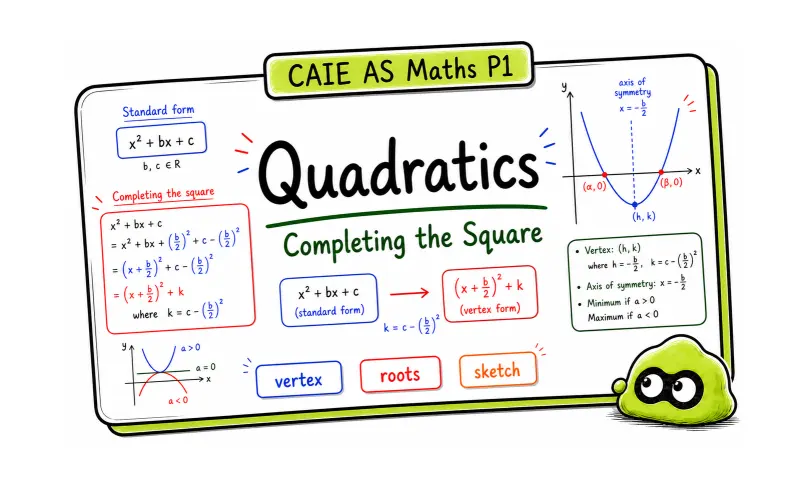
CAIE AS Maths Pure 1 Quadratics: Completing the Square and Sketching Graphs
A source-backed CAIE Mathematics guide for CAIE AS Maths quadratics, using EduNinja PDF notes, worked examples, and markscheme-style answers.