IB Biology Scientific Investigation Guide: How to Build a Strong 24-Mark IA
A practical IB Biology guide to the 24-mark Scientific Investigation: choose a workable research question, control variables, process data, draw a supported conclusion and evaluate limitations with specific improvements.

IB Biology Scientific Investigation Guide: How to Build a Strong 24-Mark IA
The IB Biology Scientific Investigation is not just a practical write-up. It is a 24-mark investigation in which you formulate a research question, collect and analyse quantitative data, draw a conclusion, and evaluate the quality of the method and evidence. The report can be based on laboratory work, fieldwork, spreadsheet modelling, a database or a simulation, but the final investigation must be your own individual work.
Quick Answer
- Build a focused research question with a clear independent variable and dependent variable.
- Choose a method that produces enough relevant quantitative data to answer the question.
- Present processed data with appropriate calculations, uncertainty treatment and a suitable graph.
- Use the data as evidence in the conclusion rather than repeating the aim.
- Evaluate specific limitations and connect each one to a realistic improvement.
The IA is worth 20% of the final assessment and is marked out of 24. The four criteria are equally weighted: Research design, Data analysis, Conclusion and Evaluation. The maximum report length is 3,000 words, excluding charts and diagrams, data tables, equations and calculations, citations, bibliography and headers.
What the 24 Marks Are Assessing
| Criterion | Marks | What a strong report demonstrates |
|---|---|---|
| Research design | 6 | A contextualised research question and a reproducible method that collects relevant, sufficient data |
| Data analysis | 6 | Correct processing, appropriate uncertainty treatment and a clear interpretation of the data |
| Conclusion | 6 | A justified answer to the research question that is supported by the processed evidence |
| Evaluation | 6 | Specific limitations, their effects on the investigation, and realistic improvements |
The criteria are judged independently. A strong research question does not automatically produce a strong evaluation, so plan evidence for each criterion from the start.
Start with a Research Question You Can Actually Test
A useful research question is narrow enough to investigate with the time, equipment and data available. It should identify what you will change or select, what you will measure, and the biological context connecting them.
For example, “How does light affect plants?” is too broad. A more workable version is: “How does light intensity affect the rate of photosynthesis in Elodea, measured by oxygen bubbles released per minute, when temperature and the volume of sodium hydrogencarbonate solution are controlled?”
The improved question makes the investigation measurable. Light intensity is the independent variable, bubbles per minute is the dependent variable, and temperature and solution conditions are examples of controlled variables.

Independent, Dependent and Controlled Variables
The independent variable is the factor you manipulate or the data range you select. The dependent variable is the response you measure. Controlled variables are conditions that could affect the dependent variable and therefore need to be kept constant or monitored.
Do not list controls without explaining why they matter. If temperature changes during a photosynthesis investigation, it may change enzyme activity and therefore affect oxygen production. That creates an alternative explanation for the pattern in the results.
Design a Method That Another Student Could Repeat
The method should contain enough detail to be reproducible. Include the equipment, quantities, ranges, intervals, number of trials, measurement procedure and safety or ethical considerations that affect the investigation. Explain why the chosen range and interval are suitable for answering the research question.
A method is not strong merely because it is long. It is strong when another student can follow it without guessing. If you use a database or simulation, explain how the data were filtered, sampled or generated. If you work collaboratively, the final report, writing and individual research question must remain your own.
Before collecting data, check feasibility. A question may sound interesting but still fail if the variable cannot be measured reliably, the range is too narrow, or the available equipment cannot control an important factor.
Collect Data That Can Support a Claim
Quantitative data are required, with qualitative observations included where they add useful context. Plan repeated trials so you can identify variation and calculate a representative value. Record raw data with units and consistent precision. Keep unusual observations rather than silently deleting them; explain how you handled them in the analysis.
Your raw table should make it possible to trace every processed value back to the original measurement. Show a sample calculation when you calculate a mean, rate, percentage change or uncertainty. The reader should be able to see how the result was produced.
Process the Data and Choose the Right Graph
Processing should answer the research question, not decorate the report. Calculate values that reveal the relationship between the variables, then select a graph that matches the data. A scatter graph is usually appropriate when both variables are quantitative and you are investigating a relationship. Label both axes with quantities and units, use a sensible scale, plot points accurately and include a best-fit line or curve when justified.
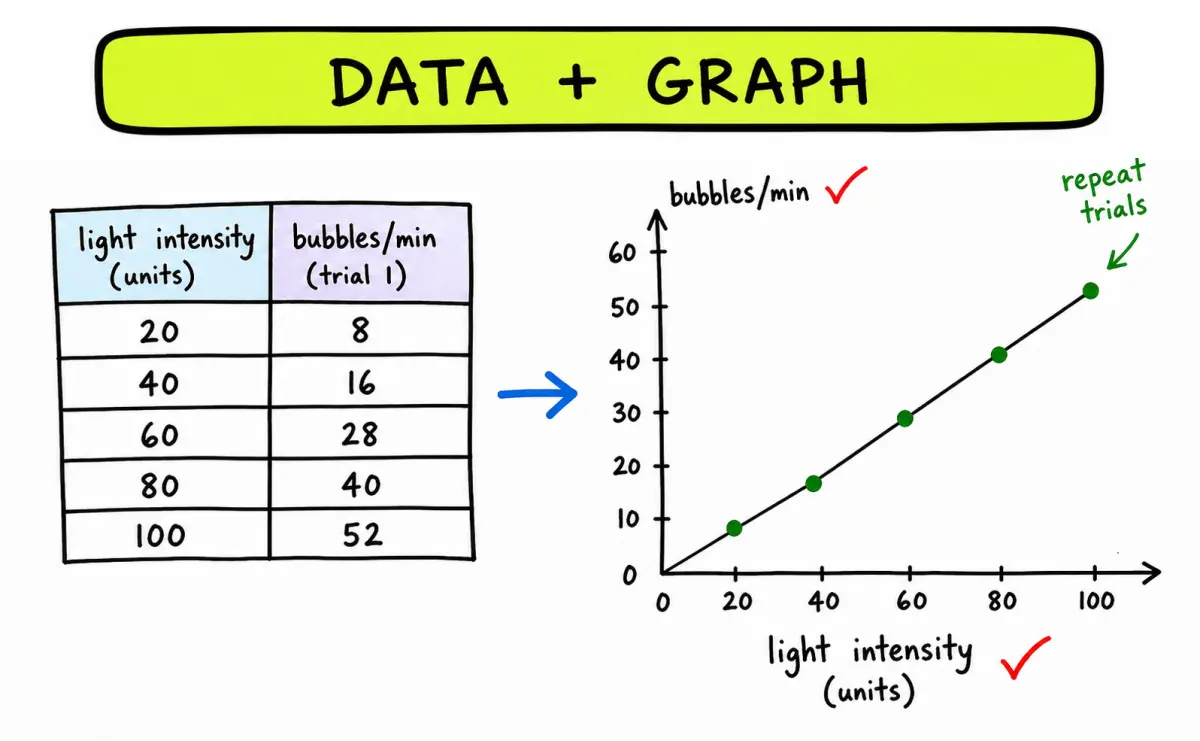
For example, if increasing light intensity is associated with more bubbles per minute, the graph should make that relationship visible. Do not describe a trend from a graph without referring to the data range, variation or exceptions. If repeated trials vary widely, that variation is part of the evidence and should influence the strength of your claim.
Uncertainty should be treated consistently. State the uncertainty of measurements where appropriate, propagate it through calculations when required, and discuss whether the size of the uncertainty affects the interpretation. A correlation or trend does not prove causation by itself; the method and control of variables determine how confidently you can explain the relationship.
Write a Conclusion That Answers the Question
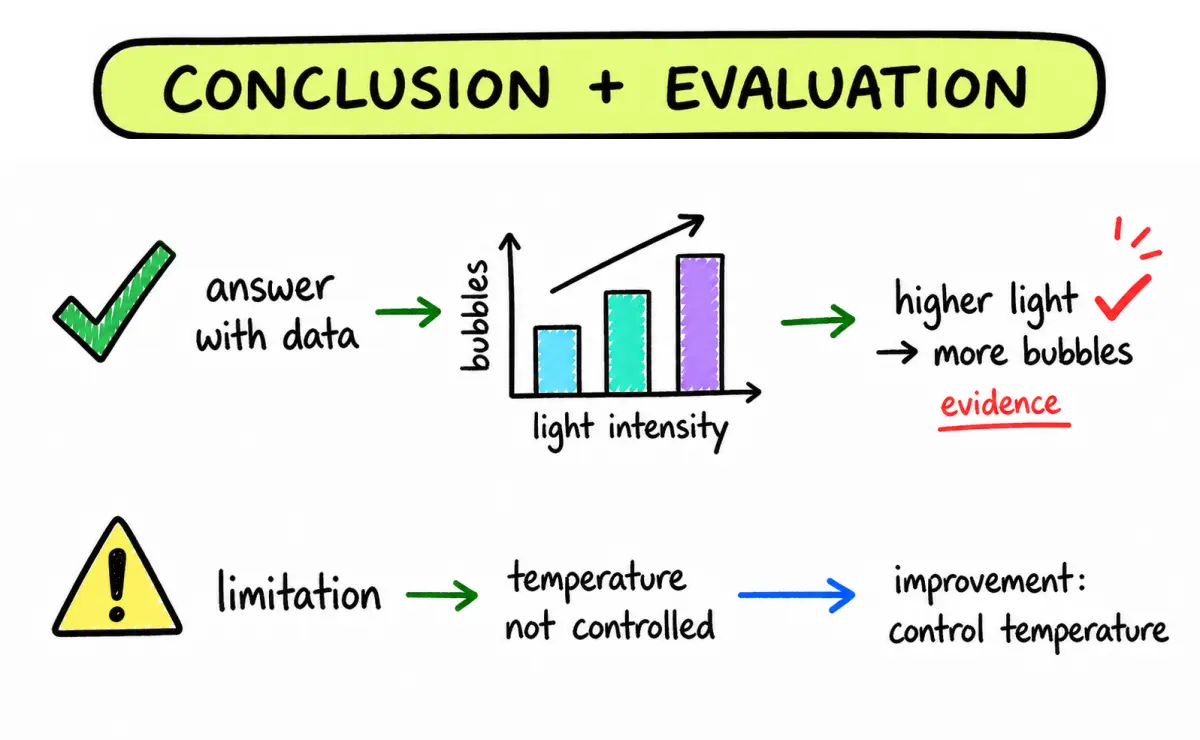
Start the conclusion with a direct answer to the research question. Then support it with specific evidence from the processed data. A mark-worthy conclusion does more than say “the hypothesis was supported”. It describes the direction and strength of the relationship, refers to relevant values or ranges, and acknowledges data that do not fit the pattern.
For the Elodea example, a useful conclusion might state that oxygen production increased across the tested light-intensity range, from approximately 8 to 52 bubbles per minute, supporting a positive relationship in these conditions. The conclusion should not claim that the pattern applies to every light intensity or every plant unless the investigation provides evidence for that broader claim.
Evaluate Limitations and Propose Specific Improvements
An evaluation should explain how a limitation affects the data or conclusion. “Human error” is too vague. A stronger point identifies the source, direction or consequence of the error, and then proposes an improvement that addresses it.
For example, if temperature was not controlled, changes in temperature could affect photosynthesis independently of light intensity. A realistic improvement would be to use a thermostatically controlled water bath, monitor temperature throughout each trial, and repeat measurements only within a defined temperature range.
Other useful evaluation points include a small sample size, a narrow independent-variable range, inconsistent timing, limited instrument resolution, uncontrolled biological variation, or a best-fit model that does not match the pattern. Explain whether each limitation reduces reliability, validity, precision or the ability to generalise the conclusion.
Common IA Mistakes
- Choosing a question that is interesting but not measurable with the available resources.
- Naming variables without explaining how they affect the dependent variable.
- Writing a method that cannot be reproduced because quantities, intervals or trial numbers are missing.
- Reporting processed data without showing units, uncertainty or a sample calculation.
- Using a graph with missing units, unsuitable axes or a trend line that is not justified.
- Repeating the aim instead of answering the research question with evidence.
- Calling every problem “human error” without explaining its effect.
- Claiming certainty beyond the tested range or ignoring variation in repeated trials.
- Treating collaborative data or shared wording as an individual final report.
- Omitting references or failing to acknowledge information used in the investigation.
A Practical IA Workflow
- Define the biological relationship and write two or three possible research questions.
- Check that the variables are measurable and that the method is feasible and safe.
- Pilot the method, then decide the range, intervals, repeats and recording precision.
- Collect raw data consistently and preserve observations and anomalies.
- Process the data with units and uncertainty, then choose the graph that answers the question.
- Draft the conclusion from the evidence before writing the evaluation.
- Link each evaluation point to a specific improvement and check academic integrity.
Practice This Topic
Use EduNinja's IB Biology SL question bank to practise interpreting variables, data and graphs after reading this guide. Then revisit your own IA draft and ask whether each paragraph provides evidence for one of the four criteria.
FAQ
How many marks is the IB Biology Scientific Investigation worth?
The Scientific Investigation is marked out of 24 and contributes 20% of the final assessment. Each of the four criteria is worth up to 6 marks.
Does the IA need to be a laboratory experiment?
No. The investigation may use practical laboratory work, fieldwork, spreadsheet analysis and modelling, a database, or a simulation. The approach must still produce and analyse data relevant to the research question.
How long can the report be?
The maximum overall word count is 3,000 words. Charts, diagrams, data tables, equations and calculations, citations, bibliography and headers are excluded from the word count.
What makes an evaluation specific?
Name the limitation, explain how it affects the data or conclusion, and propose an improvement that directly reduces that effect. Replace vague phrases such as “more accurate equipment” with a precise change and a reason.
Closing Checklist
Before submitting, check that your report has a focused research question, a reproducible method, sufficient quantitative data, transparent processing, an evidence-based conclusion, and an evaluation connected to realistic improvements. The strongest IA is not the one with the most complicated experiment; it is the one where the question, data and reasoning fit together clearly.
Put scientific investigation back into your full IB Biology SL study plan.
Return to the complete course overview, or move directly into the most relevant study tool.
Related articles
More course notes, updates and study resources from the EduNinja blog.

Abiotic Factors Explained | IB Biology SL
Revise IB Biology SL abiotic factors, tolerance ranges, limiting factors and how environmental variables affect distribution.
Active Transport vs Passive Transport | A-Level Biology
Revise A-Level Biology active and passive transport with concentration gradients, ATP, carrier proteins, examples, common mistakes and practice.

Binary Fission Explained | Biology
Learn binary fission with the cell-division sequence, genetically identical daughter cells, examples and key comparisons with mitosis.