EduNinja
IB Maths AI HL/Question Bank/5.2 Calculus - AHL content

IB Maths AI HL5.2 Calculus - AHL contentQuestion Bank

HL72 questions10 previewsSyllabus linked
[Maximum number: 3]

Kailash manufactures drink containers in the shape of a cuboid. The container has a square top and a square base of length, l cml \mathrm{~cm}. Its height, d cmd \mathrm{~cm}, is three times the length of the base.

Question image
(a)
(i)

Find d2A dr2\frac{\mathrm{d}^{2} A}{\mathrm{~d} r^{2}}.

(ii)

Hence determine whether the graph of A is concave-up or concave-down for r>0. Justify your answer.

[ 3 ]
[Maximum number: 21]

This question uses differential equations to model the maximum velocity of a skydiver in free fall.
In 2012, Felix Baumgartner jumped from a height of 40000 m . He was attempting to travel at the speed of sound, 330 m s1330 \mathrm{~m} \mathrm{~s}^{-1}, whilst free-falling to the Earth.
Before making his attempt, Felix used mathematical models to check how realistic his attempt would be. The simplest model he used suggests that

dv dt=g\frac{\mathrm{d} v}{\mathrm{~d} t}=g

where v m s1v \mathrm{~m} \mathrm{~s}^{-1} is Felix's velocity and g ms2g \mathrm{~ms}^{-2} is the acceleration due to gravity. The time since he began to free-fall is t seconds and the displacement from his initial position is s metres.

Throughout this question, the direction towards the centre of the Earth is taken to be positive and v is a positive quantity.

When s=0, it is given that Felix jumps with an initial velocity v=10.

(a)
(i)

Use the chain rule to show that dv dt=v dv ds\frac{\mathrm{d} v}{\mathrm{~d} t}=v \frac{\mathrm{~d} v}{\mathrm{~d} s}.

(ii)

Assuming that g is a constant, solve the differential equation v dv ds=gv \frac{\mathrm{~d} v}{\mathrm{~d} s}=g to find
v as a function of s. v as a function of s.

[ 1 ]
(iii)

Using g=9.8, determine whether the model predicts that Felix will succeed in travelling at the speed of sound at some point before s=40000. Justify your answer.

[ 3 ]
(b)

An improved model considers air resistance, using

dv dt=gkv2\frac{\mathrm{d} v}{\mathrm{~d} t}=g-k v^{2}

where k is a positive constant. You are reminded that initially s=0 and v=10.

[ 11 ]
(i)

By using dv dt=v dv ds\frac{\mathrm{d} v}{\mathrm{~d} t}=v \frac{\mathrm{~d} v}{\mathrm{~d} s}, solve the differential equation to find v in terms of s, g and k.

You may assume that gkv2>0g-k v^{2}>0.

Felix uses the graph of v against t shown in part (b) to estimate the value of k.

[ 5 ]
(ii)

The gradient is estimated to be 9.672 when v=40. Taking g to be 9.8 , use this information to show that Felix found that k=8×10⁵k=8 \times 10^{-5}.

[ 2 ]
(iii)

Hence, find the value of v predicted by this model, as s tends to infinity.

[ 2 ]
(iv)

Find the upper bound for the velocity according to this model, given that 0<s400000<s \leq 40000. Give your answer to four significant figures.

The assumption that the value of g is constant is not correct. It can be shown that

g=3.98×10¹⁴(6.41×10⁶s)2g=\frac{3.98 \times 10^{14}}{\left(6.41 \times 10^{6}-s\right)^{2}}

Hence, the new model is given by

v dv ds=3.98×10¹⁴(6.41×10⁶s)2(8×10⁵)v2v \frac{\mathrm{~d} v}{\mathrm{~d} s}=\frac{3.98 \times 10^{14}}{\left(6.41 \times 10^{6}-s\right)^{2}}-\left(8 \times 10^{-5}\right) v^{2}

When s=0, it is known that v=10.

[ 2 ]
(c)

Use Euler's method with a step length of 4000 to estimate the value of v when s=40000.

[ 4 ]
(d)

After Felix completed his record-breaking jump, he found that the answer from part (d) was not supported by data collected during the jump.

[ 2 ]
(i)

Suggest one improvement to the use of Euler's method which might increase the accuracy of the prediction of the model.

[ 1 ]
(ii)

Suggest one factor not explicitly considered by the model in part (d) which might lead to a difference between the model's prediction and the data collected.

[ 1 ]
[Maximum number: 6]

This question is about modelling the spread of a computer virus to predict the number of computers in a city which will be infected by the virus.
A systems analyst defines the following variables in a model:
- t is the number of days since the first computer was infected by the virus.
- Q(t) is the total number of computers that have been infected up to and including day t.
The following data were collected:

Table
(a)
(i)

Find the general solution of the differential equation Q(t)=βNQ(t)Q^{\prime}(t)=\beta N Q(t).

[ 4 ]
(b)

Use your answer from part (b)(ii) to estimate the time taken for the number of infected computers to double.

The data above are taken from city X which is estimated to have 2.6 million computers. The analyst looks at data for another city, Y. These data indicate a value of β=9.64×10⁸\beta=9.64 \times 10^{-8}.

[ 2 ]
[Maximum number: 6]

A skip is a container used to carry garbage away from a construction site. For safety reasons the garbage must not extend beyond the top of the skip. The maximum volume of garbage to be removed is therefore equal to the volume of the skip.

Question image

A particular design of skip can be modelled as a prism with a trapezoidal cross section. For the skip to be transported, it must have a rectangular base of length 10 m and width 3 m . The length of the sloping edge is fixed at 4 m , and makes an angle of θ\theta with the horizontal.

The following diagram shows such a skip.

Question image
(a)

Show, by differentiation, that the maximum volume occurs at a value of θ\theta that satisfies the equation 2cos2θ+5cosθ1=02 \cos ^{2} \theta+5 \cos \theta-1=0.

[ 6 ]
[Maximum number: 22]

This question explores models for the height of water in a cylindrical container as water drains out.
The diagram shows a cylindrical water container of height 3.2 metres and base radius 1 metre. At the base of the container is a small circular valve, which enables water to drain out.

Question image

Eva closes the valve and fills the container with water.
At time t=0, Eva opens the valve. She records the height, h metres, of water remaining in the container every 5 minutes.

Table

Eva first tries to model the height using a linear function, h(t)=a t+b, where a,bRa, b \in \mathbb{R}.

(a)

Show that dh dt=R270560h\frac{\mathrm{d} h}{\mathrm{~d} t}=-R^{2} \sqrt{70560 h}.

[ 3 ]
(b)

By solving the differential equation dh dt=R270560h\frac{\mathrm{d} h}{\mathrm{~d} t}=-R^{2} \sqrt{70560 h}, show that the general solution is given by h=17640(cR2t)2h=17640\left(c-R^{2} t\right)^{2}, where cRc \in \mathbb{R}.

Eva measures the radius of the valve to be 0.023 metres. Let T be the time, in minutes, it takes for all the water to drain out of the container.

[ 5 ]
(c)

Use the general solution from part (d) and the initial condition h(0)=3.2 to predict the value of T.

Eva wants to use the container as a timer. She adjusts the initial height of water in the container so that all the water will drain out of the container in 15 minutes.

[ 4 ]
(d)

Find this new height.

Eva has another water container that is identical to the first one. She places one water container above the other one, so that all the water from the highest container will drain into the lowest container. Eva completely fills the highest container, but only fills the lowest container to a height of 1 metre, as shown in the diagram.

diagram not to scale

diagram not to scale

At time t=0 Eva opens both valves. Let H be the height of water, in metres, in the lowest container at time t.

[ 3 ]
(e)
(i)

Show that dH dt0.25140.009873t0.1405H\frac{\mathrm{d} H}{\mathrm{~d} t} \approx 0.2514-0.009873 t-0.1405 \sqrt{H}, where 0tT0 \leq t \leq T.

[ 4 ]
(ii)

Use Euler's method with a step length of 0.5 minutes to estimate the maximum value of H.

[ 3 ]
[Maximum number: 13]

In this question, you will first consider a statistical model for the number of fish caught in a lake and then consider a differential equation to model the growth of fish in the lake.
Althea enjoys fishing in a lake near her home. She usually fishes for 4 hours each day, and she records the length of each fish before releasing it back in the lake.
Althea decides to perform a χ2\chi^{2} goodness of fit test, at the 5 % significance level, to determine whether the number of fish caught can be modelled by a Poisson distribution.
She uses her records from the last 50 days to produce this table.

Table
(a)

Justifying your answer,

[ 4 ]
(i)

state whether k is positive, negative, or could be either

[ 2 ]
(ii)

state the value of dL dt\frac{\mathrm{d} L}{\mathrm{~d} t} as tt \rightarrow \infty

[ 2 ]
(b)

Sketch a graph of dL dt\frac{\mathrm{d} L}{\mathrm{~d} t} against t. You should label the coordinates of any axes intercepts and the equation of any asymptotes on your sketch.

[ 3 ]
(c)

Solve the differential equation dL dt=k(LL)\frac{\mathrm{d} L}{\mathrm{~d} t}=k\left(L_{\infty}-L\right), using the initial condition. Write your
answer in the form L=f(t).

[ 6 ]
[Maximum number: 4]

Consider the differential equation dy dx=log10(x+y)\frac{\mathrm{d} y}{\mathrm{~d} x}=\log _{10}(x+y), where x0x \geq 0 and y>0.
Given that y=1 when x=0, use Euler's method with a step length of 0.1 to find an approximate value for y when x=2.

[Maximum number: 3]

This question is about applying ideas from logarithms, calculus and probability to an unfamiliar mathematical theory called information theory.
Claude Shannon developed a mathematical theory called information theory to measure the information gained when random events occur. He defined the information, I, that is gained when an event with probability p occurs as

I=lnpI=-\ln p

where 0<p10<p \leq 1. For example, no information is gained ( I=0 ) when an event is certain to occur(p=1)\operatorname{occur}(p=1).

(a)
(i)

Show, using calculus, that I is a decreasing function of p.

[ 3 ]
[Maximum number: 13]

A sports stadium has a T-shirt cannon which is used to launch T-shirts into the crowd. The purpose of this question is to determine whether a person sitting in a particular seat will ever receive a T-shirt.
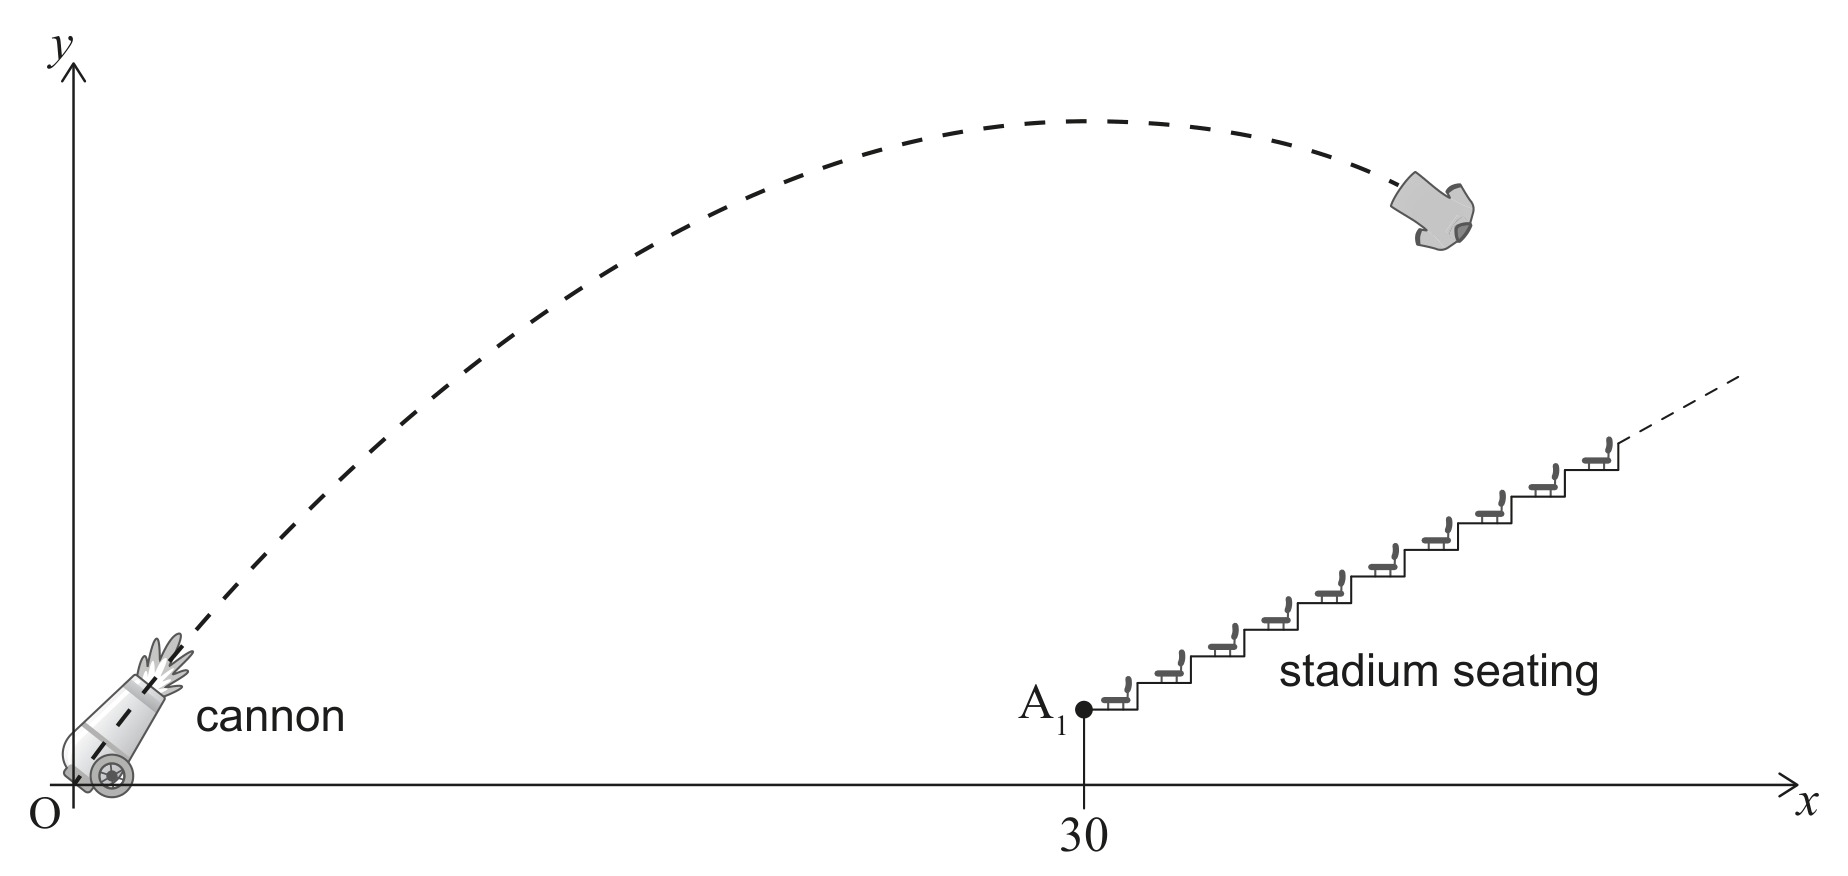
A T-shirt cannon is placed on the horizontal ground of a stadium playing area. A coordinate system is created such that the origin, O , is the point on the ground from where the T-shirts are launched. In this coordinate system, x and y represent the horizontal and vertical displacement from O, and are measured in metres.
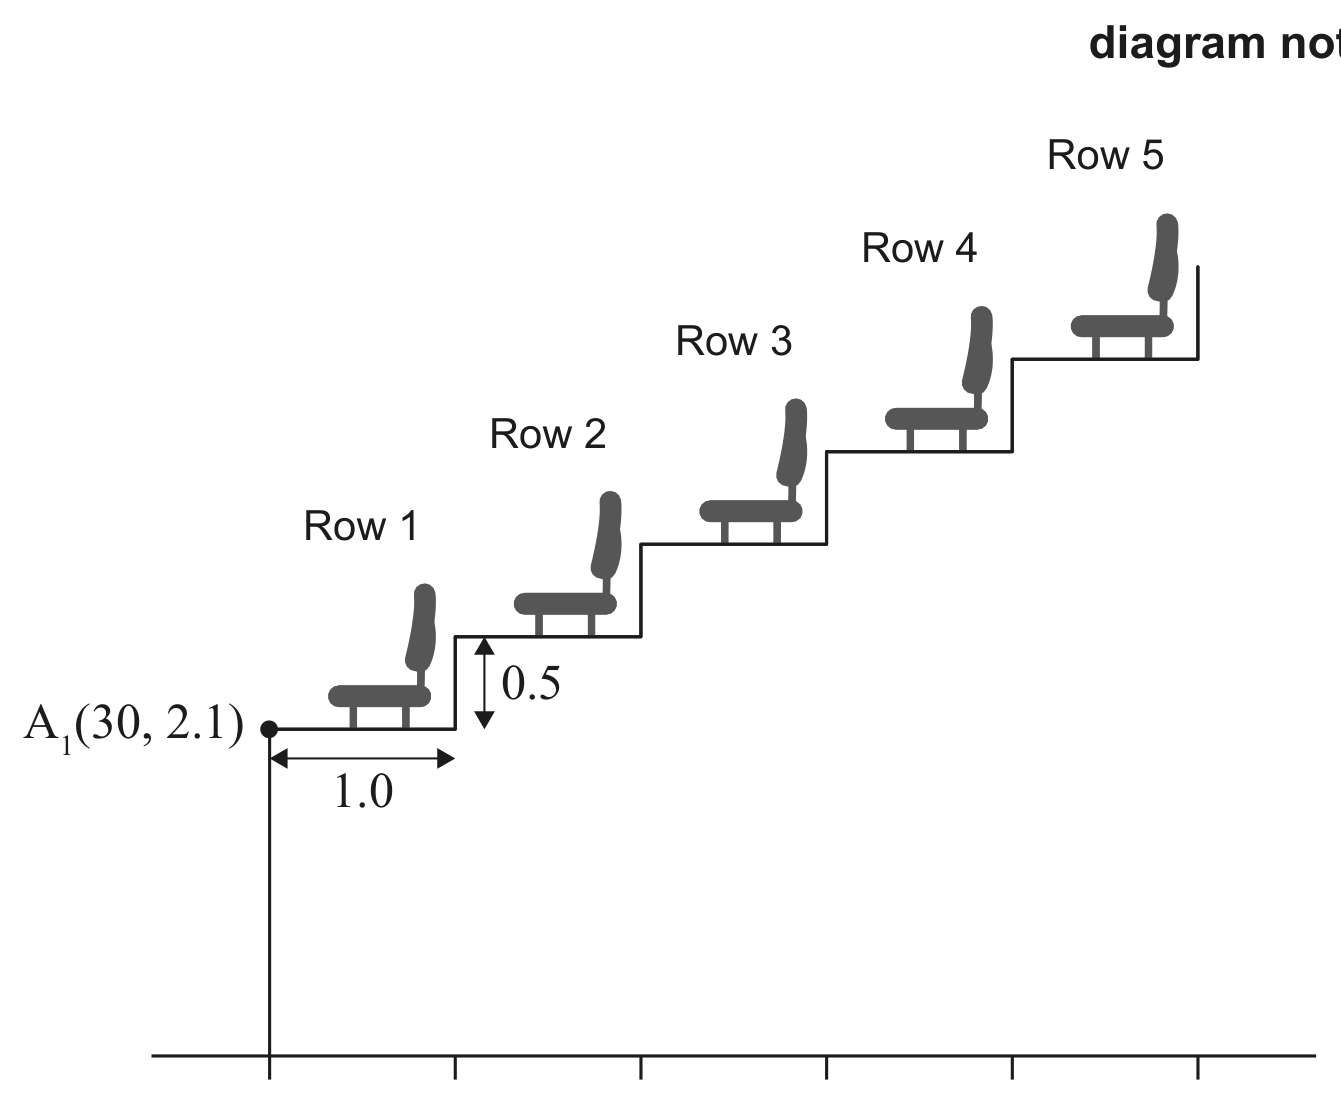
Seat A1\mathrm{A}_{1} is the nearest seat to the T-shirt cannon. The coordinates of the front of the foot space for seat A1\mathrm{A}_{1} are (30, 2.1).

Question image

Each seat behind seat A1\mathrm{A}_{1} is 1.0 m further from O horizontally and 0.5 m higher than the seat in the row below it, as shown on the diagram.

Question image

Seat A1\mathrm{A}_{1} is in row 1 . Let seat An\mathrm{A}_{n} be the seat directly behind A1\mathrm{A}_{1} in row n.

(a)
(i)

Find an expression for the velocity, (x˙y˙)\binom{\dot{x}}{\dot{y}}, at time t.

[ 3 ]
(ii)

Hence show that when the T-shirt is launched vertically, the time for it to reach its maximum height is 3 seconds.

The displacement of the T-shirt, t seconds after it is launched, is given by the vector equation

(xy)=(29.4(cosθ)t29.4(sinθ)t4.9t2)\binom{x}{y}=\binom{29.4(\cos \theta) t}{29.4(\sin \theta) t-4.9 t^{2}}
[ 3 ]
(b)

Using the given answer to part (b)(ii) or otherwise, find the maximum height reached by a T-shirt when it is launched vertically.

[ 2 ]
(c)
(i)

If there was no seating, and the T-shirt was launched at an angle θ\theta, show that the value of x when it would hit the ground is given by the expression

x=176.4sinθcosθx=176.4 \sin \theta \cos \theta
[ 3 ]
(ii)

Hence find the maximum possible value for x if there was no seating to block the path of the T-shirt.

In order to calculate the seats in the stadium which can be reached by a T-shirt it is required to find the equation of the curve that forms the boundary of all the points that can be reached. This boundary is represented by the dashed curve in the following diagram, while the solid curves represent some of the possible trajectories for the T-shirts.

Question image

It is given that the boundary curve is the parabola y=ax2+bx+cy=a x^{2}+b x+c, with its vertex V on the y-axis.

[ 2 ]
[Maximum number: 27]

The following question explores a possible method of drawing phase portraits for non-linear coupled systems, taking a predator-prey model as a particular example.
Gander Green wildlife park contains a population of Czech geese ( x, measured in hundreds), and a population of gray foxes ( y, measured in hundreds).
Research indicates that the population growth of both geese and foxes can be modelled by the following differential equations, in which t is measured in years.

dx dt=2xxy2 dy dt=3y+xy} for x,y0\left.\begin{array}{l} \frac{\mathrm{d} x}{\mathrm{~d} t}=2 x-\frac{x y}{2} \\ \frac{\mathrm{~d} y}{\mathrm{~d} t}=-3 y+x y \end{array}\right\} \text { for } x, y \geq 0
(a)

At a specific time, there are 500 geese and 500 foxes, represented here by the coordinate pair (5, 5). At this time, determine the rate of change of

[ 3 ]
(i)

geese.

[ 2 ]
(ii)

foxes.

There are two equilibrium points for the populations: A(0,0) and B(p, q).

[ 1 ]
(b)
(i)

Explain why A is an equilibrium point.

[ 1 ]
(ii)

Find the value of p and the value of q.

At points close to A(0,0), we can ignore the x y terms, so that the system can be approximated by:

dx dt=2x dy dt=3y} for x,y0\left.\begin{array}{l} \frac{\mathrm{d} x}{\mathrm{~d} t}=2 x \\ \frac{\mathrm{~d} y}{\mathrm{~d} t}=-3 y \end{array}\right\} \text { for } x, y \geq 0
[ 3 ]
(c)

By solving these two differential equations,

[ 5 ]
(i)

find an expression for x in terms of t.

[ 4 ]
(ii)

find an expression for y in terms of t.

[ 1 ]
(d)
(i)

Using your answers from part (c), show that phase portrait trajectories close to A may be given by the equation x3y2=kx^{3} y^{2}=k, where k is a positive constant.

[ 3 ]
(ii)

Hence sketch, on a phase portrait, one possible trajectory for small values of x and y.

Now consider points (x, y) close to B on the phase plane. These coordinates can be rewritten as x=p+X and y=q+Y, where p and q are the values from part (b)(ii).

[ 3 ]
(e)

By substituting into the original model, show that, for small values of X and Y :

X˙3Y2.\dot{X} \approx-\frac{3 Y}{2} .

Similarly, it can be shown that Y˙4X\dot{Y} \approx 4 X.

(f)

By finding the eigenvalues of M, describe the path of the trajectories close to point B .

[ 4 ]
(g)

Hence sketch a complete set of trajectories in the phase plane for the original model, clearly indicating both equilibrium points.

[ 3 ]
(h)

In this wildlife park, at a specific time, there are 500 Czech geese and 500 gray foxes.

Based on the values found in part (a), the park's wildlife keeper is worried and assumes that the geese will quickly die out. Suggest whether this assumption is supported by the model. Justify your answer.

[ 2 ]
0