EduNinja
IB Maths AI HL/Question Bank/4.2 Statistics and probability - AHL content

IB Maths AI HL4.2 Statistics and probability - AHL contentQuestion Bank

HL55 questions10 previewsSyllabus linked
[Maximum number: 6]

Juliet is a sociologist who wants to investigate if income affects happiness amongst doctors. This question asks you to review Juliet's methods and conclusions.
Juliet obtained a list of email addresses of doctors who work in her city. She contacted them and asked them to fill in an anonymous questionnaire. Participants were asked to state their annual income and to respond to a set of questions. The responses were used to determine a happiness score out of 100 . Of the 415 doctors on the list, 11 replied.

(a)
(i)

Describe one criticism that can be made about the validity of Juliet's investigation.

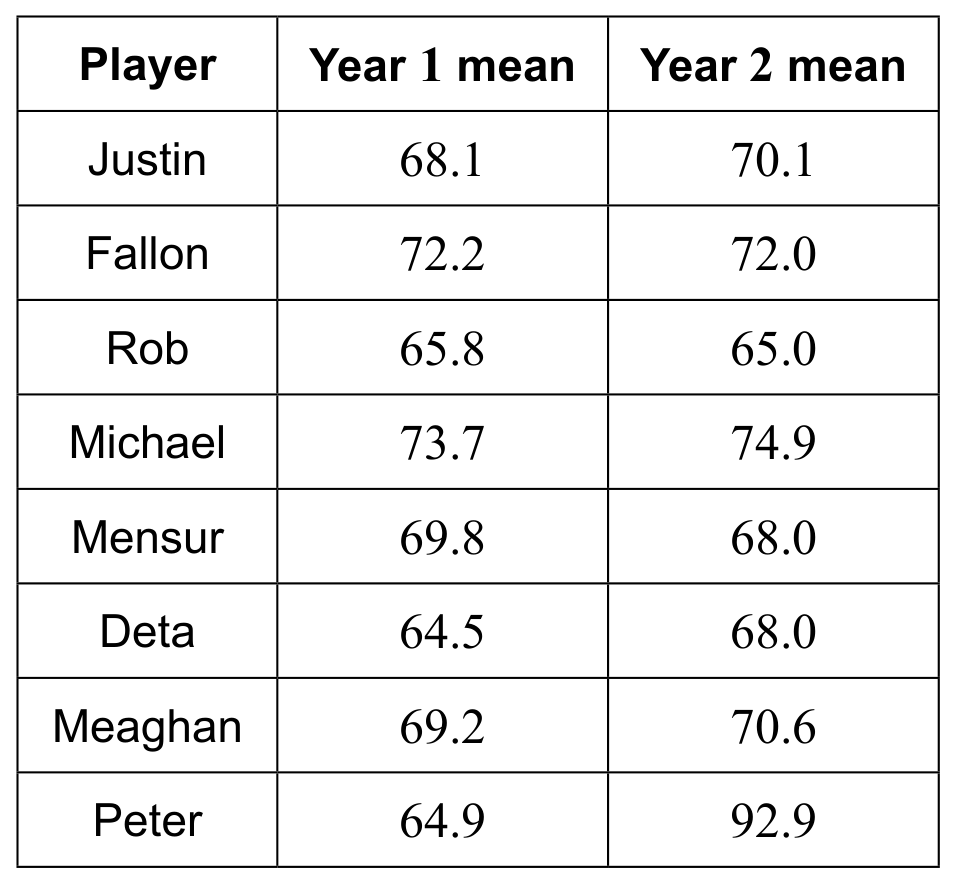
Juliet's results are summarized in the following table.

Table
[ 1 ]
(b)

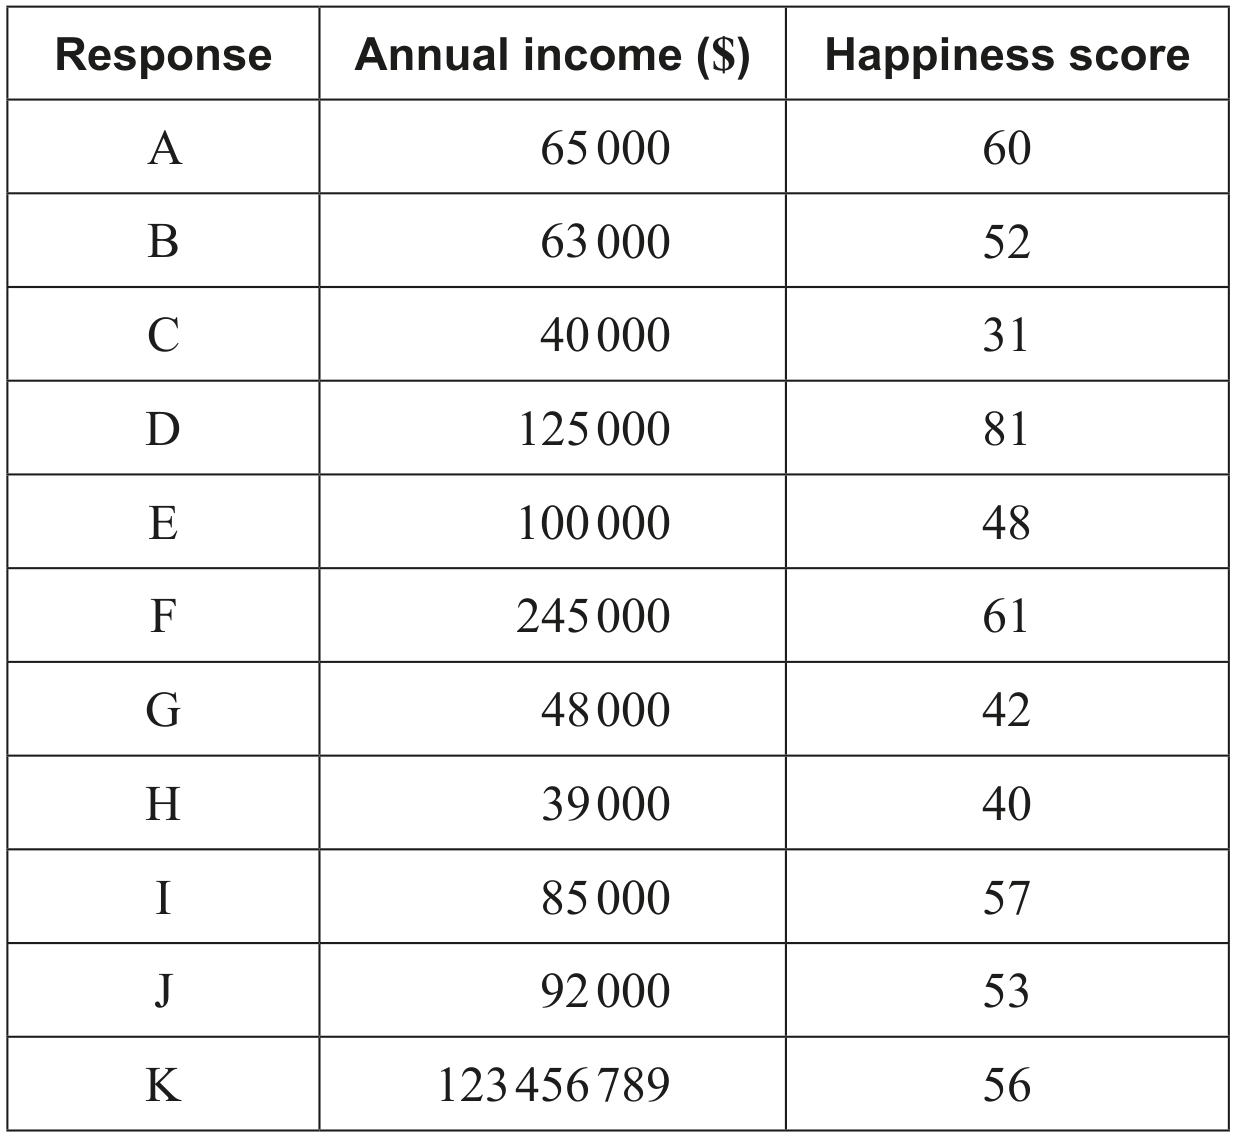
Juliet wants to create a model to predict how changing annual income might affect happiness scores. To do this, she assumes that annual income in dollars, X, is the independent variable and the happiness score, Y, is the dependent variable.

She first considers a linear model of the form

Y=a X+b
[ 5 ]
(i)

Find the value of c, of d and of e.

[ 1 ]
(ii)

Find the coefficient of determination for each of the two models she considers.

[ 2 ]
(iii)

Hence compare the two models.

Juliet decides to use the coefficient of determination to choose between these two models.

[ 1 ]
(iv)

Comment on the validity of her decision.

After presenting the results of her investigation, a colleague questions whether Juliet's sample is representative of all doctors in the city.

A report states that the mean annual income of doctors in the city is $ 80000. Juliet decides to carry out a test to determine whether her sample could realistically be taken from a population with a mean of $ 80000.

[ 1 ]
[Maximum number: 13]

In this question you will use graph theory and transition matrices to solve problems about a manager visiting five factories.
Audrey is the quality control manager for a manufacturing company that has five factories, A, B, C, D and E .
She is planning a route to visit each factory once, starting and finishing from her home, H .
She determines the distance between each location, in kilometres, as shown in the table.

Table

Audrey wants to find an upper and lower bound for the shortest total distance travelled on her route.

(a)

Write down the value of

[ 3 ]
(i)

p

[ 1 ]
(ii)

q

[ 1 ]
(iii)

r.

[ 1 ]
(b)

Audrey first visits factory A.

[ 8 ]
(i)

Write down the initial state matrix, S0\boldsymbol{S}_{0}.

[ 1 ]
(ii)

Find the probability that the fifth factory that Audrey visits is C .

[ 2 ]
(iii)

Find the probability that the fifth factory that Audrey visits is the same as the second factory she visits.

[ 5 ]
(c)

Over a long period of time,

[ 2 ]
(i)

find the proportion of Audrey's visits that are to factory A

[ 2 ]
[Maximum number: 12]

The following question examines the changes in darts players' scores using two statistical tests.
In the sport of darts, players take turns throwing darts at a board in order to score points.

Question image

A player's "three dart average" refers to the mean score achieved when throwing three darts.
Valia aimed to find out whether amateur darts players in her local area improved over a 12-month period. An increase in their "three dart average" would indicate an improvement.

She selected a random sample of eight darts players and recorded their mean "three dart average" from Year 1.

She then recorded their mean "three dart average" from Year 2.
Valia's results were as follows:

Table 1

Table 1

Valia calculated the median, quartiles and inter-quartile range for each year. The results are shown in Table 2.

Table 2

Table 2

(a)

State one way Valia could have reduced the chance of her making

[ 4 ]
(i)

a Type I error.

[ 2 ]
(ii)

a Type II error.

Valia was not sure the assumption made in part (c) was correct and hence thought the results obtained from her paired t-test may not be valid.

Following further research, Valia decided to use the Wilcoxon signed-rank test, which does not require the assumption she made in part (c).

For this test, the magnitudes of the differences between the Year 2 and Year 1 means are ranked from 1 to 8 , with the ranks of the positive differences ( P ) and the ranks of the negative differences ( N ) separated in columns.

This is partially shown in the following table, which Valia constructs to perform the test.

Table
[ 2 ]
(b)

Determine the values of

[ 4 ]
(i)

A,B,C\quad A, B, C and D.

[ 3 ]
(ii)

N\quad \sum N.

For this test:
- the Wilcoxon signed-rank test statistic is T= the smaller value from a choice of P\sum P or N\sum N.
- the null hypothesis is that the population's median for "three dart average" is the same in both years.

Valia chooses to carry out the test at the 5 % level of significance. From statistical tables, she determines that the critical region is T5T \leq 5.

[ 1 ]
(c)
(i)

State the alternative hypothesis H1\mathrm{H}_{1} for this test.

[ 1 ]
(ii)

Write down the value of the test statistic, T.

[ 1 ]
(iii)

Determine the conclusion of the test in context.

[ 2 ]
[Maximum number: 3]

This question considers whether it is reasonable to go on all the rides in a theme park and get back to the entrance in two and a half hours.
Martin is visiting a theme park. He will enter the park at 09:00 and must leave the park by 11:30. He uses information available on the internet to calculate whether he will be able to go on all of the rides in the two and a half hours.
He begins by constructing a graph which shows the main paths between the rides and the route of the cable car between the entrance/exit A and ride D.
His graph and the names of the rides are shown in the following diagram.

Question image

The weights on the edges of the graph represent the times, in minutes, to walk between the rides and the time to travel by cable car between A and D.

Let T be the shortest possible time, in minutes, taken to visit all the rides, beginning and ending at A .

Martin notices that the graph contains a Hamiltonian cycle. He decides to use the weight of the Hamiltonian cycle as an upper bound for T.

(a)
(i)

Find the distribution for the total time spent queuing for all five rides.

[ 3 ]
[Maximum number: 16]

This question is about modelling the spread of a computer virus to predict the number of computers in a city which will be infected by the virus.
A systems analyst defines the following variables in a model:
- t is the number of days since the first computer was infected by the virus.
- Q(t) is the total number of computers that have been infected up to and including day t.
The following data were collected:

Table
(a)
(i)

Using the data in the table write down the equation for an appropriate non-linear regression model.

[ 2 ]
(ii)

Write down the value of R2R^{2} for this model.

[ 1 ]
(iii)

Hence comment on the suitability of the model from (b)(ii) in comparison with the linear model found in part (a).

[ 2 ]
(iv)

By considering large values of t write down one criticism of the model found in (b)(ii).

[ 1 ]
(b)

Find in which city, X or Y, the computer virus is spreading more easily. Justify your answer using your results from part (b).

[ 3 ]
(c)
(i)

Use linear regression to estimate the value of k and of L.

[ 5 ]
(ii)

The solution to the differential equation is given by

Q(t)=L1+CektQ(t)=\frac{L}{1+C \mathrm{e}^{-k t}}

where C is a constant.
Using your answer to part (f)(i), estimate the percentage of computers in city X that are expected to have been infected by the virus over a long period of time.

[ 2 ]
[Maximum number: 7]

This question uses statistical tests to investigate whether advertising leads to increased profits for a grocery store.

Aimmika is the manager of a grocery store in Nong Khai. She is carrying out a statistical analysis on the number of bags of rice that are sold in the store each day. She collects the following sample data by recording how many bags of rice the store sells each day over a period of 90 days.

Table

She believes that her data follows a Poisson distribution.

(a)

State one assumption that Aimmika needs to make about the sales of bags of rice to support her belief that it follows a Poisson distribution.

[ 1 ]
(b)

Aimmika knows from her historic sales records that the store sells an average of 4.2 bags of rice each day. The following table shows the expected frequency of bags of rice sold each day during the 90 day period, assuming a Poisson distribution with mean 4.2.

Table

Find the value of a, of b, and of c. Give your answers to 3 decimal places.

[ 5 ]
(c)

Aimmika claims that advertising in a local newspaper for 300 Thai Baht (THB) per day will increase the number of bags of rice sold. However, Nichakarn, the owner of the store, claims that the advertising will not increase the store's overall profit.

Nichakarn agrees to advertise in the newspaper for the next 60 days. During that time, Aimmika records that the store sells 282 bags of rice with a profit of 495 THB on each bag sold.

Aimmika wants to carry out an appropriate hypothesis test to determine whether the number of bags of rice sold during the 60 days increased when compared with the historic sales records.

[ 1 ]
(i)

Hence state the probability of a Type I error for this test.

[ 1 ]
[Maximum number: 9]

The following question explores how sequences, series and Markov chains may be used in modelling the number of customers in a commercial setting.
In a town, there are three stores: Aroma, Bodega and Clover.
Ashley is the manager of Aroma. She gathers data to determine whether there is significant movement of customers between the three stores over the course of one year.
She found that:
- 91 % of Aroma customers stayed with Aroma, 5 % moved to Bodega, and 4 % moved to Clover.
- 95 % of Bodega customers stayed with Bodega, 4 % moved to Aroma, and 1 % moved to Clover.
- 92 % of Clover customers stayed with Clover, 6 % moved to Aroma, and 2 % moved to Bodega.
This information is used to form a transition matrix, T.

(a)

Find the steady state vector for T.

[ 2 ]
(b)

Hence, state the percentage of Clover customers expected to move to Aroma in the long term.

Ashley's initial findings suggested that 6 % of Clover's customers moved to Aroma over the course of one year. Ashley is instructed to increase this figure so that at least 40 % of Clover's customers move to Aroma in the long term.

It may be assumed that all other annual percentage changes remain the same, other than the percentage that stay with Clover.

[ 1 ]
(c)

Determine the minimum integer percentage to which the 6 % figure will need to be raised to achieve this objective, justifying your answer.

[ 3 ]
(d)

State, with an explanation, whether Bodega's manager would benefit from Ashley attracting more of Clover's customers.

[ 2 ]
(e)

Suggest a contextual reason why the annual percentage changes are unlikely to be constant from year to year.

Ashley moves to a new store, Dusk, in a different town.
She notes that in her first week, Dusk had 600 customers and that every week, the number of customers increases by 30 . Therefore, Ashley models the number of customers as an arithmetic sequence (Model 1).

[ 1 ]
[Maximum number: 4]

George goes fishing. From experience he knows that the mean number of fish he catches per hour is 1.1 . It is assumed that the number of fish he catches can be modelled by a Poisson distribution.
On a day in which George spends 8 hours fishing, find the probability that he will catch more than 9 fish.

[Maximum number: 7]

The following question uses statistical tests to compare the weights of eggs in different situations.
Farmer Giles owns a chicken farm and sells eggs at the local market. He assumes that the weights of his eggs follow a normal distribution, with mean 52.0 g and standard deviation 3.7 g .
Giles selects 25 eggs at random.

(a)

Calculate the probability that the mean weight of these 25 eggs lies within 1 gram of the population mean.

In an effort to increase the mean weight of his eggs, Farmer Giles gives the chickens a new food, Chick Crackle, for one month. He then randomly selects 10 eggs and weighs them. His results, in grams, are shown in Table 1.

Table 1

Table 1

Farmer Giles assumes the weights of all his eggs are still normally distributed but believes the mean and standard deviation of the weights may have changed.

[ 3 ]
(b)

Find a 99 % confidence interval for the mean weight of Giles's eggs, after feeding his chickens Chick Crackle.

[ 2 ]
(c)

Determine the maximum value of SR2S_{R}{ }^{2} for the t-test to be valid.

[ 2 ]
[Maximum number: 7]

George is researching the growth in the number of electric vehicles (EVs) in the European Union in order to investigate some of the difficulties that might arise if the target of banning sales of all petrol and diesel cars in 2035 is to be met.
George begins his research by predicting how many electric vehicles (EVs) will be in the European Union in 2035.
The number of EVs in the European Union, N, measured in millions, is shown in the following table. The time t is measured in years from the beginning of 2016 where tRt \in \mathbb{R}.

Table

George models this data set using the logistic function N=3101+CektN=\frac{310}{1+C \mathrm{e}^{-k t}}, where C,kR+C, k \in \mathbb{R}^{+}.

(a)

Calculate the value of a correct to one decimal place.

[ 2 ]
(b)

Using the value of a correct to one decimal place, find the sum of square residuals, SSres S S_{\text {res }}, when using this model to predict the values of N.

As a measure of how well the model fits the data, George uses the error function, E, where E=SSresnE=\sqrt{\frac{S S_{r e s}}{n}}, and n is the number of predictions made using the model.

George decides he will use this model if E is less than 0.25 .

[ 2 ]
(c)

By finding the value of E for George's model, show that George will decide that the model can be used.

[ 3 ]
0