[Maximum number: 5]
Consider the following triangle, ABC , such that , and .
(a)
Find the value of .
[ 3 ]
(b)
Find the area of the triangle ABC .
[ 2 ]
 EduNinja
Consider the following triangle, ABC , such that , and .
Find the value of .
Find the area of the triangle ABC .
The following question examines the changes in darts players' scores using two statistical tests.
In the sport of darts, players take turns throwing darts at a board in order to score points.
A player's "three dart average" refers to the mean score achieved when throwing three darts.
Valia aimed to find out whether amateur darts players in her local area improved over a 12-month period. An increase in their "three dart average" would indicate an improvement.
She selected a random sample of eight darts players and recorded their mean "three dart average" from Year 1.
She then recorded their mean "three dart average" from Year 2.
Valia's results were as follows:
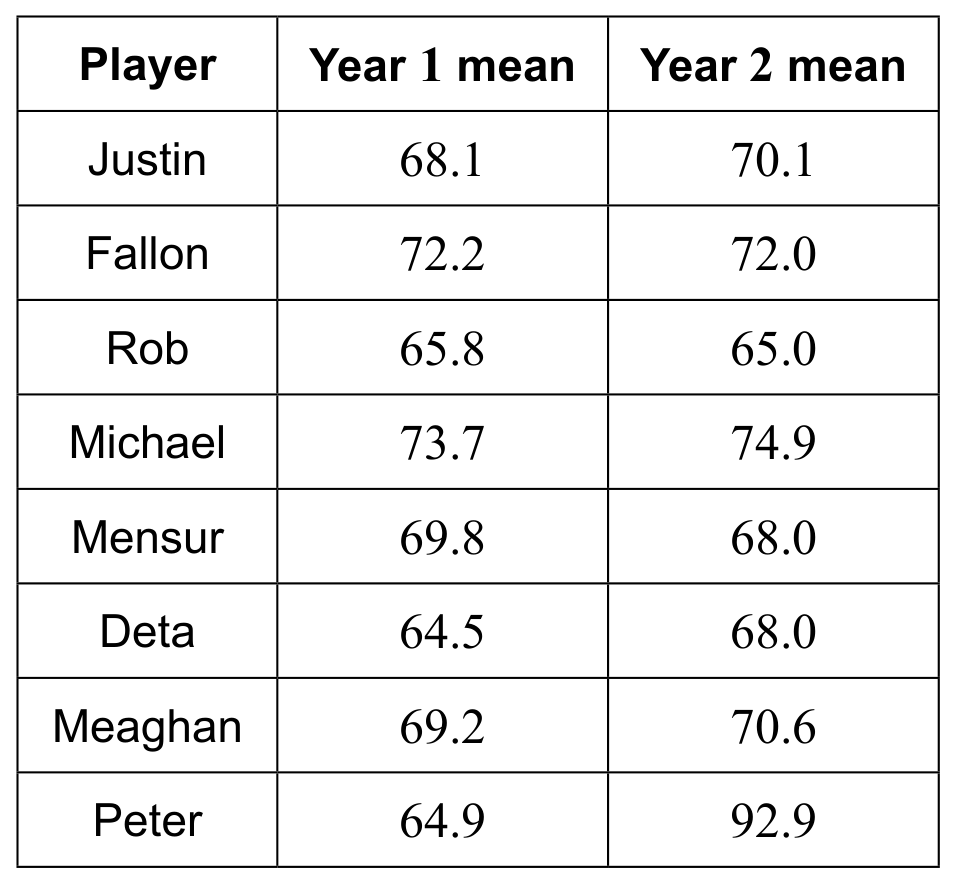
Table 1
Valia calculated the median, quartiles and inter-quartile range for each year. The results are shown in Table 2.
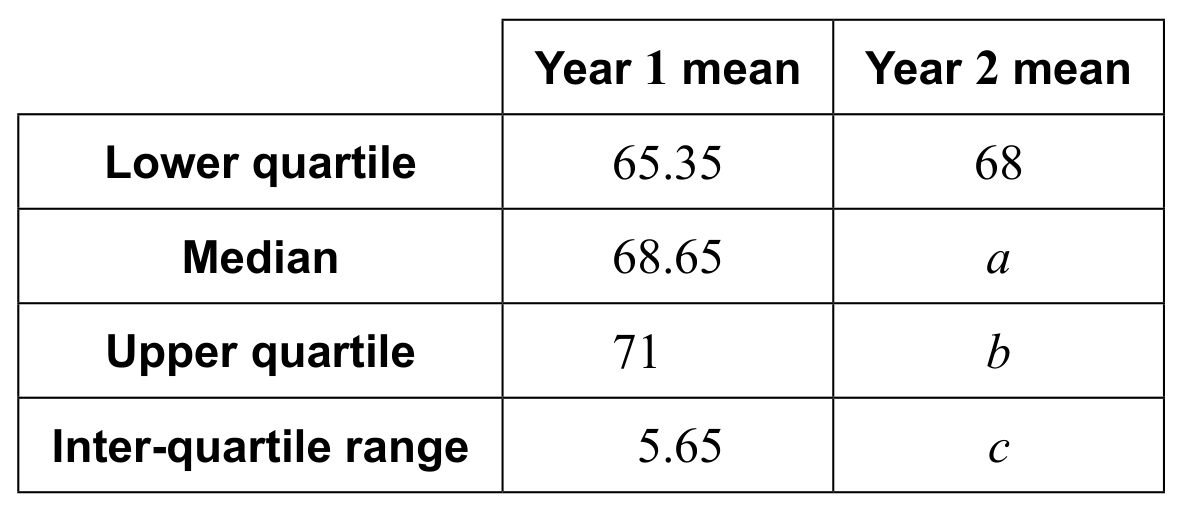
Table 2
Determine the values of a, b and c.
By comparing the results for both years summarized in Table 2, state one conclusion, in context, that Valia might be justified in making.
Valia then decided to analyse the data from Table 1 using a one-tailed paired t-test at the 10 % significance level to determine whether the players' averages have increased.
State an assumption about the differences in means that is necessary in order for the test to be valid.
State the null and alternative hypotheses for the test.
Find the p-value.
State the conclusion of the test in context, justifying your answer.
State one way Valia could have reduced the chance of her making
a Type I error.
a Type II error.
Valia was not sure the assumption made in part (c) was correct and hence thought the results obtained from her paired t-test may not be valid.
Following further research, Valia decided to use the Wilcoxon signed-rank test, which does not require the assumption she made in part (c).
For this test, the magnitudes of the differences between the Year 2 and Year 1 means are ranked from 1 to 8 , with the ranks of the positive differences ( P ) and the ranks of the negative differences ( N ) separated in columns.
This is partially shown in the following table, which Valia constructs to perform the test.
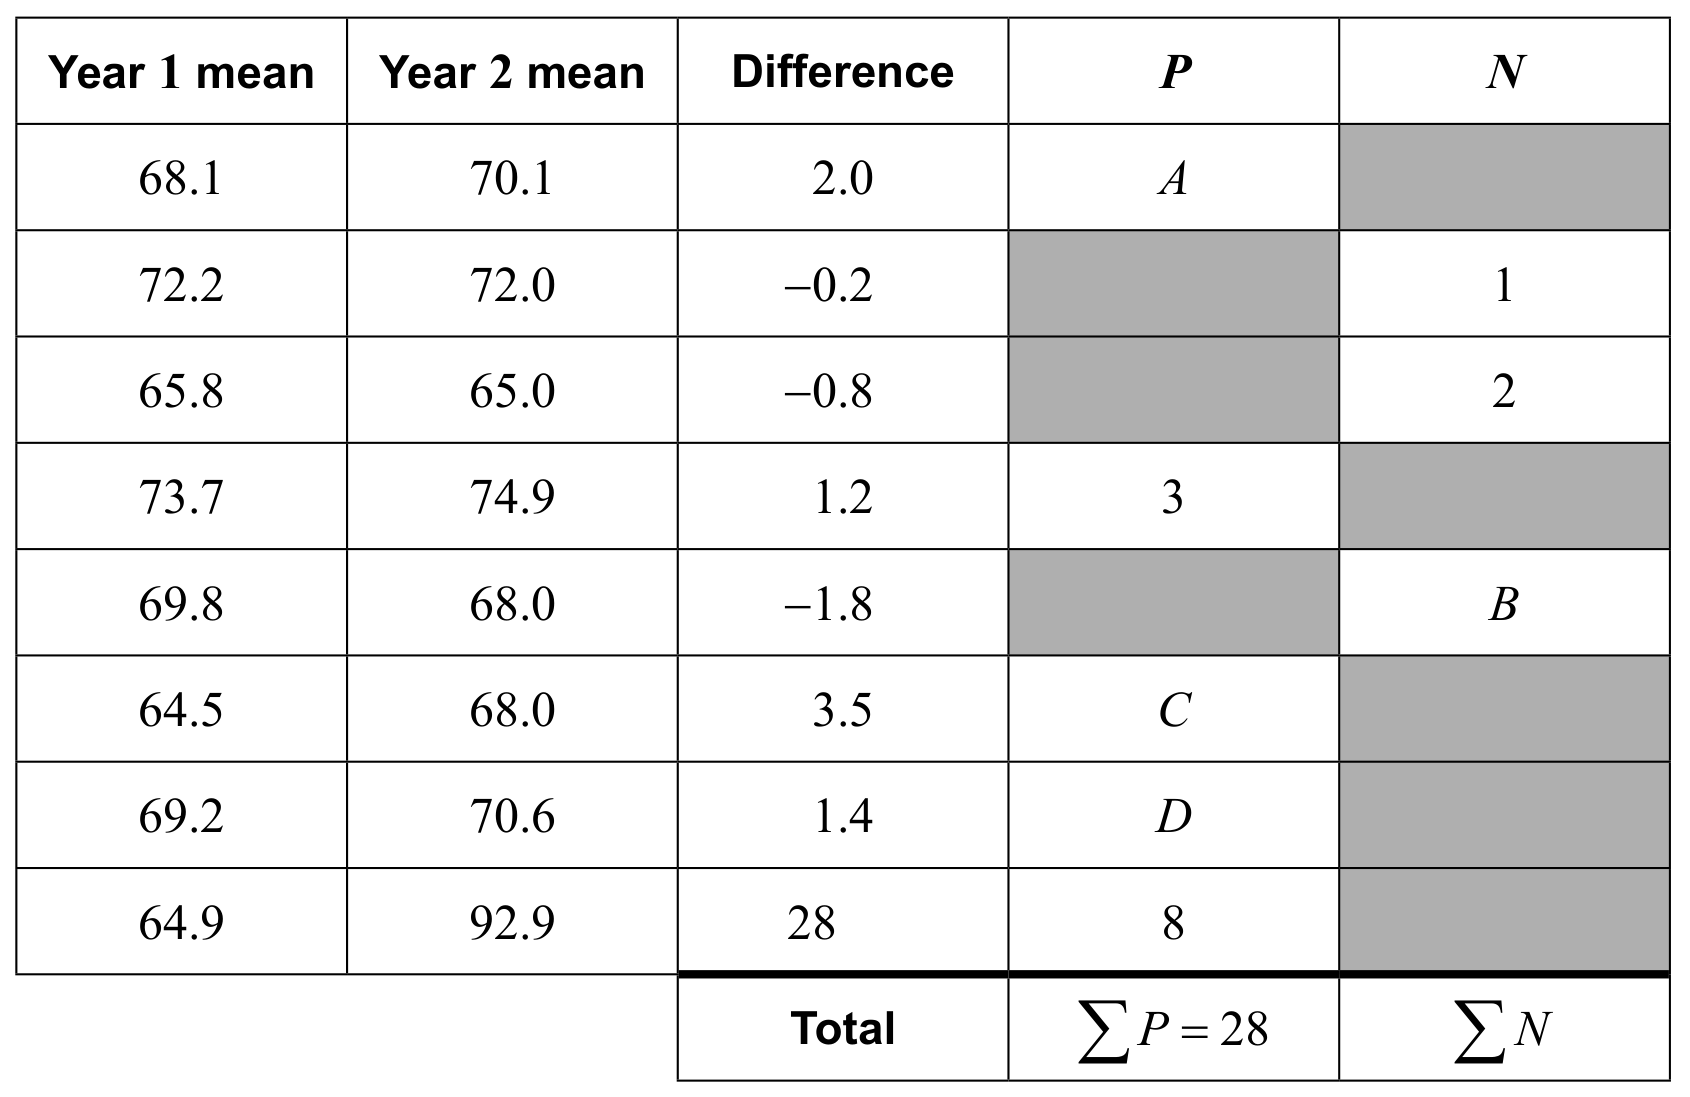
Determine the values of
and D.
.
For this test:
- the Wilcoxon signed-rank test statistic is T= the smaller value from a choice of or .
- the null hypothesis is that the population's median for "three dart average" is the same in both years.
Valia chooses to carry out the test at the 5 % level of significance. From statistical tables, she determines that the critical region is .
State the alternative hypothesis for this test.
Write down the value of the test statistic, T.
Determine the conclusion of the test in context.
Suggest briefly how Valia could assess the reliability of her results for either test.
The purpose of this question is to help a company decide whether or not they should use a new technique to make a component.
A factory produces components for a tractor. They have designed a new technique to produce one of their components that they hope will increase its useful lifespan.
They test 120 components made with the new technique and 240 with the technique they currently use. At the end of 250 hours of use, they check the components, and record whether they have no cracks, minor cracks or major cracks.
The data from the trial are given in the table.
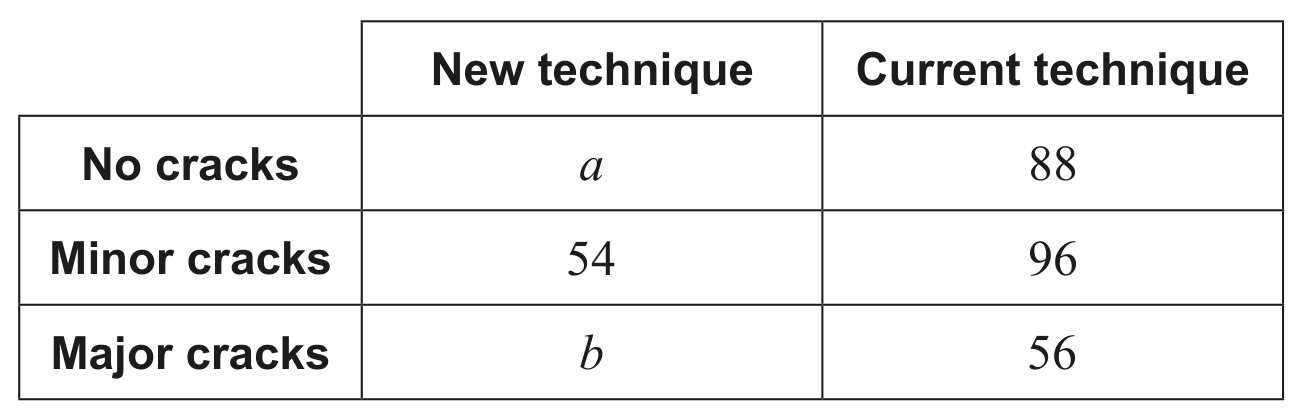
In total 141 components had no cracks.
Show that the value of a is 53 .
Find the value of b.
One of the components from the trial is selected at random.
Given that this component had minor cracks find the probability that it was produced by the new technique.
A test for independence is performed at the 5 % significance level to determine whether a component having no cracks, minor cracks or major cracks is independent of the production technique used.
State the null and alternative hypotheses.
Find the p-value.
State the conclusion of the test in context, justifying your answer.
For the components in the trial that were made with the current technique, show that the proportion which developed cracks is .
As an alternative measure, the researchers decide to let p be the probability that a component, made with the new technique, develops cracks. They then test the following hypotheses
In a randomly selected sample of 120 components made with the new technique let X be the number which developed cracks. The researchers assume that, under the null hypothesis, .
State one additional assumption that the researchers are making in choosing this distribution.
Use appropriate data from the trial to perform the test proposed by the researchers, at the 5 % significance level. State the conclusion of the test, justifying your answer.
In comparison with the test in part (c), state one mathematical reason why
the test in part (f) might be preferred.
the test in part (f) might not be preferred.
For these components, the researchers also consider the mean time taken until cracks develop. It is hoped that using the new technique will increase this value. A second trial is carried out and the times, in hours, taken for cracks to appear is recorded.
The mean time taken for cracks to appear ( ) and the value of for each technique are given in the following table.
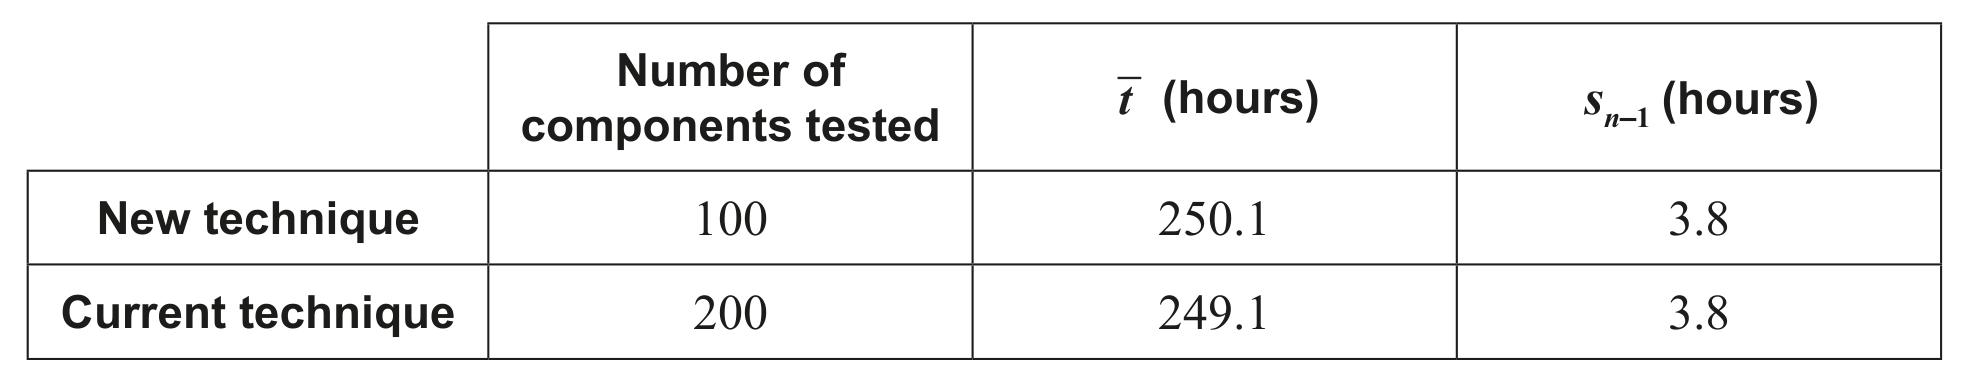
Perform an appropriate test at the 5 % significance level to determine whether the new technique increases the mean time taken for cracks to appear.
The company decides to go ahead with the new technique and publishes the following statement: "statistical tests show the new technique will significantly increase the time before components crack and need to be replaced".
Comment on this statement.
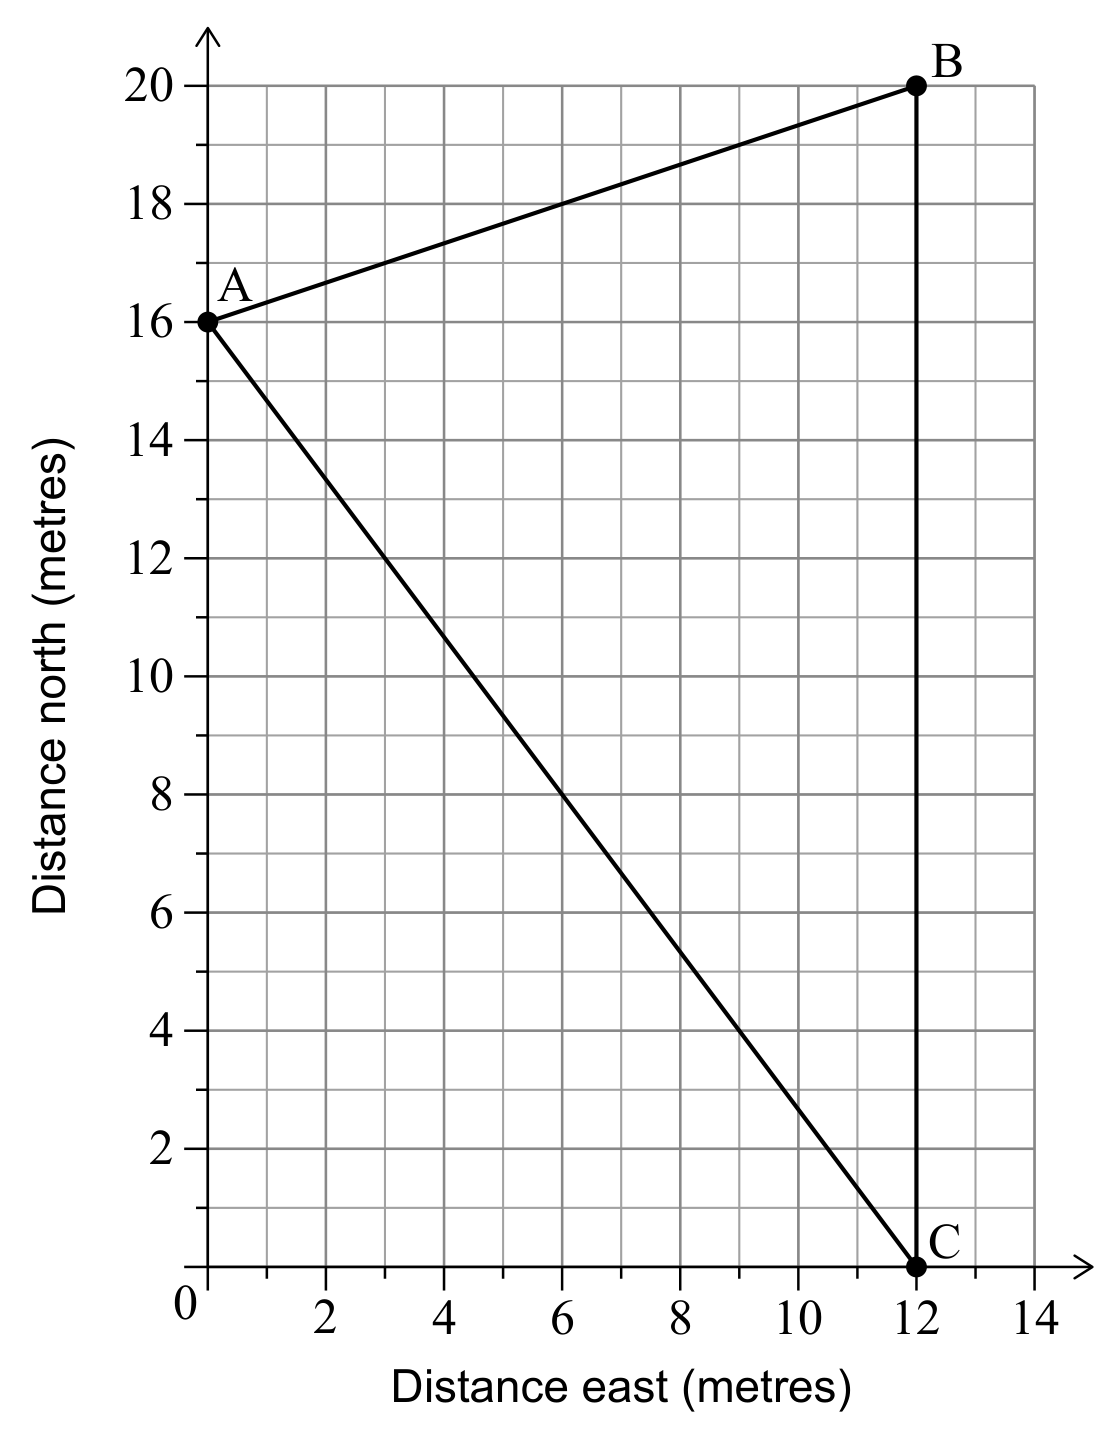
Mai is at an amusement park. A map of part of the amusement park is represented on the following coordinate axes.
Mai's favourite three attractions are positioned at A(0,16), B(12,20) and C(12,0). All measurements are in metres.
Write down the distance between B and C .
Calculate the distance between A and B .
Mai is standing at the attraction at B and wants to walk directly to the attraction at A .
Calculate the bearing of A from B .
A drinking fountain is to be installed at a point that is an equal distance from each of the attractions at A, B and C .
Write down the gradient of [AC].
Write down the mid-point of [AC].
Hence calculate the coordinates of the drinking fountain.
The company Fred Express delivers packages. From past experience, the time taken, T, to deliver a package follows a normal distribution with mean 64 hours and standard deviation 12 hours.
State P(T<64).
Find P(44<T<64).
30 % of packages are delivered in less than k hours.
Sketch a diagram of this normal distribution, shading the region that represents P(T<k).
Find the value of k.
For quality control, the manager randomly selects five outgoing packages. These selections are independent.
Find the probability that exactly two of these packages are delivered in less than k hours.
Fred Express charges a fixed amount of $ 4.50 for any package weighing 1 kg or less. Heavier packages are charged an additional fee of $ 2.00 per kg. This fee is applied for any weight in excess of 1 kg . For example, a 1.5 kg package is charged an additional $ 1.00.
Write down an expression for the amount charged to deliver a package of weight , where x>1.
Find the amount Fred Express charges for a 5.3 kg package.
Meiling is charged $7.20 for the delivery of a package.
Find the weight of Meiling's package.
Imani invests $ 3000 in a bank that pays a nominal annual interest rate of 1.25 % compounded monthly.
Calculate the amount of money Imani will have in the bank at the end of 6 years. Give your answer correct to two decimal places.
Calculate the number of months it takes until Imani has at least $ 3550 in the bank.
Imani uses the $ 3550 as a partial payment for a used car costing $ 22000. For the remainder she takes out a loan from a bank.
Write down the amount of money that Imani takes out as a loan.
The loan is for 8 years and the nominal annual interest rate is 12.6 % compounded monthly. Imani will pay the loan in fixed monthly instalments at the end of each month.
Calculate the amount, correct to the nearest dollar, that Imani will have to pay the bank each month.
Maan deposited $ 100000 into a savings account with a nominal annual interest rate of I % compounded monthly. At the end of the eighth year, the amount in the account had increased to $ 150000.
Find the value of I.
Maan withdraws the $ 150000 and places it in an annuity, earning a nominal annual interest rate of 6.1 % compounded monthly. At the end of each month, Maan will receive a payment of $ 1000.
Find the amount of money remaining in the annuity at the end of 10 years. Express your answer to the nearest dollar.
This question considers whether it is reasonable to go on all the rides in a theme park and get back to the entrance in two and a half hours.
Martin is visiting a theme park. He will enter the park at 09:00 and must leave the park by 11:30. He uses information available on the internet to calculate whether he will be able to go on all of the rides in the two and a half hours.
He begins by constructing a graph which shows the main paths between the rides and the route of the cable car between the entrance/exit A and ride D.
His graph and the names of the rides are shown in the following diagram.
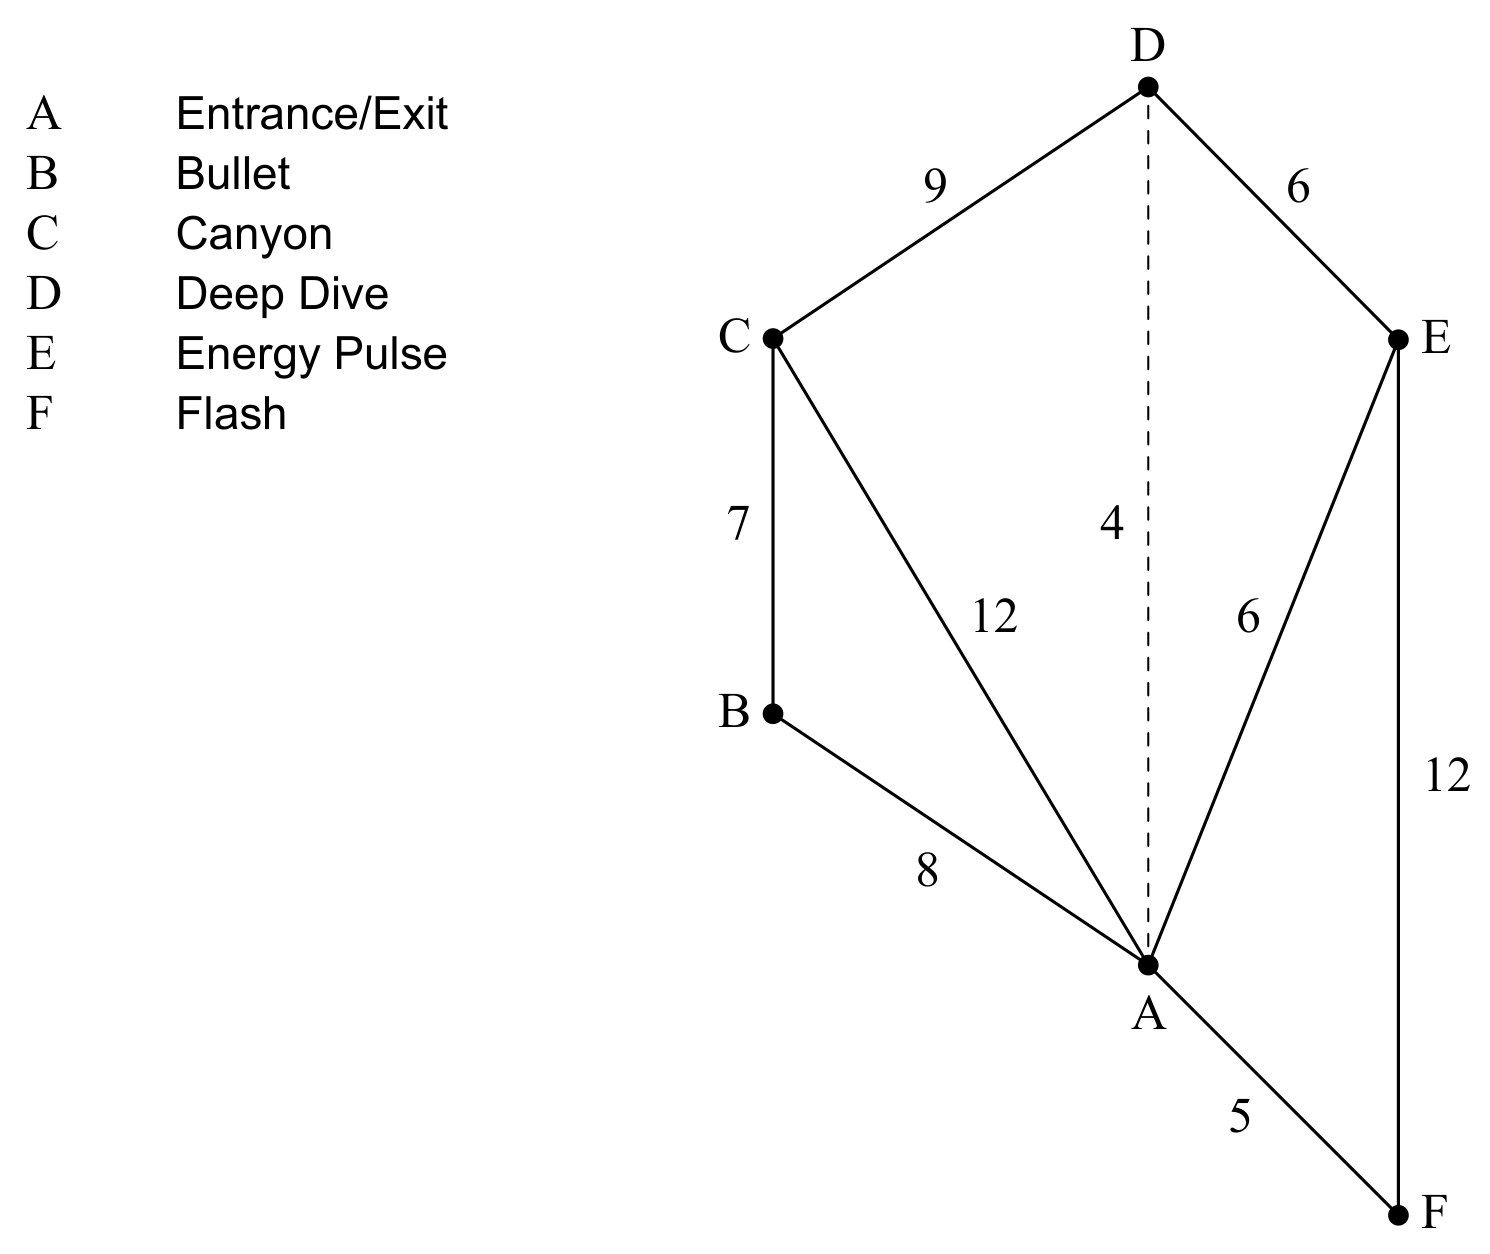
The weights on the edges of the graph represent the times, in minutes, to walk between the rides and the time to travel by cable car between A and D.
Let T be the shortest possible time, in minutes, taken to visit all the rides, beginning and ending at A .
Martin notices that the graph contains a Hamiltonian cycle. He decides to use the weight of the Hamiltonian cycle as an upper bound for T.
Find the weight of this Hamiltonian cycle.
Martin constructs Table 1 to show the shortest possible time it takes to travel between any two rides and between the entrance and any ride.
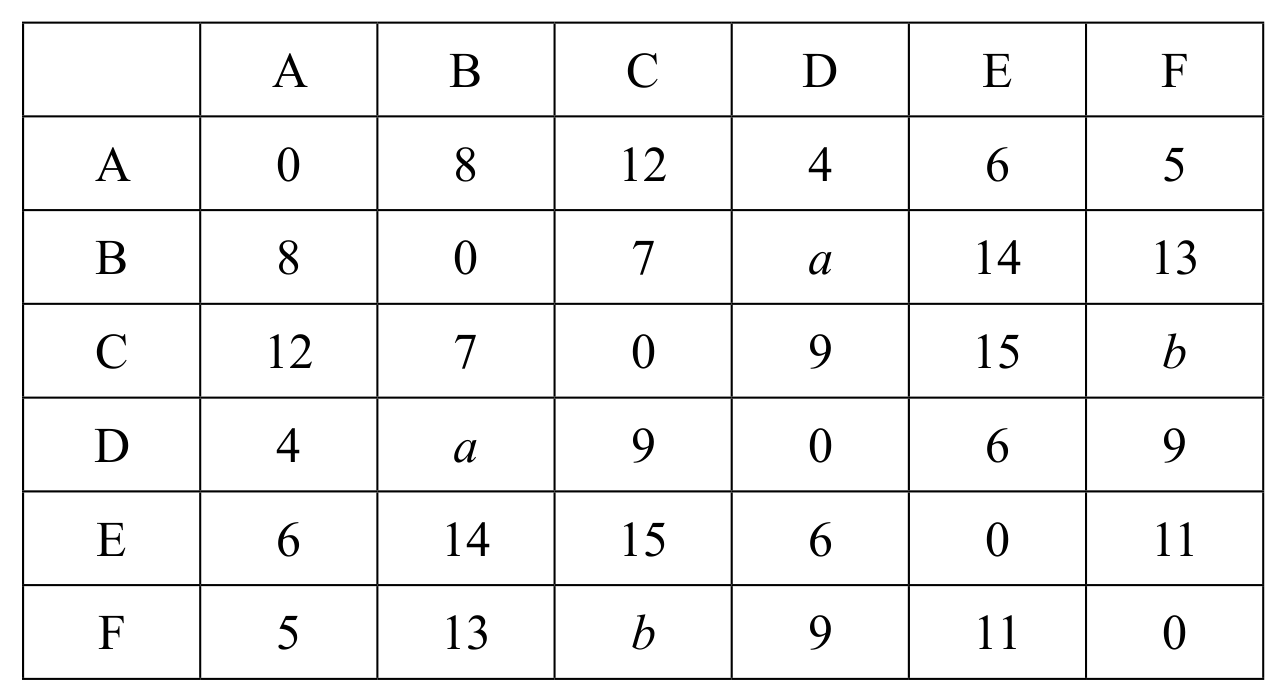
Table 1
Write down the value of
a;
b.
Use the nearest neighbour algorithm on Table 1 to find an upper bound for T.
Martin decides to use the deleted vertex algorithm to find a lower bound for T by first deleting vertex A. The shortest possible time to travel between each ride, with vertex A deleted, is given in Table 2.
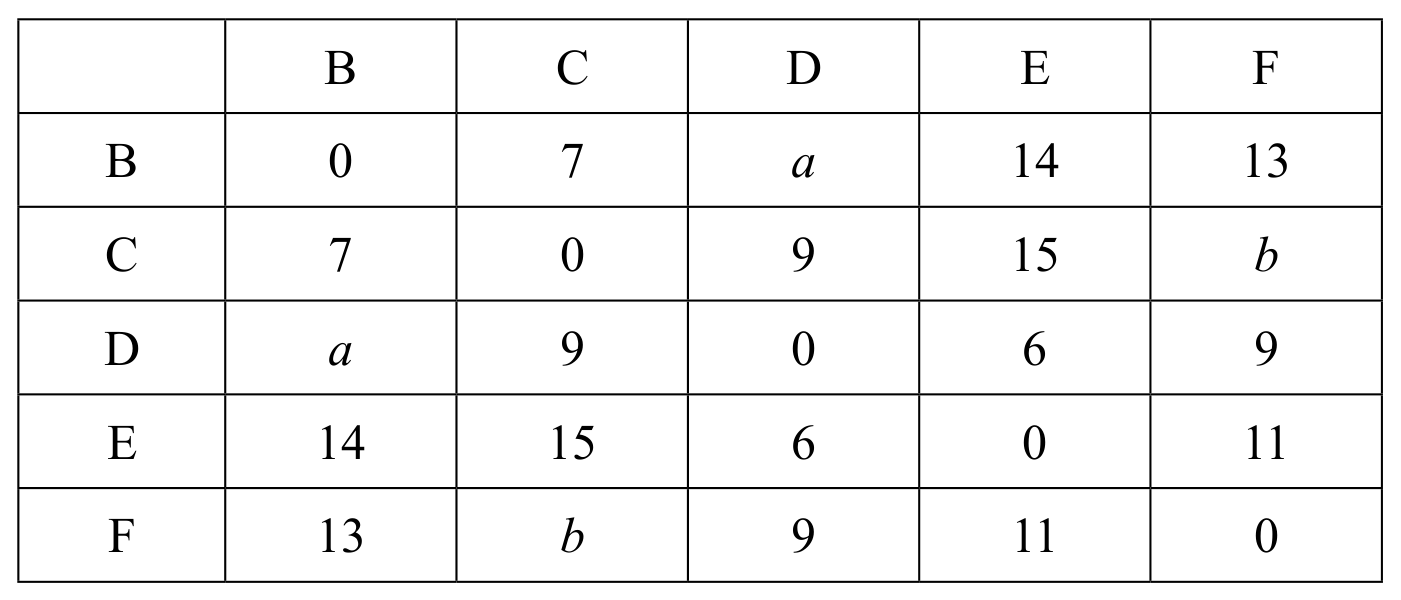
Table 2
Use Prim's algorithm on Table 2 to find the weight of the minimum spanning tree for the graph with vertices B, C, D, E and F.
Start at vertex B and write down the order in which the edges are selected.
Hence find a lower bound for T.
Martin finds more lower bounds for T, by deleting each vertex in turn. The results are shown in the following table.
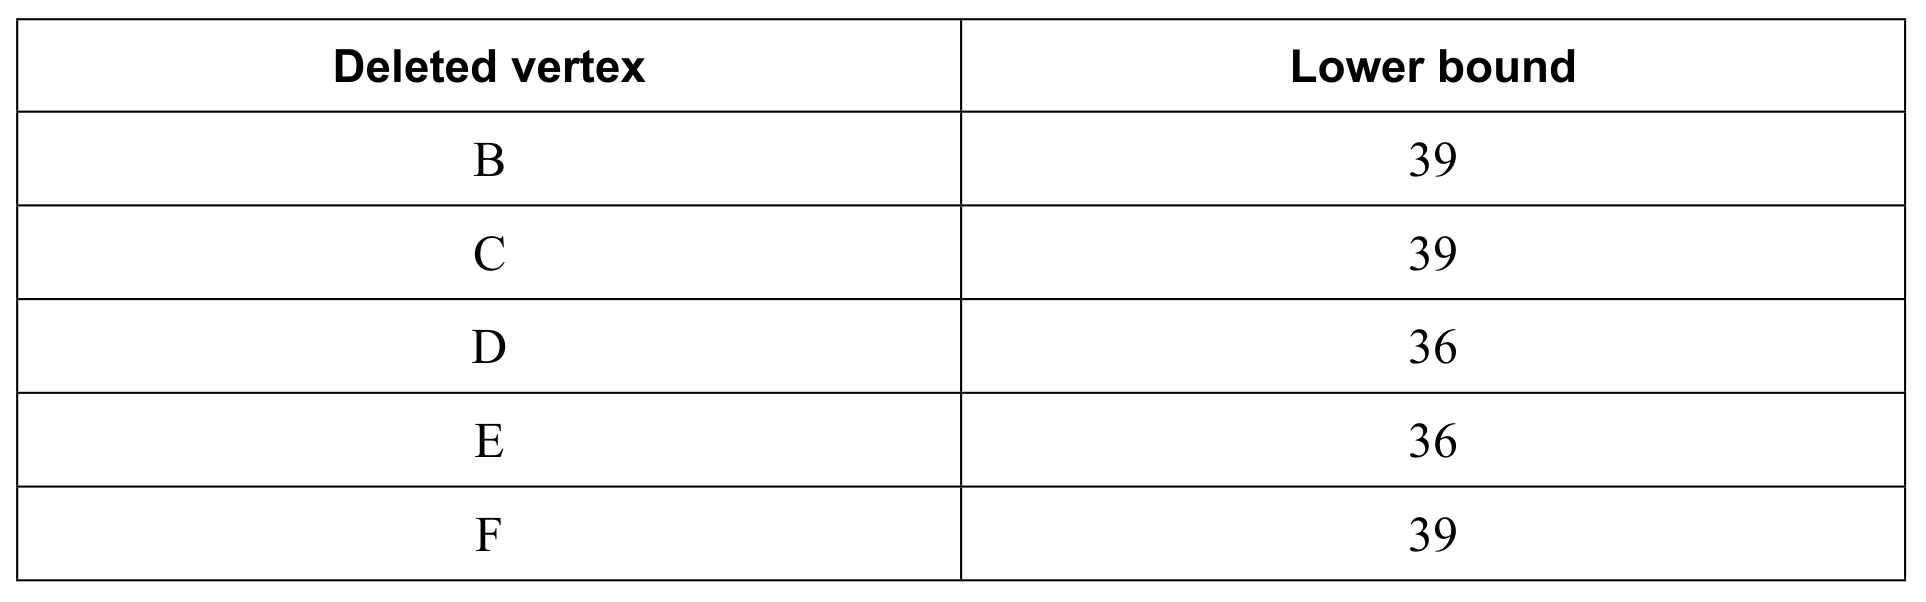
Martin finds the smallest possible interval within which T lies, based on his calculated values for upper and lower bounds. He writes his answer in the form .
Write down the value of
p;
q.
Martin's favourite ride is Energy Pulse (E), so he decides to go there first. He plans to begin at A and visit the rides in the order E, D, C, B, F before returning to A . For the rest of the question, assume that Martin is taking this route.
Find the shortest possible time it would take to complete this route.
State the edge which would need to be repeated.
Each of the rides takes 2 minutes to complete.
Let the time spent waiting in the queue for ride B be written as the random variable and similarly for the other rides.
The following distributions model the times spent waiting in the queues. Each waiting time is independent of all other waiting times and the time of day.
Find the distribution for the total time spent queuing for all five rides.
Find the probability that Martin manages to go on all five rides and return to the entrance in two and a half hours.
Martin enters the park at 09:00 and decides to follow his planned route, but has two consecutive rides on Energy Pulse.
Find the expected time he will leave the park.
Dr Petrillo wrote a short scientific essay. He analysed the readability of his essay by counting the number of letters in each word.
Dr Petrillo constructs a box and whisker diagram for his data.
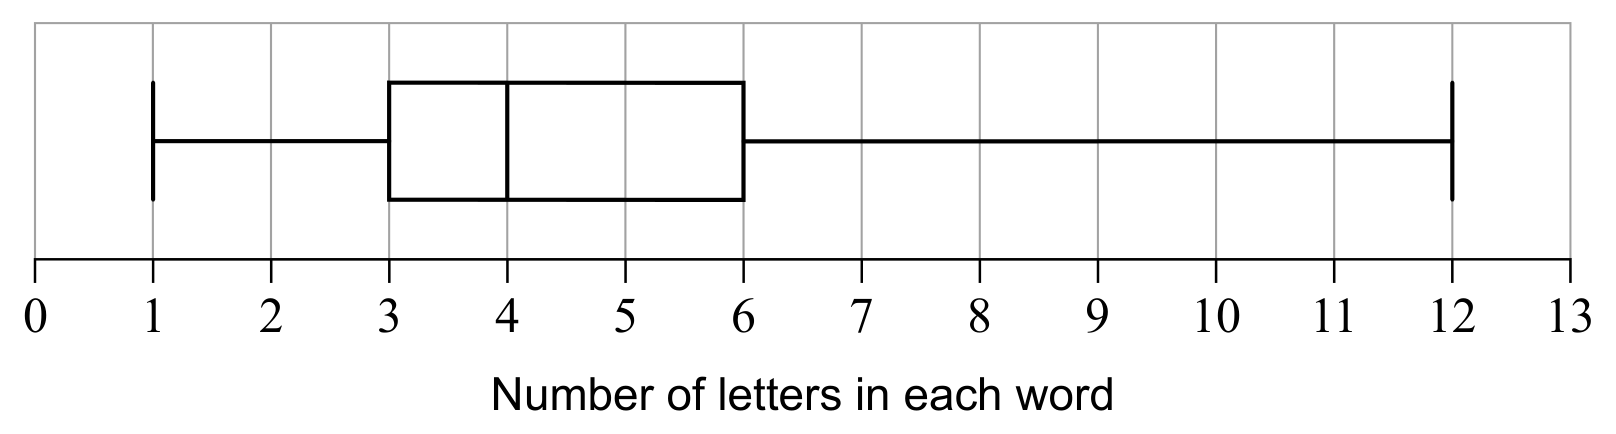
Write down
the median;
the upper quartile, ;
the interquartile range, IQR.
Dr Petrillo now wants to modify his diagram to show any outliers. He considers the longer words in his data and uses the following formula:
Words with at least k letters are considered outliers.
Find the value of k.
Dr Petrillo further considers the outliers and sees no reason to exclude them from his analysis.
The length of each word in the essay, n, and its associated frequency are given in the following table.
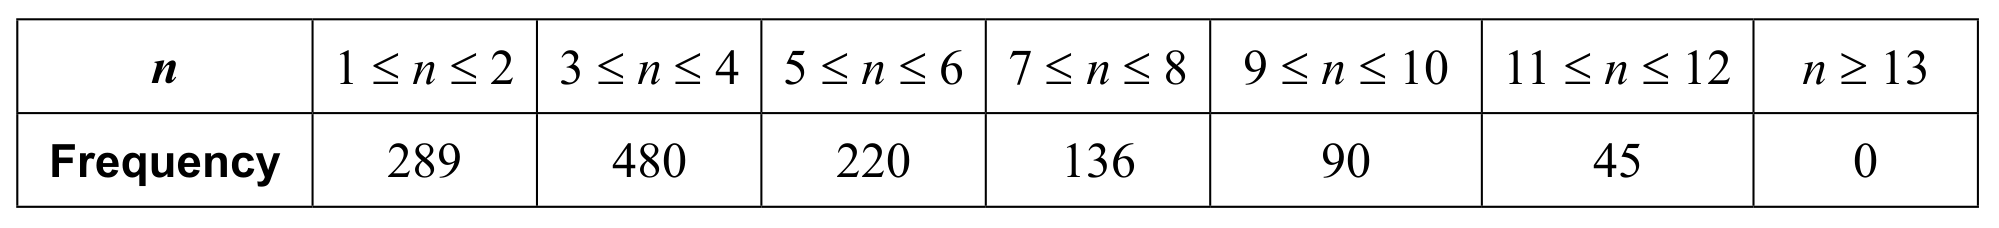
Use the mid-interval values to calculate an estimate of the mean number of letters in each word.
Dr Petrillo conducts a goodness of fit test at the 1 % significance level, to test the following null hypothesis:
: The frequency of the number of letters in each word in his essay is consistent with the English language.
Write down the alternative hypothesis for this test.
The observed and expected frequencies of the number of letters in each word in his essay are listed in the following table.
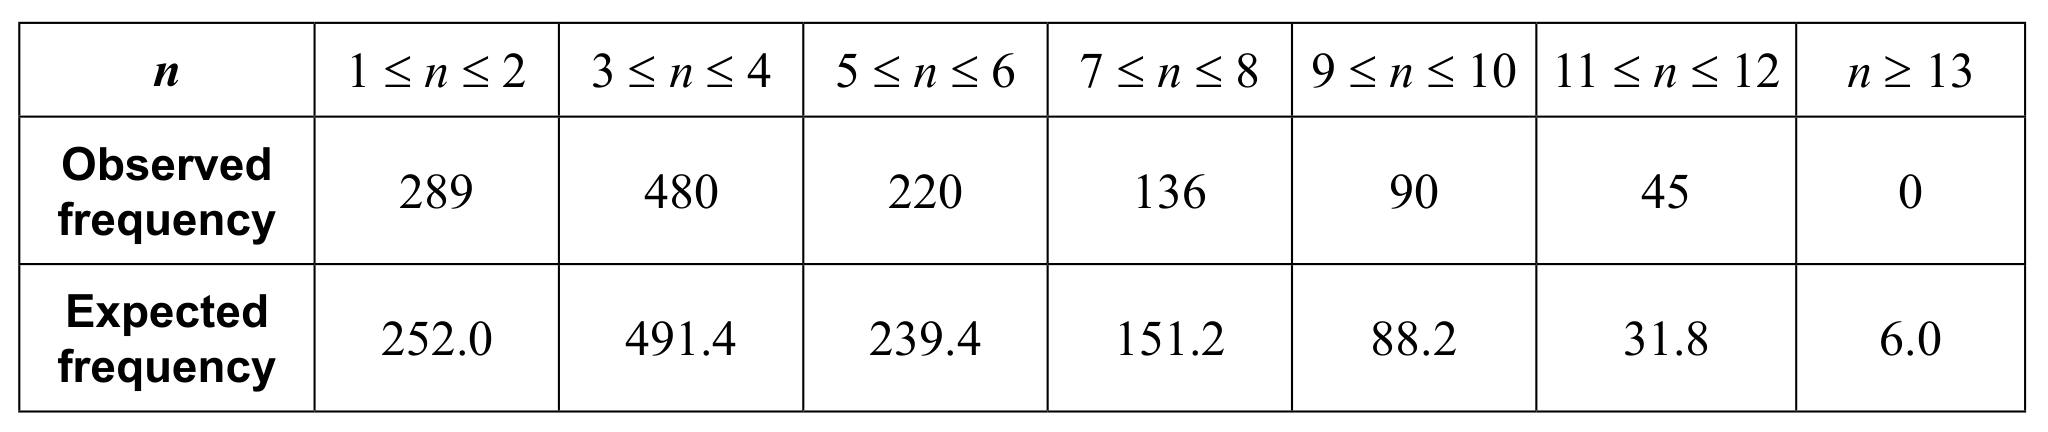
Write down the number of degrees of freedom.
Find the statistic for this test.
Find the p-value for this test.
The critical value for this test, at the 1 % significance level, is 16.812 .
State whether Dr Petrillo should reject the null hypothesis. Justify your answer.
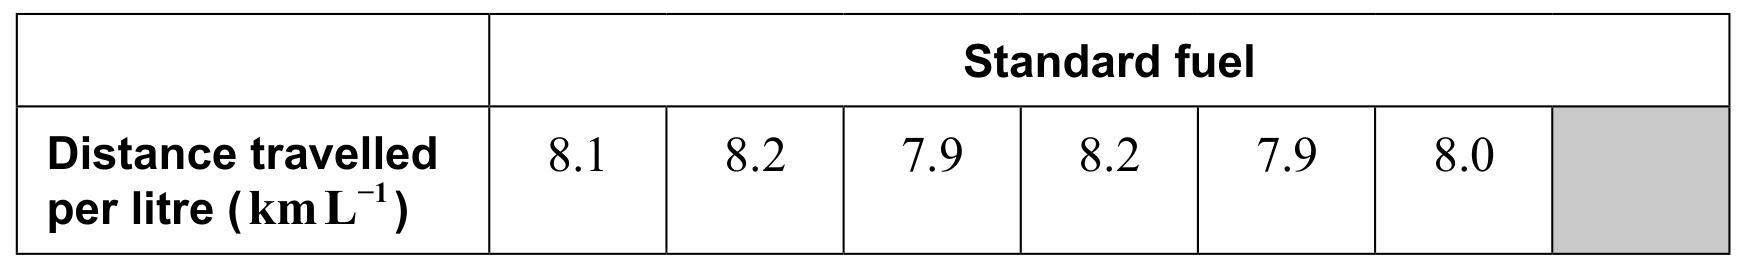
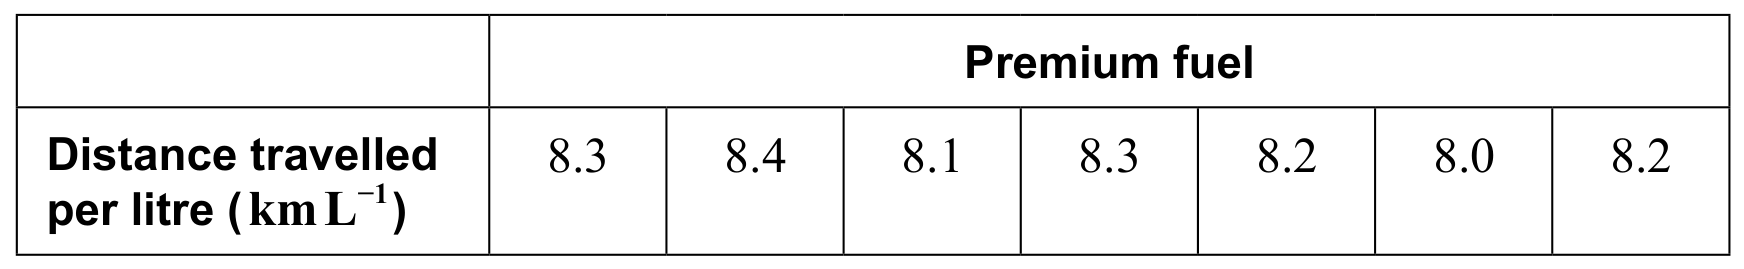
Under controlled driving conditions, Jacob investigated the fuel efficiency of his car when using premium fuel compared to standard fuel.
Jacob recorded the distance travelled per litre ( ) using standard fuel for six days and then using premium fuel for seven days. This information is shown in the following tables.
At the 5 % significance level, Jacob performs a t-test to determine whether there is sufficient evidence that his car travels further using premium fuel compared to standard fuel.
State one mathematical assumption made for this test to be valid.
Write down the
null hypothesis.
alternative hypothesis.
Find the p-value.
State your conclusion to the test in context. Justify your answer.