EduNinja
IB Maths AI HL/Question Bank/4 Statistics and probability

IB Maths AI HL4 Statistics and probabilityQuestion Bank

HL125 questions10 previewsSyllabus linked
[Maximum number: 3]

This question explores how graph algorithms can be applied to a graph with an unknown edge weight.
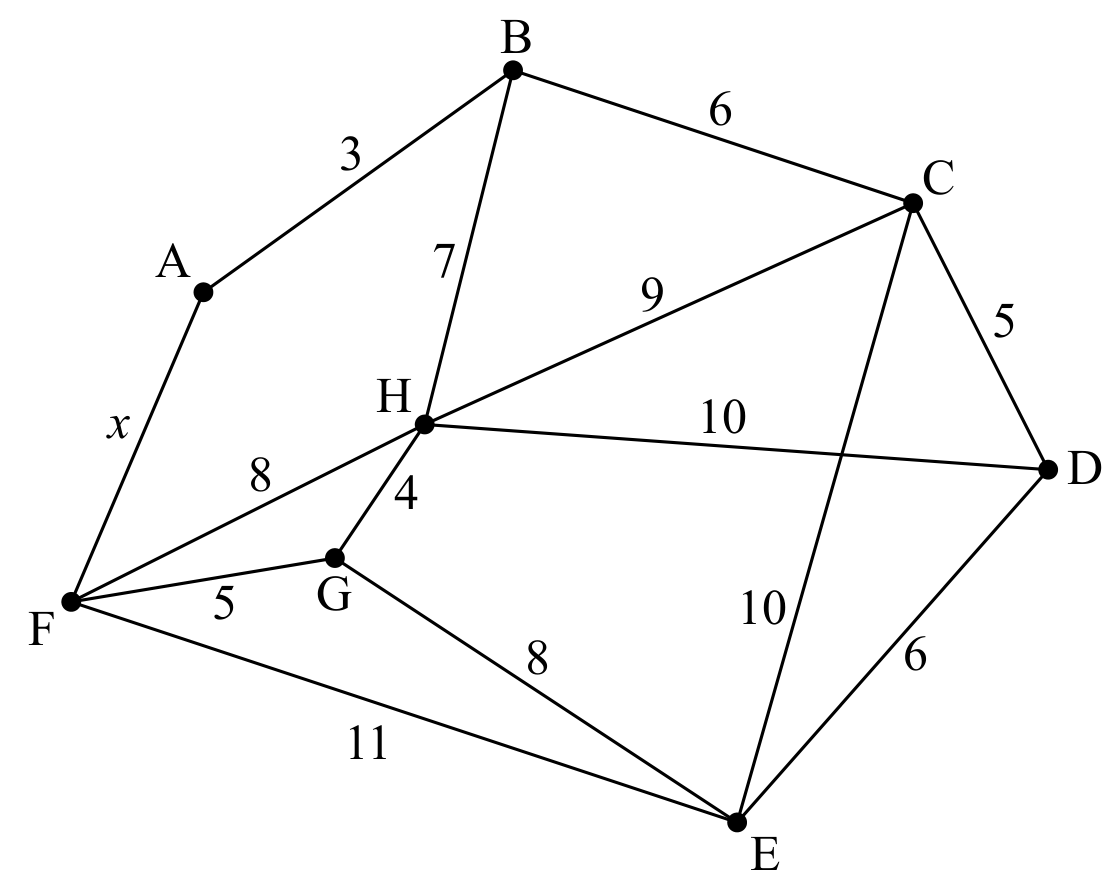
Graph W is shown in the following diagram. The vertices of W represent tourist attractions in a city. The weight of each edge represents the travel time, to the nearest minute, between two attractions. The route between A and F is currently being resurfaced and this has led to a variable travel time. For this reason, AF has an unknown travel time x minutes, where xZ+x \in \mathbb{Z}^{+}.

Question image
(a)

Write down the value of

[ 3 ]
(i)

p;

[ 1 ]
(ii)

q;

[ 1 ]
(iii)

r.

To find an upper bound for Daniel's travel time, the nearest neighbour algorithm is used, starting at vertex A.

[ 1 ]
[Maximum number: 24]

Juliet is a sociologist who wants to investigate if income affects happiness amongst doctors. This question asks you to review Juliet's methods and conclusions.
Juliet obtained a list of email addresses of doctors who work in her city. She contacted them and asked them to fill in an anonymous questionnaire. Participants were asked to state their annual income and to respond to a set of questions. The responses were used to determine a happiness score out of 100 . Of the 415 doctors on the list, 11 replied.

(a)
(i)

Describe one way in which Juliet could improve the reliability of her investigation.

[ 1 ]
(ii)

Describe one criticism that can be made about the validity of Juliet's investigation.

Juliet's results are summarized in the following table.

Table
[ 1 ]
(b)

Juliet classifies response K as an outlier and removes it from the data. Suggest one possible justification for her decision to remove it.

[ 1 ]
(c)

For the remaining ten responses in the table, Juliet calculates the mean happiness score to be 52.5.

[ 4 ]
(i)

Calculate the mean annual income for these remaining responses.

[ 2 ]
(ii)

Determine the value of r, Pearson's product-moment correlation coefficient, for these remaining responses.

Juliet decides to carry out a hypothesis test on the correlation coefficient to investigate whether increased annual income is associated with greater happiness.

[ 2 ]
(d)
(i)

State why the hypothesis test should be one-tailed.

[ 1 ]
(ii)

State the null and alternative hypotheses for this test.

The critical value for this test, at the 5 % significance level, is 0.549 . Juliet assumes that the population is bivariate normal.

[ 2 ]
(iii)

Determine whether there is significant evidence of a positive correlation between annual income and happiness. Justify your answer.

[ 2 ]
(e)

Juliet wants to create a model to predict how changing annual income might affect happiness scores. To do this, she assumes that annual income in dollars, X, is the independent variable and the happiness score, Y, is the dependent variable.

She first considers a linear model of the form

Y=a X+b
[ 7 ]
(i)

Use Juliet's data to find the value of a and of b.

[ 1 ]
(ii)

Interpret, referring to income and happiness, what the value of a represents.

Juliet then considers a quadratic model of the form

Y=cX2+dX+eY=c X^{2}+d X+e
[ 1 ]
(iii)

Find the value of c, of d and of e.

[ 1 ]
(iv)

Find the coefficient of determination for each of the two models she considers.

[ 2 ]
(v)

Hence compare the two models.

Juliet decides to use the coefficient of determination to choose between these two models.

[ 1 ]
(vi)

Comment on the validity of her decision.

After presenting the results of her investigation, a colleague questions whether Juliet's sample is representative of all doctors in the city.

A report states that the mean annual income of doctors in the city is $ 80000. Juliet decides to carry out a test to determine whether her sample could realistically be taken from a population with a mean of $ 80000.

[ 1 ]
(f)
(i)

State the name of the test which Juliet should use.

[ 1 ]
(ii)

State the null and alternative hypotheses for this test.

[ 1 ]
(iii)

Perform the test, using a 5 % significance level, and state your conclusion in context.

[ 3 ]
[Maximum number: 4]

George goes fishing. From experience he knows that the mean number of fish he catches per hour is 1.1 . It is assumed that the number of fish he catches can be modelled by a Poisson distribution.
On a day in which George spends 8 hours fishing, find the probability that he will catch more than 9 fish.

[Maximum number: 27]

This question uses statistical tests to investigate whether advertising leads to increased profits for a grocery store.

Aimmika is the manager of a grocery store in Nong Khai. She is carrying out a statistical analysis on the number of bags of rice that are sold in the store each day. She collects the following sample data by recording how many bags of rice the store sells each day over a period of 90 days.

Table

She believes that her data follows a Poisson distribution.

(a)
(i)

Find the mean and variance for the sample data given in the table.

[ 2 ]
(ii)

Hence state why Aimmika believes her data follows a Poisson distribution.

[ 1 ]
(b)

State one assumption that Aimmika needs to make about the sales of bags of rice to support her belief that it follows a Poisson distribution.

[ 1 ]
(c)

Aimmika knows from her historic sales records that the store sells an average of 4.2 bags of rice each day. The following table shows the expected frequency of bags of rice sold each day during the 90 day period, assuming a Poisson distribution with mean 4.2.

Table

Find the value of a, of b, and of c. Give your answers to 3 decimal places.

[ 5 ]
(d)

Aimmika decides to carry out a χ2\chi^{2} goodness of fit test at the 5 % significance level to see whether the data follows a Poisson distribution with mean 4.2.

[ 8 ]
(i)

Write down the number of degrees of freedom for her test.

[ 1 ]
(ii)

Perform the χ2\chi^{2} goodness of fit test and state, with reason, a conclusion.

[ 7 ]
(e)

Aimmika claims that advertising in a local newspaper for 300 Thai Baht (THB) per day will increase the number of bags of rice sold. However, Nichakarn, the owner of the store, claims that the advertising will not increase the store's overall profit.

Nichakarn agrees to advertise in the newspaper for the next 60 days. During that time, Aimmika records that the store sells 282 bags of rice with a profit of 495 THB on each bag sold.

Aimmika wants to carry out an appropriate hypothesis test to determine whether the number of bags of rice sold during the 60 days increased when compared with the historic sales records.

[ 7 ]
(i)

By finding a critical value, perform this test at a 5 % significance level.

[ 6 ]
(ii)

Hence state the probability of a Type I error for this test.

[ 1 ]
(f)

By considering the claims of both Aimmika and Nichakarn, explain whether the advertising was beneficial to the store.

[ 3 ]
[Maximum number: 22]

This question is about modelling the spread of a computer virus to predict the number of computers in a city which will be infected by the virus.
A systems analyst defines the following variables in a model:
- t is the number of days since the first computer was infected by the virus.
- Q(t) is the total number of computers that have been infected up to and including day t.
The following data were collected:

Table
(a)
(i)

Find the equation of the regression line of Q(t) on t.

[ 2 ]
(ii)

Write down the value of r, Pearson's product-moment correlation coefficient.

[ 1 ]
(iii)

Explain why it would not be appropriate to conduct a hypothesis test on the value of r found in (a)(ii).

A model for the early stage of the spread of the computer virus suggests that

Q(t)=βNQ(t)Q^{\prime}(t)=\beta N Q(t)

where N is the total number of computers in a city and β\beta is a measure of how easily the virus is spreading between computers. Both N and β\beta are assumed to be constant.

[ 1 ]
(b)
(i)

Using the data in the table write down the equation for an appropriate non-linear regression model.

[ 2 ]
(ii)

Write down the value of R2R^{2} for this model.

[ 1 ]
(iii)

Hence comment on the suitability of the model from (b)(ii) in comparison with the linear model found in part (a).

[ 2 ]
(iv)

By considering large values of t write down one criticism of the model found in (b)(ii).

[ 1 ]
(c)

Find in which city, X or Y, the computer virus is spreading more easily. Justify your answer using your results from part (b).

[ 3 ]
(d)

An estimate for Q(t),t5Q^{\prime}(t), t \geq 5, can be found by using the formula:

Q(t)Q(t+5)Q(t5)10Q^{\prime}(t) \approx \frac{Q(t+5)-Q(t-5)}{10}

The following table shows estimates of Q(t)Q^{\prime}(t) for city X at different values of t.

Table

Determine the value of a and of b. Give your answers correct to one decimal place.

An improved model for Q(t), which is valid for large values of t, is the logistic differential equation

Q(t)=kQ(t)(1Q(t)L)Q^{\prime}(t)=k Q(t)\left(1-\frac{Q(t)}{L}\right)

where k and L are constants.
Based on this differential equation, the graph of Q(t)Q(t)\frac{Q^{\prime}(t)}{Q(t)} against Q(t) is predicted to be a straight line.

[ 2 ]
(e)
(i)

Use linear regression to estimate the value of k and of L.

[ 5 ]
(ii)

The solution to the differential equation is given by

Q(t)=L1+CektQ(t)=\frac{L}{1+C \mathrm{e}^{-k t}}

where C is a constant.
Using your answer to part (f)(i), estimate the percentage of computers in city X that are expected to have been infected by the virus over a long period of time.

[ 2 ]
[Maximum number: 16]

In this question, you will explore possible approaches to using historical sports results for making predictions about future sports matches.
Two friends, Peter and Helen, are discussing ways of predicting the outcomes of international football matches involving Argentina.
Peter suggests analysing historical data to help make predictions. He lists the results of the most recent 240 matches in which Argentina played, in chronological order, then considers blocks of four matches at a time. He counts how many times Argentina has won in each block. The following table shows his results for the 60 blocks of four matches.

Table
(a)

Determine the mean number of wins per block of four matches for Argentina.

Peter thinks that this data can be modelled by a binomial distribution with n=4 and decides to carry out a χ2\chi^{2} goodness of fit test.

[ 2 ]
(b)

Use Peter's data to write down an estimate for the probability p for this binomial model.

[ 1 ]
(c)
(i)

Use the binomial model to find the probability that Argentina win zero matches in a block of four matches.

[ 1 ]
(ii)

Find the expected frequency for zero wins.

As some expected frequencies are less than 5, Peter combines rows in his table to produce the following observed frequencies. He then uses his binomial model to find appropriate expected frequencies, correct to one decimal place.

Table
[ 2 ]
(d)

Peter uses this table to carry out a χ2\chi^{2} goodness of fit test, to test the hypothesis that the data follows a binomial distribution with n=4, at the 5 % significance level.

For this test, state

[ 6 ]
(i)

the null hypothesis;

[ 1 ]
(ii)

the number of degrees of freedom;

[ 1 ]
(iii)

the p-value;

[ 2 ]
(iv)

the conclusion, justifying your answer.

[ 2 ]
(e)

Using Peter's binomial model, find the probability that Argentina will win at least one of their next four international football matches.

Helen thinks that a better prediction might be made by considering the transition between matches. To keep the model simple, she decides to use only two states: Argentina won (A) or Argentina did not win (B). Helen looks at Peter's list of results and counts the number of times that:
- Argentina won, twice in succession (AA),
- Argentina won, then did not win (AB),
- Argentina did not win, then won (BA),
- Argentina did not win, twice in succession (BB).

She recorded the following results.

Table

Helen uses the relative frequencies to estimate the probabilities in a transition matrix.

[ 2 ]
(f)
(i)

Given that Argentina won the previous match, show that Helen's estimate for the probability of Argentina winning the next match is 1729\frac{17}{29}.

[ 2 ]
[Maximum number: 22]

At Mirabooka Primary School, a survey found that 68 % of students have a dog and 36 % of students have a cat. 14 % of students have both a dog and a cat.
This information can be represented in the following Venn diagram, where m, n, p and q represent the percentage of students within each region.

Question image
(a)

Find the value of

[ 4 ]
(i)

m.

(ii)

n.

(iii)

p.

(iv)

q.

[ 4 ]
(b)

Find the probability that a randomly chosen student

[ 3 ]
(i)

has a dog but does not have a cat.

(ii)

has a dog given that they do not have a cat.

Each year, one student is chosen randomly to be the school captain of Mirabooka Primary School.

Tim is using a binomial distribution to make predictions about how many of the next 10 school captains will own a dog. He assumes that the percentages found in the survey will remain constant for future years and that the events "being a school captain" and "having a dog" are independent.

Use Tim's model to find the probability that in the next 10 years

[ 3 ]
(c)
(i)

5 school captains have a dog.

[ 7 ]
(ii)

more than 3 school captains have a dog.

(iii)

exactly 9 school captains in succession have a dog.

John randomly chooses 10 students from the survey.

[ 7 ]
(d)

State why John should not use the binomial distribution to find the probability that 5 of these students have a dog.

[ 1 ]
[Maximum number: 5]

Sergio is interested in whether an adult's favourite breakfast berry depends on their income level. He obtains the following data for 341 adults and decides to carry out a χ2\chi^{2} test for independence, at the 10 % significance level.

Table
(a)

Write down the null hypothesis.

[ 1 ]
(b)

Find the value of the χ2\chi^{2} statistic.

The critical value of this χ2\chi^{2} test is 7.78 .

[ 2 ]
(c)

Write down Sergio's conclusion to the test in context. Justify your answer.

[ 2 ]
[Maximum number: 8]

The mean annual temperatures for Earth, recorded at fifty-year intervals, are shown in the table.

Table

Tami creates a linear model for this data by finding the equation of the straight line passing through the points with coordinates (1708,8.73) and (1958,9.45).

(a)
(i)

Find the equation of the regression line y on x.

[ 3 ]
(ii)

Find the value of r, the Pearson's product-moment correlation coefficient.

[ 3 ]
(b)

Use Thandizo's model to estimate the mean annual temperature in the year 2000.

[ 2 ]
[Maximum number: 1]

This question uses differential equations to model the maximum velocity of a skydiver in free fall.
In 2012, Felix Baumgartner jumped from a height of 40000 m . He was attempting to travel at the speed of sound, 330 m s1330 \mathrm{~m} \mathrm{~s}^{-1}, whilst free-falling to the Earth.
Before making his attempt, Felix used mathematical models to check how realistic his attempt would be. The simplest model he used suggests that

dv dt=g\frac{\mathrm{d} v}{\mathrm{~d} t}=g

where v m s1v \mathrm{~m} \mathrm{~s}^{-1} is Felix's velocity and g ms2g \mathrm{~ms}^{-2} is the acceleration due to gravity. The time since he began to free-fall is t seconds and the displacement from his initial position is s metres.

Throughout this question, the direction towards the centre of the Earth is taken to be positive and v is a positive quantity.

When s=0, it is given that Felix jumps with an initial velocity v=10.

(a)

To test the model

dv dt=g\frac{\mathrm{d} v}{\mathrm{~d} t}=g

Felix conducted a trial jump from a lower height, and data for v against t was found.

[ 1 ]
(i)

Use the plot to comment on the validity of the model in part (a).

[ 1 ]
0